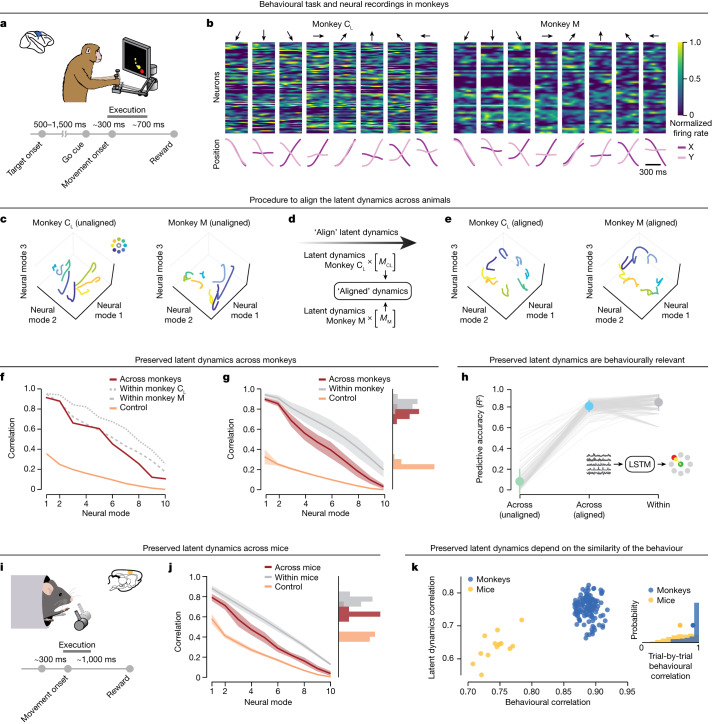
Fig. 2. Preserved latent dynamics across animals performing the same behaviour.
a, Monkeys performed an eight-target instructed-delay centre-out reaching task using a planar manipulandum. b, Example normalized neural firing rates aligned to movement onset (top) and hand trajectories (bottom) for two monkeys. Each column shows one reach to the eight targets indicated by the arrows. Note that monkey C received two sets of motor cortical implants, CL and CR, with CL denoting the implant in the left hemisphere and CR the implant in the right hemisphere. c–e, Three-dimensional representation of the motor cortical latent dynamics for the two monkeys plotted in b before (c) and after (e) alignment with CCA (d). f, Correlations of the aligned (red) latent dynamics for the example comparison in c–e compared to within-monkey correlations (grey) and a lower-bound control (orange). g, Preserved latent dynamics across all pairs of 21 sessions (n = 126 comparisons) from three different monkeys. Histograms show the mean correlation across the leading four dimensions. Line and shaded area, mean ± s.d. h, Decoders trained on aligned latent dynamics from one monkey predict continuous hand kinematics of a different monkey (blue). Results compared to decoders trained and tested within the same session (grey) and without alignment (green). Data points, individual comparisons (n = 126) between sessions from different monkeys. Error bars, mean ± s.d. Statistical tests: two-sided Wilcoxon’s rank sum test, P = 3.1 × 10⁻⁶ for decoding performance between across-animal correlation and within-animal correlation, P = 2.0 × 10⁻²² between across-animal correlation and lower bound. i, Mice grasped and pulled a joystick in two positions (left or right). j, Preserved latent dynamics across mice performing the grasping and pulling task. Data include six sessions across four different mice (n = 13 comparisons), formatted as in g. k, Preserved latent dynamics across animals is related to the similarity of their behaviour. For each session pair, the mean of the top four canonical correlations (CCs) between the latent dynamics against the mean behavioural correlation. Single dots, pairs of sessions colour-coded by species. Inset: behavioural correlations for all pairs of trials from different mice and monkeys. Circles, mean.

