Abstract
Difluoromethane (HFC-32; DFM) is compared to acetylene and methyl fluoride as an inhibitor of methanotrophy in cultures and soils. DFM was found to be a reversible inhibitor of CH4 oxidation by Methylococcus capsulatus (Bath). Consumption of CH4 in soil was blocked by additions of low levels of DFM (0.03 kPa), and this inhibition was reversed by DFM removal. Although a small quantity of DFM was consumed during these incubations, its remaining concentration was sufficiently elevated to sustain inhibition. Methanogenesis in anaerobic soil slurries, including acetoclastic methanogenesis, was unaffected by levels of DFM which inhibit methanotrophy. Low levels of DFM (0.03 kPa) also inhibited nitrification and N2O production by soils. DFM is proposed as an improved inhibitor of CH4 oxidation over acetylene and/or methyl fluoride on the basis of its reversibility, its efficacy at low concentrations, its lack of inhibition of methanogenesis, and its low cost.
Methane (CH4) is an atmospheric trace gas which significantly affects the Earth’s radiative balance (15). Methane produced in near-surface, water-saturated environments contributes to the observed increase in the concentration of tropospheric methane which has occurred over the past two centuries (5, 12). Aerobic methane-oxidizing bacteria can diminish the outward methane flux from these environments by consuming as much 90% of the methane initially available for transport (13, 22).
Much has been learned about the role of methanotrophs in controlling methane concentrations through the use of specific inhibitors of methane monooxygenase (1, 21). A common field technique for measuring methane oxidation involves determination of the difference between the flux of CH4 before and after addition of inhibitors to chambers (6, 14, 22). Among the inhibitors employed, acetylene (C2H2) and methyl fluoride (CH3F, MeF) have proven particularly useful because of their high solubilities in water (31) and the ease with which they penetrate to the site of methane oxidation. This latter point eliminates the need for physical disruption of the assayed material, which would be required to ensure effective dispersion of nongaseous inhibitors (6, 21, 22, 28).
To be considered truly “specific,” an inhibitor must not affect any microbes other than those targeted, a situation which in actuality has never been achieved (21). In practice, all “novel” inhibitors have some drawbacks, which eventually become revealed over the course of their continued usage by various investigators. For example, both C2H2 and MeF are used at a level of 1 to 2 kPa to block methanotrophy, but they also can inhibit methanogenesis under certain conditions (8, 9, 10, 14, 16, 23, 25). For field studies, unintended inhibition of methanogenesis could lead to underestimates of the outward CH4 flux. This occurs if the CH4 flux from the zone of methanogenesis to the zone of oxidation is small (14) or if the residence time of CH4 in the oxidation zone is short (16). Rather than determining the source strength of both diffusive and autochthonous CH4 for each study to overcome this situation, it would be easier to identify an inhibitor which does not block methanogenesis when administered at the same concentration at which it blocks methanotrophy.
Difluoromethane (DFM) was previously shown to inhibit methanotrophy by cell suspensions of Methylococcus capsulatus when applied at 1/10 the concentration typically used for MeF (0.1 kPa of DFM [17] versus 1.0 kPa of MeF [6, 22, 23]). We now show that very low levels of DFM (0.03 kPa) inhibit methane oxidation by soil bacteria while higher concentrations (0.1 kPa) were required to inhibit acetoclastic methanogenesis. Hence, DFM should prove a useful tool in the study of CH4 cycling in cases where a close spatial proximity of production and oxidation occur, such as in soils, sediment surfaces, and the rhizosphere associated with aquatic plants.
MATERIALS AND METHODS
Solubility and purity of gases.
Aqueous concentrations of DFM, MeF, and C2H2 were determined by using Bunsen coefficients (α) for each compound in pure water at 25°C applied to the following equation (7):
 |
where A is the aqueous volume, β is the gas volume, and p is the partial pressure in atmospheres. Values of α (in milliliters per milliliter) used were 1.2 for DFM (1a), 1.0 for MeF (8), and 0.9 for C2H2 (2). Concentrations calculated in this way are overestimates of the true aqueous concentrations because no allowance is made for the “salting-out” effect of gases with increased salinity and particle concentration in slurries and cell suspensions. DFM (minimum purity, 99.5%) and MeF (minimum purity, 98%) were obtained from Lancaster Synthesis Inc., Windham, N.H., and CH4 (minimum purity, 99.9%) was obtained from Praxair Inc., Danbury, Conn. Acetylene was generated by reaction of calcium carbide with water. Working standards for CH4 and N2O analyses were obtained from Scott Specialty Gases, Plumsteadville, Pa.
Methanotrophic cultures.
Batch cultures of M. capsulatus (Bath) were grown overnight in mineral salts medium under a methane-air (3:5) atmosphere at 37°C with constant shaking (17, 30). Cell suspensions (20 ml) were dispensed into serum bottles (57 ml) and sealed under air with butyl rubber stoppers. Methane (5.0 kPa) and an inhibitor (DFM, MeF, or C2H2) were added via a syringe after the bottles were sealed. The inhibitors were added at the concentrations indicated in the Results. Inhibition was monitored in one experiment where cell suspensions were incubated (with shaking at 200 rpm in the dark at 37°C) for 45 h and the headspace was sampled for determination of the CH4 concentration. In a separate experiment, cell suspensions were incubated for 4.5 h and, after consumption or inhibition was verified, the stoppers were removed and the samples were allowed to ventilate overnight to eliminate the inhibitors. The bottles were then resealed, and more CH4 was added to the headspace via a syringe. The cell suspensions were incubated (with shaking at 200 rpm in the dark at 30°C) for 28 h, and the headspace gases were sampled for CH4.
Soil incubations. (i) Methanotrophy.
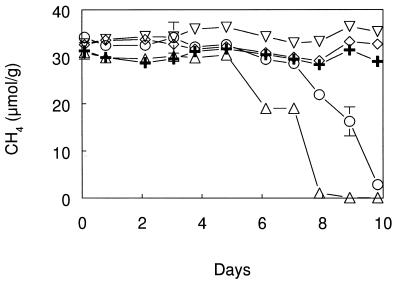
Soil samples from two sites in central California were tested for DFM inhibition of methane oxidation. The upper 2 cm of a seasonally exposed lake bed on the shoreline of Searsville Lake (18, 22, 23) was collected and air dried for 2 days before being sealed in glass jars with screw caps and stored at 4°C for up to 2 months before use. Methanotrophic soils from Sherman Island (23) were stored similarly for up to 2 years at 4°C prior to reconstitution of methane-oxidizing activity in the laboratory. The effect of the added inhibitor (DFM, MeF, or C2H2) on the oxidation of methane was determined on soils (5 g) dispensed into 37- or 57-ml serum bottles and crimp sealed under air with butyl rubber stoppers (gas-phase volumes, ∼33 and ∼53 ml, respectively). After sealing, gases (CH4, DFM, C2H2, and MeF) were injected at the concentrations indicated in Results. All soil samples were incubated without shaking in the dark at ∼21°C, and the headspace was sampled via a syringe for the determination of gaseous hydrocarbons and halocarbons. Killed control soils were autoclaved (121°C at 203 kPa for 1 h). To determine the reversibility of the inhibitory effect of added DFM and to contrast it with that of C2H2 which is not reversible, Sherman Island soils were sealed as above (5-g sample in a 57-ml serum bottle), and CH4 and an inhibitor (DFM or C2H2) were added via a syringe at concentrations indicated in Fig. 4. After 24 h of exposure of the samples to the added gases, the stoppers were removed, the samples were allowed to ventilate overnight, and the bottles were then resealed and more CH4 was added. The samples were incubated as above for 14 days, during which time headspace CH4 was measured.
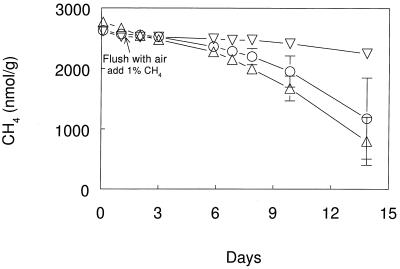
FIG. 4.
DFM inhibition of methane oxidation during aerobic incubation of Sherman Island soil. Symbols: ▵, no additions; ○, 0.001 kPa of DFM added; ▿, 0.01 kPa of DFM added; ◊, 0.1 kPa of DFM added; +, heat killed. Error bars indicate ±1 standard deviation of the mean of three soil samples. The absence of error bars indicates that the error was smaller than the symbol size.
(ii) Nitrification.
The inhibitory effect of DFM and MeF on nitrification and N2O production was studied with samples of Searsville Lake soil (5 g) dispensed in 57-ml serum bottles and wetted with 0.1 ml of 2 M NH4Cl; the bottles were sealed under air. Inhibitors were added via a syringe at the concentrations indicated in Results, and the N2O concentrations were determined by sampling the headspace of the bottles during the incubation. Nitrification, evaluated as soil NH4+ consumed or soil NO3− + NO2− produced, was determined by measuring dissolved inorganic nitrogen extracted from 5 g of soil by using 2 M KCl (20 ml) and overnight shaking followed by centrifugation (12,000 × g for 10 min) and collection of the supernatant. The supernatant was filtered (pore size, 0.4 μm) and stored at 4°C for up to 7 days before being analyzed by colorimetry (11, 26, 29). The detection limit for NH4+ was 100 μM, corresponding to 400 nmol g of soil−1, while the detection limit for NO3− + NO2− was 50 μM, corresponding to 200 nmol g of soil−1.
Anaerobic soil slurry incubations.
The inhibitory effect of added DFM on methanogenesis was examined in slurry experiments with soil collected from two locations at Searsville Lake: the seasonally exposed lake bed described above, and the suboxic zone of the lake. Slurries were prepared by mixing equal parts of soil and phosphate buffer (0.25 g of K2HPO4 per liter, 0.25 g of KH2PO4 per liter [pH = 6.2]) (24) in a blender under flowing N2. Slurries (20 ml) were dispensed into 57-ml serum bottles (headspace volume, 37 ml) with or without added acetate (5 mM), and the bottles were sealed with butyl rubber stoppers and flushed with N2 for 5 min. Some slurries were flushed with H2, and additional H2 was added via a syringe as needed during the incubation of these slurries. Slurries with or without added DFM (0.1 kPa = 35 μM aqueous phase, added after 1 day) were incubated with rotary shaking (200 rpm in the dark at ∼21°C). Headspace gases (DFM and CH4) were sampled over the course of the incubation.
To determine the effect of added inhibitors (DFM and MeF) on acetoclastic methanogenesis, slurries (20 ml in 57 ml serum bottles) were preincubated under N2 for 2 days, during which time they produced CH4. They were then flushed with N2 and injected with [2-14C]acetate (0.05 ml of 24.3 μCi ml−1, 57 μCi μmol−1 [ICN Radiochemicals]). The slurries were incubated (as above) with or without inhibitors for 3 days, during which time headspace gases were sampled via a syringe for determination of 14CH4 and 14CO2.
Analyses.
Hydrocarbons and halocarbons (CH4, C2H2, MeF, and DFM) were quantified by flame ionization gas chromatography (22). Retention times were as follows: CH4, 0.63 min; CH3F, 1.13 min; C2H2, 1.24 min; DFM, 1.33 min. N2O was quantified by 63Ni electron capture detector gas chromatography (18). The carrier (P-5; 5% CH4, balance argon) flow was 30 ml min−1. 14CH4 and 14CO2 produced from added [2-14C]acetate during the methanogenesis experiments was quantified by gas chromatography in series with gas proportional counting (4) after separation on a Porapak S column (2.4 m by 0.16 cm [inside diameter]) (19) at 40°C. The carrier (He) flow was 25 ml min−1.
RESULTS
Methanotrophic cultures.
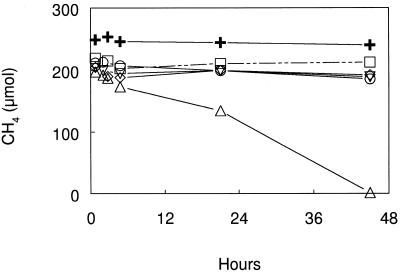
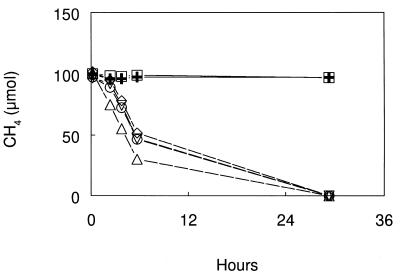
DFM, MeF, and C2H2 added at 1.0 kPa each inhibited the oxidation of CH4 by cell suspensions of M. capsulatus (Fig. 1). DFM added at 0.1 kPa also inhibited methane oxidation. In a separate experiment, DFM inhibition of methane oxidation by cell suspensions of M. capsulatus was shown to be reversible. Methane-oxidizing activity resumed, following removal of the inhibitors, in the uninhibited and in DFM- and MeF-inhibited suspensions but not in the autoclaved or acetylene-inhibited cell suspensions (Fig. 2).
FIG. 1.
Effect of DFM, MeF, and C2H2 on the oxidation of CH4 by cell suspensions of M. capsulatus at 37°C. Symbols: ▵, no additions; ○, 0.1 kPa of DFM added; ▿, 1.0 kPa of DFM added; ◊, 1.0 kPa of MeF added; □, 1.0 kPa of C2H2 added; +, heat killed. Symbols represent the mean of three cultures, and the error was smaller than the symbol size.
FIG. 2.
Recovery of methane oxidation by cell suspensions of M. capsulatus after exposure to inhibitors for 4.5 h and removal of inhibitors at 30°C. Symbols: ▵, no additions; ○, 0.1 kPa of DFM added; ▿, 1.0 kPa of DFM added; ◊, 1.0 kPa of MeF added; □, 1.0 kPa of C2H2 added; + heat killed. Symbols represent the mean of three cultures, and the error was smaller than the symbol size.
Soil incubations. (i) Methanotrophy.
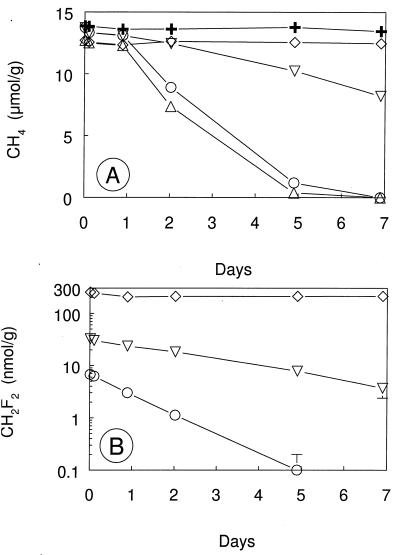
Complete oxidation of 5.0 kPa of CH4 occurred by 7 days in unamended Searsville Lake soil and in soil with 0.001 kPa of added DFM (Fig. 3A). No oxidation of CH4 occurred in autoclaved soil or in soil amended with 0.1 kPa of DFM, while partial oxidation was observed in soil with 0.01 kPa of DFM. During these incubations, the 0.001-kPa DFM was completely consumed, as was 89% of the added 0.01-kPa DFM, whereas there was only a slight (16%) consumption of the 0.1-kPa DFM (Fig. 3B).
FIG. 3.
Consumption of added CH4 (A) and DFM (B) during aerobic incubations of Searsville Lake soil. Symbols: ▵, no additions; ○, 0.001 kPa of DFM added; ▿, 0.01 kPa of DFM added; ◊, 0.1 kPa of DFM added; +, heat killed. Error bars indicate ±1 standard deviation of the mean of three soil samples. Heat-killed control data are from single analyses. The absence of error bars indicates that the error was smaller than the symbol size.
Both 0.03 and 0.05 kPa of DFM completely inhibited oxidation at two CH4 concentrations (5.0 or 0.05 kPa of CH4), and significant inhibition was also achieved with 0.01 kPa of DFM (Table 1). There was little consumption of DFM when it was added at the 0.05-kPa level, although consumption was more evident at the lower applied levels of DFM. In no case, however, was DFM completely removed from the headspaces during the incubation.
TABLE 1.
Inhibition of methane oxidation and consumption of DFM in Searsville Lake soil during 6- to 7-day incubations with two levels of CH4 and various levels of added CH2F2
| Inhibitor added (kPa) | CH4
|
DFM
|
||
|---|---|---|---|---|
| Consumeda (nmol g−1 day−1) | Inhibited (%) | Consumeda (nmol g−1 day−1) | Consumed (%) | |
| 5.0 kPa of CH4 | ||||
| None | 4,261 | 0 | ||
| DFM (0.01) | 286 | 93 | 2.50 | 67 |
| DFM (0.03) | 104 | 98 | 2.30 | 20 |
| DFM (0.05) | 43 | 99 | 1.16 | 6 |
| 0.05 kPa of CH4 | ||||
| None | 11.9 | 0 | ||
| DFM (0.01) | 2.22 | 81 | 0.90 | 28 |
| DFM (0.03) | −0.95b | 100b | 0.50 | 5 |
| DFM (0.05) | 0.09 | 99 | 1.63 | 9 |
a Calculated as (initial concentration − final concentration)/elapsed time; means of three soil samples.
b Slight production occurred during incubation.
DFM inhibited the oxidation of 5% CH4 in Sherman Island soil that had been stored for 2 years. Methane-oxidizing activity was apparent in these soils after several days incubation, and 0.01 and 0.1 kPa of DFM completely inhibited this activity (Fig. 4). Addition of 0.001 kPa of DFM resulted in transient inhibition of methane oxidation. DFM inhibition of CH4 oxidation in stored soils was reversible. After removal of DFM, the methane-oxidizing activity in soils that had been exposed to 0.03 kPa of DFM was similar to the activity in uninhibited soils (Fig. 5). Similar results were observed in soils exposed to 0.05 kPa of DFM for 6 days (data not shown). In contrast, methane oxidation in soils exposed to 1.0 kPa of C2H2 remained inhibited after the C2H2 had been removed.
FIG. 5.
Recovery of CH4 oxidation during aerobic incubations of Sherman Island soil after exposure to inhibitors for 1 day and removal of inhibitors. Symbols: ▵, no additions; ○, 0.03 kPa of DFM; ▿, 1.0 kPa of C2H2. Error bars indicate ±1 standard deviation of the mean of three soil samples. The absence of error bars indicates that the error was smaller than the symbol size.
(ii) Nitrification.
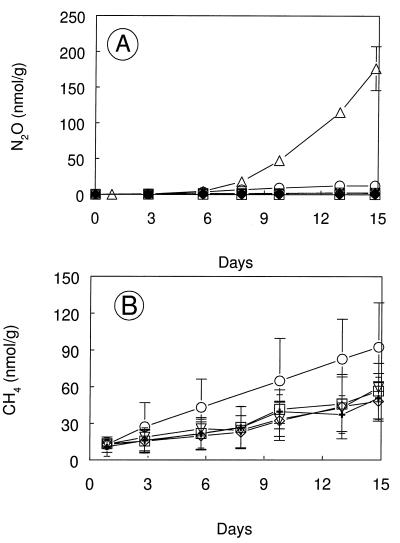
DFM inhibited bacterial nitrification in soils with added NH4Cl (Table 2). Addition of 0.03, 0.05, or 1.0 kPa of DFM or 1.0 kPa of MeF resulted in the inhibition of both ammonium oxidation and production of NO3− + NO2−, while 0.01 kPa of DFM resulted in partial inhibition of nitrification. DFM also inhibited the production of N2O in soils (Fig. 6A). The headspace concentrations of DFM and MeF remained constant during the incubations (data not shown), while a small amount of CH4 was produced (Fig. 6B), presumably within anaerobic microsites in the soil.
TABLE 2.
Inhibition of nitrification in Searsville Lake soil during incubations with various levels of added DFM or MeFa
| Inhibitor added (kPa) | Amt of NH4+ consumedb (μmol g−1) | Amt of NO3− + NO2− producedc (μmol g−1) |
|---|---|---|
| None | 13.1 ± 0.2 | 5.7 ± 0.3 |
| DFM (0.01) | 6.3 ± 0.5 | 1.5 ± 0.2 |
| DFM (0.03) | 2.9 ± 0.1 | 0.3 ± 0.2 |
| DFM (0.05) | 2.8 ± 0.1 | 0.4 ± 0.2 |
| DFM (1.0) | 2.6 ± 0.3 | −0.3 ± 0.2d |
| MeF (2.0) | 2.6 ± 0.7 | −0.3 ± 0.1d |
a 15-day incubations of 5 g of soil with 40 μmol of added NH4Cl g−1.
b Mean ± 1 standard deviation (n = 3), calculated as the amount added minus the amount measured, corrected for soil background (1.5 μmol g−1); the heat-killed control (n = 1) did not consume NH4+.
c Mean ± 1 standard deviation (n = 3), corrected for soil background (1.4 μmol g−1); the heat-killed control (n = 1) did not produce NO3− + NO2−.
d Less NO3− + NO2− recovered than in the soil background.
FIG. 6.
Production of N2O (A) and CH4 (B) during aerobic incubations of Searsville Lake soil with 40 μmol of added NH4Cl g−1. Symbols: ▵, no additions; ○, 0.01 kPa of DFM added; ▿, 0.03 kPa of DFM added; ◊, 0.05 kPa of DFM added; □, 1.0 kPa of DFM added; +, 2.0 kPa of C2H2 added. No CH4 measurements were made for the case of no additions. Error bars indicate ±1 standard deviation of the mean of three soil samples. The absence of error bars indicates that the error was smaller than the symbol size.
Anaerobic soil slurry incubations.
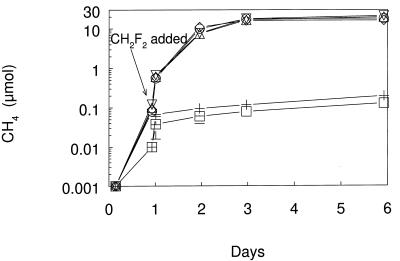
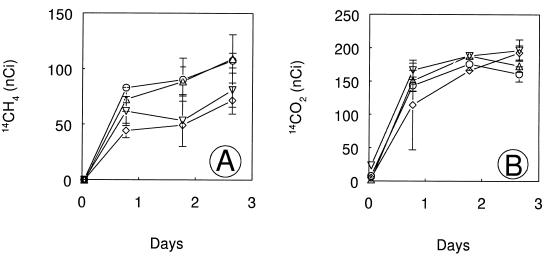
DFM (0.1 kPa) had no effect on the production of CH4 in Searsville Lake soil slurries (Fig. 7). Methanogenesis proceeded at the same rate in the presence or absence of DFM regardless of whether methane was formed from the endogenous substrates present in the soils (N2 atmosphere) or stimulated by provision of acetate or H2. The DFM concentrations remained constant over the incubation (data not shown). However, in a separate experiment, 0.1 kPa of DFM and 0.1 kPa of MeF partially inhibited the production of 14CH4 from tracer levels of [2-14C]acetate whereas there was no inhibition with 0.05 kPa of DFM (Fig. 8A). The final 14CH4 activities were significantly lower (P < 0.05) in slurries with either 0.1 kPa of DFM or 0.1 kPa of MeF than in slurries that were not inhibited. Production of 14CO2 from [2-14C]acetate was not inhibited under any conditions (Fig. 8B). In a contemporaneous experiment with surface sediment from the suboxic zone of the lake (data not shown), production of 14CH4 from [2-14C]acetate was not inhibited by the addition of DFM (0.01 to 0.1 kPa) or MeF (0.1 kPa).
FIG. 7.
Production of CH4 during anaerobic incubations of Searsville Lake soil slurries with or without the addition of 0.1 kPa of DFM (equivalent to 35 μM aqueous concentration). Symbols: □, N2 flushed; +, N2 flushed plus DFM added; ○, 5 mM acetate added; ▿, 5 mM acetate and DFM added; ◊, H2 flushed; ▵, H2 flushed and DFM added. Error bars indicate ±1 standard deviation of the mean of three slurries.
FIG. 8.
Production of 14CH4 (A) and 14CO2 (B) during anaerobic incubations of Searsville Lake soil slurries containing 1,215 nCi of [2-14C]acetate. Symbols: ▵, no additions; ○, 0.05 kPa of DFM added; ▿, 0.1 kPa of DFM added; ◊, 0.1 kPa of MeF added. Error bars indicate ±1 standard deviation of the mean of three slurries. The absence of error bars indicates that the error was smaller than the symbol size.
DISCUSSION
In the first paper evaluating MeF for ecological applications, Oremland and Culbertson (23) examined the conditions which resulted in sustained inhibition of methanotrophy without affecting methanogenesis. Headspace MeF concentrations of 0.4 to 1.7 kPa were recommended for use in incubations where both oxidation and production of CH4 were expected, because inhibition of methanogenesis occurred only at high levels of MeF (8.0 to 11 kPa). However, because salt marsh sediments were used in these anaerobic assays, methane formation from acetate was probably not the dominant pathway of methane production, even though some incubations were conducted without sulfate in order to promote acetoclastic methanogenesis (20, 24). In studies of rice paddy soils, where sulfate reduction is absent, Frenzel and Bosse (8) noted inhibition of acetoclastic methanogenesis with as little as 0.1 kPa MeF, and use of the 1.0 kPa MeF level recommended to block methane oxidation (23) resulted in a substantial inhibition of methane production. King (14) and Lombardi et al. (16) also observed inhibition of methanogenesis during studies with MeF added to block methane oxidation in freshwater sediments. Thus, there are limitations to the efficacy of MeF when it is used to study methane cycling in freshwater sediments.
In our present study, we compared DFM concentrations to the levels of MeF and C2H2 previously recommended to block methanotrophy. DFM added at headspace concentrations of 0.03 or 0.05 kPa inhibited methane oxidation in soils (Table 1). DFM was therefore an effective inhibitor at 30- to 50-fold-lower concentrations than those typically used for MeF (1.0 to 1.7 kPa [6, 8, 23]). This lower effective concentration can offer an advantage because the use of less inhibitor should diminish the possibility of impairing microorganisms which are physiologically different from the target.
Inhibition of methane oxidation by DFM was reversible upon removal of the inhibitor from cell suspensions of M. capsulatus as well as from soils (Fig. 2 and 5). In this way, DFM acts like MeF (17, 23) and functions as an inhibitor of methane monooxygenase. By contrast, C2H2 inhibition of methane oxidation was not relieved upon inhibitor removal in either cell suspensions or soil incubations. Thus, DFM does not act as a “suicide substrate” for methane monooxygenase (27) as do acetylene and the hydrochlorofluorocarbons HCFC-21 and HCFC-22 (17).
We found that a small amount of DFM was consumed during 7-day soil incubations and that the percentage of inhibitor consumed increased with greater methane concentrations and methane oxidation rates. This suggests that it acts as a competitive inhibitor of methane monooxygenase. Furthermore, cooxidation with methane could lead to depletion of DFM during long-term incubations at low levels of inhibitor (<0.03 kPa). Because DFM inhibition of methane oxidation is reversible, depletion of DFM below its effective concentration could result in alleviation of the block. Therefore, care must be taken in selecting an appropriate level of DFM to effectively block methane oxidation and also persist throughout the planned incubation. We recommend a level of 0.03 to 0.05 kPa of DFM for headspace or chamber analyses.
Methanogenesis was unaffected by the addition of 0.1 kPa of DFM (35 μM) during anaerobic incubations of soil slurries with or without electron donor amendments (Fig. 7). At physiologically high concentrations (i.e., in the presence of added electron donor), methanogenesis may not be inhibited because these elevated populations of bacteria probably require higher levels of inhibitor to illicit a response. At physiologically low concentrations (i.e., endogenous conditions), lack of inhibition could indicate that acetoclastic methanogenesis was not the only pathway in these soils or that 0.1 kPa of DFM does not always inhibit acetoclastic methanogenesis. The latter hypothesis is supported by results from the tracer experiments with radiolabeled acetate, where 0.1 kPa of DFM partially inhibited acetoclastic methanogenesis in the seasonally exposed lake bed site (Fig. 8A) but not in surface sediments from the suboxic zone of the lake, suggesting that the response of methanogens to DFM additions was variable.
Thus, DFM, under some conditions, acts like MeF in that it inhibits acetoclastic methanogenesis (8, 10). However, there was no discernible inhibition of acetoclastic methanogenesis under any conditions with 0.05 kPa DFM (17 μM), the concentration which proved effective at inhibiting methane oxidation in soils (Fig. 3A and 4). Frenzel and Bosse (8) found that inhibition of acetoclastic methanogenesis was more sensitive to MeF than was methane oxidation. Our results with DFM suggest that this situation can be reversed and that a suitable concentration of DFM may be used to achieve inhibition of methane oxidation without affecting acetoclastic methanogenesis. In the soil studied here, additions of 0.03 or 0.05 kPa of DFM were judged suitable. Frenzel (8a) recently found suitable levels of DFM that inhibit rice plant-associated methanotrophy without affecting methanogenesis.
DFM inhibited nitrification and N2O production in soil at lower effective concentrations than were observed for MeF (18, 23). N2O production in these ammonium-amended soils most probably resulted from nitrification; however, production from denitrification cannot be ruled out. Because ammonium and methane monooxygenases are similar in function (1), it is not surprising that these enzymes have similar sensitivities to DFM. Unfortunately, DFM offers no promise as a truly selective inhibitor able to distinguish between nitrification-linked and methanotroph-linked processes. The search for this elusive “silver bullet” should continue to occupy the fantasies of methane biogeochemists into the foreseeable future.
In summary, there are several advantages to using DFM over other inhibitors in studies of nitrogen and methane cycling. DFM has a high solubility in water (about 1 ml ml−1 at 20°C), which should facilitate its application in the dissolved phase for experimental designs which lack headspaces (3). DFM, like MeF, is a reversible inhibitor and therefore provides an advantage over C2H2 in studies that require alternating inhibited and uninhibited conditions. We found that DFM does not bind to surfaces as readily as MeF (23) and therefore does not require any unusual contamination prevention strategies. At present, DFM is one-third as costly as MeF; hence, a substantial fiscal savings may be realized in its application. Most importantly, DFM does not inhibit acetoclastic methanogenesis when added at the level required to inhibit CH4 oxidation. Therefore, DFM represents an improved inhibitor for use in studies of CH4 cycling in a variety of aquatic environments, including freshwater, peat, and wetland sediments, where acetoclastic methanogenesis may be a significant pathway.
ACKNOWLEDGMENTS
We thank L. L. Jahnke, NASA, for providing washed cell suspensions of M. capsulatus (Bath) and D. B. Bevins, Dupont, for providing us with solubility data on DFM. The manuscript benefited from reviews by G. M. King, J. P. Chanton, and M. A. Voytek.
This work was supported by NASA Earth Sciences Division Upper Atmosphere Research Program grant 2768 AU 043 and by the USGS.
REFERENCES
- 1.Bédard C, Knowles R. Physiology, biochemistry, and specific inhibitors of CH4, NH4+, and CO oxidation by methanotrophs and nitrifiers. Microbiol Rev. 1989;53:68–84. doi: 10.1128/mr.53.1.68-84.1989. [DOI] [PMC free article] [PubMed] [Google Scholar]
- 1a.Bevins, D. B. Personal communication.
- 2.Braker W, Mossman A L. Matheson gas data book. 6th ed. Lindhurst, N.J: Matheson Co.; 1980. [Google Scholar]
- 3.Caffrey J M, Miller L G. A comparison of two nitrification inhibitors used to measure nitrification rates in estuarine sediments. FEMS Microbiol Ecol. 1995;17:213–220. [Google Scholar]
- 4.Culbertson C W, Zehnder A J B, Oremland R S. Anaerobic oxidation of acetylene by estuarine sediments and enrichment cultures. Appl Environ Microbiol. 1981;41:396–403. doi: 10.1128/aem.41.2.396-403.1981. [DOI] [PMC free article] [PubMed] [Google Scholar]
- 5.Ehhalt D H, Zander R J, Lamontagne R A. On the temporal increase in tropospheric CH4. J Geophys Res. 1983;88:8442–8446. [Google Scholar]
- 6.Epp M A, Chanton J P. Rhizospheric methane oxidation determined via the methyl fluoride inhibition technique. J Geophys Res. 1993;98:18413–18422. [Google Scholar]
- 7.Flett R J, Hamilton R D, Campbell N E R. Aquatic acetylene reduction techniques: solutions to several problems. Can J Microbiol. 1976;22:43–51. doi: 10.1139/m76-006. [DOI] [PubMed] [Google Scholar]
- 8.Frenzel P, Bosse U. Methyl fluoride, an inhibitor of methane oxidation and methane production. FEMS Microbiol Ecol. 1996;21:25–36. [Google Scholar]
- 8a.Frenzel, P. 1998. Personal communication.
- 9.Hyman M R, Arp D J. Acetylene inhibition of metalloenzymes. Anal Biochem. 1988;173:207–220. doi: 10.1016/0003-2697(88)90181-9. [DOI] [PubMed] [Google Scholar]
- 10.Janssen P H, Frenzel P. Inhibition of methanogenesis by methyl fluoride: studies of pure and defined mixed cultures of anaerobic bacteria and archaea. Appl Environ Microbiol. 1997;63:4552–4557. doi: 10.1128/aem.63.11.4552-4557.1997. [DOI] [PMC free article] [PubMed] [Google Scholar]
- 11.Johnson K S, Petty R L. Determination of nitrate and nitrite in seawater by flow injection analysis. Limnol Oceanogr. 1983;28:1260–1266. [Google Scholar]
- 12.Khalil M A K, Rasmussen R A. Sources, sinks, and seasonal cycles of atmospheric methane. J Geophys Res. 1983;88:5131–5144. [Google Scholar]
- 13.King G M. Regulation by light of methane emissions from a wetland. Nature. 1990;345:513–515. [Google Scholar]
- 14.King G M. In situ analyses of methane oxidation associated with the roots and rhizomes of a bur reed, Sparganium eurycarpum, and a Maine wetland. Appl Environ Microbiol. 1996;62:4548–4555. doi: 10.1128/aem.62.12.4548-4555.1996. [DOI] [PMC free article] [PubMed] [Google Scholar]
- 15.Lelieveld J, Crutzen P J, Brühl C. Climate effects of atmospheric methane. Chemosphere. 1993;26:739–768. [Google Scholar]
- 16.Lombardi J E, Epp M E, Chanton J P. Investigation of the methyl fluoride technique for determining rhizospheric methane oxidation. Biogeochemistry. 1997;36:153–172. [Google Scholar]
- 17.Matheson L J, Jahnke L L, Oremland R S. Inhibition of methane oxidation by Methylococcus capsulatus with hydrochlorofluorocarbons and fluorinated methanes. Appl Environ Microbiol. 1997;63:2952–2956. doi: 10.1128/aem.63.7.2952-2956.1997. [DOI] [PMC free article] [PubMed] [Google Scholar]
- 18.Miller L G, Coutlakis M D, Oremland R S, Ward B B. Selective inhibition of ammonium oxidation and nitrification-linked N2O formation by methyl fluoride and dimethyl ether. Appl Environ Microbiol. 1993;59:2457–2464. doi: 10.1128/aem.59.8.2457-2464.1993. [DOI] [PMC free article] [PubMed] [Google Scholar]
- 19.Miller L G, Connell T L, Guidetti J R, Oremland R S. Bacterial oxidation of methyl bromide in fumigated agricultural soils. Appl Environ Microbiol. 1997;63:4346–4354. doi: 10.1128/aem.63.11.4346-4354.1997. [DOI] [PMC free article] [PubMed] [Google Scholar]
- 20.Oremland R S. Biogeochemistry of methanogenic bacteria. In: Zehnder A J B, editor. Biology of anaerobic microorganisms. New York, N.Y: John Wiley & Sons, Inc.; 1988. pp. 405–447. [Google Scholar]
- 21.Oremland R S, Capone D G. Use of “specific inhibitors” in biogeochemistry and microbial ecology. Adv Microb Ecol. 1988;10:285–383. [Google Scholar]
- 22.Oremland R S, Culbertson C W. Importance of methane-oxidizing bacteria in the methane budget as revealed by use of a specific inhibitor. Nature. 1992;356:421–423. [Google Scholar]
- 23.Oremland R S, Culbertson C W. Evaluation of methyl fluoride and dimethyl ether as inhibitors of aerobic methane oxidation. Appl Environ Microbiol. 1992;58:2983–2992. doi: 10.1128/aem.58.9.2983-2992.1992. [DOI] [PMC free article] [PubMed] [Google Scholar]
- 24.Oremland R S, Polcin S. Methanogenesis and sulfate reduction: competitive and noncompetitive substrates in estuarine sediments. Appl Environ Microbiol. 1982;44:1270–1276. doi: 10.1128/aem.44.6.1270-1276.1982. [DOI] [PMC free article] [PubMed] [Google Scholar]
- 25.Oremland R S, Taylor B F. Inhibition of methanogenesis in marine sediments by acetylene and ethylene: validity of the acetylene reduction assay for anaerobic microcosms. Appl Environ Microbiol. 1975;30:707–709. doi: 10.1128/am.30.4.707-709.1975. [DOI] [PMC free article] [PubMed] [Google Scholar]
- 26.Oremland R S, Blum J S, Culbertson C W, Visscher P T, Miller L G, Dowdle P, Strohmaier F E. Isolation, growth, and metabolism of an obligately anaerobic, selenate-respiring bacterium, strain SES-3. Appl Environ Microbiol. 1994;60:3011–3019. doi: 10.1128/aem.60.8.3011-3019.1994. [DOI] [PMC free article] [PubMed] [Google Scholar]
- 27.Prior S D, Dalton H. Acetylene as a suicide substrate and active site probe for methane monooxygenase from Methylococcus capsulatus (Bath) FEMS Microbiol Lett. 1985;29:105–109. [Google Scholar]
- 28.Schipper L A, Reddy K R. Determination of methane oxidation in the rhizosphere of Sagittaria lancifolia using methyl fluoride. Soil Soc Am J. 1996;60:611–616. [Google Scholar]
- 29.Solórzano L. Determination of ammonia in natural waters by the phenolhypochlorite method. Limnol Oceanogr. 1969;14:799–801. [Google Scholar]
- 30.Summons R E, Jahnke L L, Roksandic Z. Carbon isotopic fractionation in lipids from methanotrophic bacteria: relavence for interpretation of the geochemical record of biomarkers. Geochim Cosmochim Acta. 1994;58:2853–2863. doi: 10.1016/0016-7037(94)90119-8. [DOI] [PubMed] [Google Scholar]
- 31.Wilhelm E, Battino R, Willcock R J. Low-pressure solubility of gases in liquid water. Chem Rev. 1977;77:219–262. [Google Scholar]


