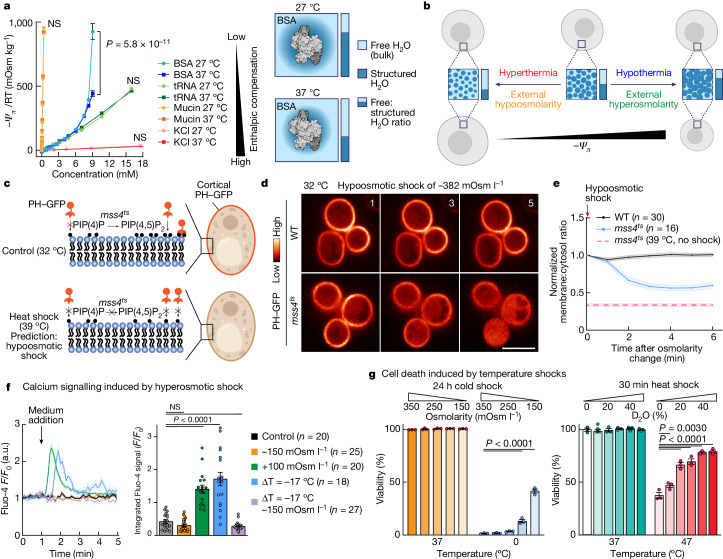
Fig. 1. The duality of thermal and osmotic perturbation on water potential and cellular function.
a, Vapour-pressure osmometry measurements for the indicated solute concentrations and temperatures (left). Data are mean ± s.e.m. n = 3. BSA exerts a nonlinear effect on solvent thermodynamics that is accentuated at 27 °C compared with at 37 °C, whereas other macromolecules exhibit temperature-independent quasi-linear relationships, indicating that this is not a crowding effect (Extended Data Fig. 1). Right, instead, we propose that structured water increases as the temperature decreases. Statistical analysis was performed using two-way analysis of variance (ANOVA). b, The model for duality of osmotic and thermal perturbations on free:structured water in cells (Supplementary Video 3). c–e, Hypoosmotic shock phenocopies heat shock for thermosensitive yeast mutants. c, Using WT mss4 and thermosensitive mss4ts strains of S. cerevisiae expressing PIP(4,5)P2 GFP probe (PH–GFP) to monitor mss4 PIP(4) kinase activity, we found that the cortical GFP signal decreased when cells shifted from permissive (32 °C) to restrictive (39 °C) temperatures (Extended Data Fig. 2). We predicted that hypoosmotic shock at 32 °C would mimic 39 °C heat shock. d, The PH–GFP signal after hypoosmotic shock was monitored using spinning-disk confocal microscopy (SDCM; single confocal planes). Scale bar, 5 µm. e, The normalized cortical to cytosol ratio of the PH–GFP signal. Data are mean ± s.e.m. As predicted, thermosensitive mss4ts mutants lose the cortical PH–GFP signal after hypoosmotic shock but the WT strains do not, excluding indirect effects on PH–GFP signal or PIP2 levels through membrane tension or PIP(4,5)P2 phosphatases. f, The interaction between osmolarity and temperature on calcium signalling in primary chondrocytes (Fluo-4 F/F0 signal). Data are mean ± s.e.m. n values indicate the number of fields of view analysed. See also Extended Data Fig. 3. Statistical analysis was performed using one-way ANOVA followed by Dunnett’s test; P values are indicated. g, Manipulating water thermodynamics rescued Raji cell viability after cold or heat shock. Data are mean ± s.e.m. n = 3. Hypoosmotic conditions increased survival at 0 °C. Similarly, D2O increased survival after extreme heat shock as increased H-bonding network strength preserves the hydration layer size. Statistical analysis was performed using two-way ANOVA with Dunnett’s post hoc test; P values are indicated.

