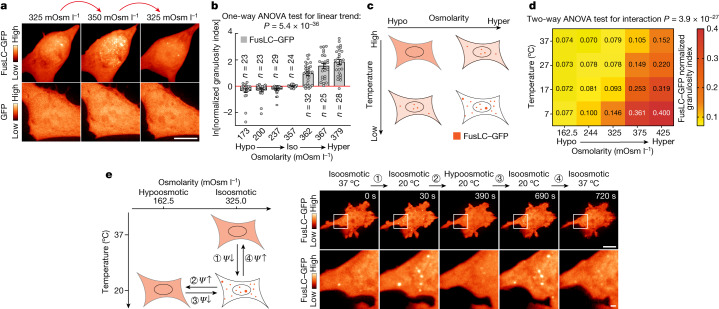
Fig. 3. Duality of thermal and osmotic perturbation on FusLC condensation in cells.
a, Representative maximum-intensity z-projections of SH-SY5Y cells transiently expressing GFP or FusLC–GFP, subjected to the indicated mild osmotic challenge, imaged using SDCM within 1 min of perturbation. Note that there is no condensation of GFP alone, and condensation of FusLC–GFP is reversible. Quantification is shown in Extended Data Fig. 8a,b. b, The change in the granulosity index for FusLC–GFP in U2OS cell nuclei after osmotic challenge (details of the deep-learning-based segmentation method are provided in the Methods). Data are normalized to granulosity per cell before challenge. Statistical analysis was performed using one-way ANOVA with test for linear trend; the P value is shown. c, Prediction if the change in external osmolarity affects FusLC–GFP condensation through changes in Ψπ, rather than directly: both low temperature and high osmolarity should induce condensation of FusLC–GFP in cells, but also compensate for each other. d, SH-SY5Y cells transiently expressing FusLC–GFP were changed to medium of the indicated osmolarity and imaged using SDCM. The temperature was then quickly shifted to lower values using microfluidics (Methods) while imaging. The FusLC–GFP condensation state was then automatically measured and plotted as a function of temperature and external osmolarity (mean granulosity index). Statistical analysis was performed using two-way ANOVA to test the interaction between temperature and osmolarity; P < 0.0001. n = 10–42 cells analysed per condition. e, The principle of the experiment (left). A single SH-SY5Y cell transiently expressing FusLC–GFP was moved along the temperature/osmolarity phase transition curve using dual-layer microfluidic chips (Methods), which permit the rapid change of temperature and/or the osmolarity of the medium while keeping the cell in focus on the microscope. Right, images of a representative experiment as described for the left panel (maximum-intensity z-projections using SDCM). High-magnification images of the area indicated by a white square are shown at the bottom. The elapsed time is indicated in seconds. For a and e, scale bars, 10 µm (a and e (top)) and 1 µm (e (bottom)).

