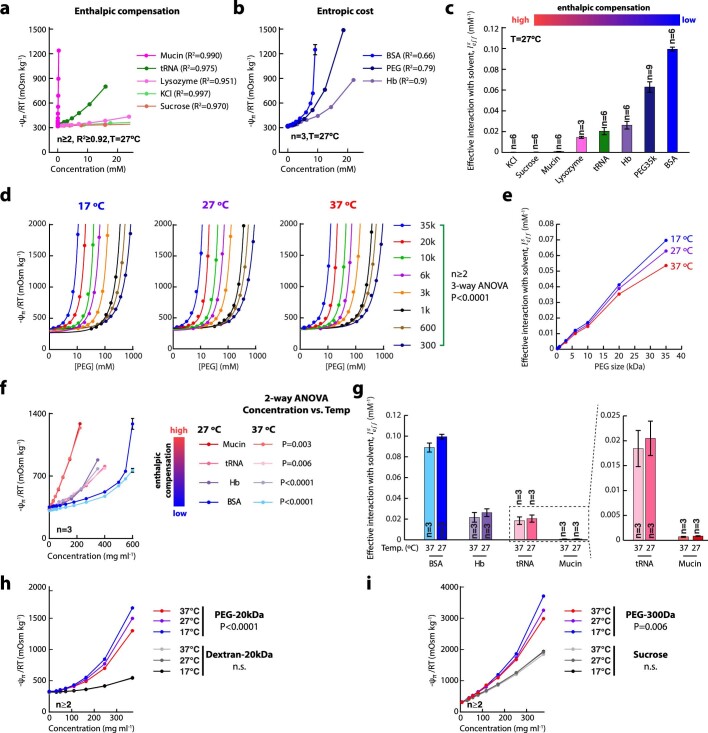
Extended Data Fig. 1. Osmotic potential of simple and macromolecular solutes as a function of concentration and temperature.
(a-b) The osmotic potential (mean ± SEM) of indicated macromolecules at various concentrations was determined at 27 °C by the vapour pressure method, data corresponds to Fig. 1a. Charged or hydrophilic small solutes, as well as macromolecules with predominantly hydrophilic surfaces, partake in enthalpically-compensated interactions with the solvent such that osmotic potential increases linearly with concentration. Conversely, the osmotic potential of macromolecules (BSA, PEG, Hb) with less enthalpically-favourable solvent interactions show a marked departure from linearity as concentration increases. Goodness-of-fit for a centred first order polynomial is shown. (c) A single parameter describing each solute’s effective departure from linearity (that is, its effective interaction with the solvent , displayed with 95% confidence interval as error bars) can be derived by fitting the data to Equation 1, as proposed by Fullerton and colleagues11,13; see methods for details. The higher the , the more uncompensated or energetically unfavourable “structured” water is generated per unit mass of solute, and the less linear the osmometry curve is with respect to concentration. n: number of osmometry curves fitted simultaneously to evaluate in each condition (see supplementary discussion). (d) PEG models the effect of less enthalpically-favoured biological macromolecules with high on solvent thermodynamics, since it has no solubility limit and does not partition from the solvent. The osmotic potential of PEG changes as a function of concentration, molecular weight, and temperature, with a highly significant three-way interaction between the three variables. (e) values from the data presented in (d) illustrates how solvent thermodynamics become increasingly sensitive to temperature drop as increases (that is for larger PEG size). (f) As predicted by PEG, the temperature sensitivity of a less enthalpically-favoured macromolecule’s effect on solvent thermodynamics is greater for macromolecules with higher . For example, for solutions of mucin and BSA with osmotic potential >1000 mOsm kg−1 at 27 °C degrees, a 10 °C increase in temperature halves the osmotic potential of the BSA solution but has minimal effect on the osmotic potential of mucin solution. Statistics indicated. (g) values (±95% confidence interval) from the data presented in (f) illustrates how the temperature- sensitivity of a less enthalpically-favoured macromolecule’s effect on solvent thermodynamics is greater for those with higher . n: number of osmometry curves measured at each temperature to evaluate . (h,i) The concentration and temperature-dependent effect of macromolecules such as PEG on solvent thermodynamics is not attributable to macromolecular crowding or excluded volume effects, since identical concentrations of more enthalpically favourable but similarly-sized carbohydrates (h: PEG-20kDa versus dextran-20kDa; i: PEG-300Da versus Sucrose 349 Da) have more modest effects on osmotic potential that are not sensitive to temperature over this range. Two-way ANOVA for temperature versus concentration statistics are indicated. Throughout n: number of independent repeats. Please note that absolute osmotic potential is shown here, which includes 320 mOsm kg−1 due to the buffer used throughout (20 mM Tris-HCl pH 7.4/150 mM KCl). Whereas, for clarity, baseline-subtracted vapour pressure measurements are presented in main figures.

