

Abstract

Ultrasonic pretreatment of gel composition followed by hydrothermal synthesis produces the nanocrystallite zeolite beta (ZB) with crystal sizes of 10.3, 22.6, and 9.1 nm for ZB-1, ZB-2, and ZB-3, respectively. The effect of ultrasonic pretreatment and the (SiO2/Al2O3) ratio of gel composition on physical, textural properties, and also on the catalytic activity of ZB catalysts with increasing time on stream (TOS) was investigated. The specific surface area and mesopore volume for ZB-1, ZB-2, and ZB-3 are 438, 380, and 429 m2/g and 0.17, 0.05, and 0.14 cm3/g, respectively. The activity studies of ZB-1 and ZB-3 catalysts were confirmed that the anisole conversion initially increased with TOS until it attained the maximum value and then started decreasing further with TOS due to the deactivation of the catalyst caused by the strong interaction of the product with the acidic sites in the mesopore region. However, in the case of ZB-2, the anisole conversion (>45%) was sustained for a longer TOS due to its smaller particle size, low mesopore volume, and more acidic sites in the micropore volume that are inclusively made for retardation in the catlytic deactivation rate. The CHNS and TGA analysis of the spent catalysts confirm that ZB-1 and ZB-3 catalysts are susceptible for a significant coke formation attributed due to strong product retention in their large mesopore volume, which lead to the catalytic deactivation.
1. Introduction
Friedel–Crafts reaction is one of the most promising synthetic tools for the successful incorporation of acyl and alkyl moieties over the benzene ring to produce aromatic ketones and alkyl derivatives of aromatic compounds.1−4 Aromatic ketones/acetophenones are the pivotal intermediates for the production of fine chemicals, drugs, agrochemicals, fragrances, and pharmaceutical industries.5 Conventionally, homogeneous Lewis acids such as AlCl3, BF3, and FeCl3 were used as catalysts to foster the rate of reaction to produce aromatic ketones using activated carboxylic acids (acid chlorides and acid anhydrides) as acylating agents. Acylation of anisole reaction over metal halides possess several demerits such as stoichiometrically excess requirement of catalyst, batch process, formation of corrosive products, environmental adulteration, non-reusable hazardous catalyst, and generation of a large amount of waste during the neutralization and hydrolysis step. The production of 4-methoxyacetophenone (4-MAP) in the batch process causes an escalation in process economics and imposes technical complications during the separation of products from the catalyst. So, it is a prerequisite to develop an efficient and environmentally benign green catalytic process in continuous mode to attenuate the critical drawbacks triggered in the conventional approach.
Heterogeneous solid acid catalysts were identified as eco-friendly and promising catalysts for Friedel–Crafts acylation reactions because of their tailorable acidity, pore topology, tunable textural properties, high thermal stability, trouble-free handling, easy separation from reaction media, a lower amount of catalyst requirement, and reusability for multiple times after regeneration. Various three-dimensional solid acid catalysts such as mesoporous silica,6−8 heteropolyacids,9,10 H-MFI,11 H-FAU,12 H-BEA,13−15 and H-MOR1,2 have been extensively examined for catalytic activity studies on acylation of anisole under various ranges of process parameters in the batch reactor. Among the solid acid catalysts mentioned above, zeolite beta (BEA) is considered as a prominent catalyst for the acylation of anisole because of its divertive strong acidity originating from a structural framework constituted by two polymorphs and interconnecting channels with a high concentration of structural defects,16−18 which provides a higher level of anisole conversion, and also its pore topology oriented toward the regioselective formation of 4-MAP.19−25 Synthesis of organic compounds over solid acid catalysts often suffers from rapid catalytic deactivation because of their strong interaction with oxygenated products, dealumination, and trapping of heavier molecular weight products in micropores/mesopores or on the intercrystalline surfaces because of their diffusion limitation.1,2,5,26−29 A deactivated catalyst always needs to undergo catalyst regeneration, which triggers an increase in the process economics and yield loss and imposes technical complexities.
The present investigation aims to study the effect of crystallite size and (Si/Al)global ratio of synthesized BEA on the catalyst properties, activity, and stability in continuous mode. The changes in the properties of the spent catalysts were thoroughly characterized by using standard analytical techniques to understand the reasons for catalytic deactivation.
2. Experimental Section
Fumed silica (>99.5%), tetraethyl ammonium hydroxide (TEAOH, 25 wt % in water), sodium aluminate (37–45 wt % Na2O, 53–56 wt % Al2O3), sodium hydroxide (>99%), sodium chloride (>99%), ammonium chloride (>99.5%), dichloromethane (DCM >99.8%), potassium chloride (>99%), anisole (>99.9%) purchased from Sigma Aldrich and acetic anhydride (>98%) obtained from s.d. Fine Chem. Ltd. were directly used without any further purification.
2.1. Catalyst Synthesis
BEA samples with three different Si/Al ratios 15, 30, and 60 were synthesized according to the gel composition of 0.0394 Na2O:0.02 K2O:0.5 TEAOH:1.0 SiO2:(0.002–0.025) Al2O3:15 H2O are named as ZB-1, ZB-2, and ZB-3 (ZB = zeolite beta), respectively. The resultant gel composition was obtained by sequential mixing of the ingredients followed by ultrasonication for 10 min and then was loaded in a PTFE-lined autoclave; crystallization was carried out in a convective oven at 140 °C for 48 h. The product was recovered by quenching the autoclave immediately in a cold water bath, and the resultant wet powder was centrifuged with deionized water to reduce the pH to <9. The obtained powder was dried at 120 °C overnight and then calcined at 550 °C for 6 h to remove the organic template completely. Na-ZB was converted into NH4+ form by refluxing it in 1 M ammonium chloride solution at 100 °C for 2 h and then calcined at 500 °C for 6 h to obtain H-ZB.
2.2. Characterization
Crystallographic analysis of synthesized catalysts were carried out using Rigaku Ultima-IV X-ray Diffractometer (XRD) in a scan range of 2–80° with a scan speed of 2°/min at 40 kV and 20 mA to identify the crystalline phases. The average crystallite size was evaluated from the characteristic peaks using the Debye-Scherrer formula without subtracting the baseline and the percentage of crystallinity obtained from the ratio of total crystalline peaks area and total area. Nitrogen (N2) adsorption and desorption studies were carried out using an Autosorb 1 (Quantachrome) sorption analyzer to determine the specific surface area, total pore volume, and pore size distribution of the samples at −196 °C. Prior to the analysis, the three samples were preheated in N2 at 200 °C for 2 h. Solid-state 27Al MAS NMR was carried out using a triple resonance HXY 4.0 mm ZrO2 probe in a Bruker 400 MHz advance impulse spectrometer. Ammonia temperature-programmed desorption (NH3-TPD) of H-ZB catalysts was carried out using a Micrometrics Autochem-II 2920 instrument. Before the analysis, a known amount of calcined H-ZB catalysts was degassed in pure He gas with a flow rate of 50 mL/min at 600 °C for 30 min and then allowed to cool naturally up to 90 °C. Adsorption of samples was carried out with NH3 (10 vol %) as a probe molecule in He with a flow rate of 30 mL/min for 1 h and subsequently flushed with pure He for 30 min to remove the excess residual ammonia from the catalyst surface. Desorption of ammonia was carried out in pure He by increasing the sample temperature from 90 to 550 °C with a ramp rate of 10 °C/min, and the desorbed ammonia was recorded using a thermal conductivity detector. Fourier transform infrared (FTIR) spectroscopy analysis was performed on Perkin-Elmer FTIR spectrometer to determine the functional groups present in the sample in a wavenumber range of 4000–400 cm–1 using the conventional KBr pellet. The chemical composition of catalyst samples was measured using an OCEAN PUMA 7600D X-ray fluorescence (XRF) spectrometer. The sample’s average particle size, surface morphology, and surface chemical composition were determined using a JEOL JSM-7610F Field Emission Scanning Electron Microscope (FE-SEM) equipped with Energy Dispersive X-Ray (EDX) spectroscopy. Elemental analysis of spent catalyst samples was carried out using a Vario Micro Cube CHNS analyzer to estimate the amount of coke accumulated in the catalyst pore during the reaction. Thermal stability studies of the catalyst samples were carried out using a NETZSCH 449F3 Thermogravimetric Analyzer (TGA) in an air environment from RT to 800 °C with a heating rate of 10 °C/min with an airflow rate of 50 mL/min.
2.3. Catalyst Activity and Spent Catalyst Studies
Synthesized ZB catalysts were pelletized using polyvinyl alcohol (PVA) as an organic binder with a die size 6 × 3 mm (d × t), and the resultant tablets were cut into small pellets having an average diameter of 0.5 mm. Acetyl functionalization of anisole was carried out using acetic anhydride as an acylating agent over the synthesized ZB catalysts (calcined prior to loading in the reactor to remove PVA) in a down-flow fixed bed reactor maintained at 100 °C. The molar ratio of anisole to acetic anhydride was 2:1, the WHSV was 1.8 h–1, and the feed flow rate was 3.6 mL/h. Once the reactor was adjusted to the test temperature, feedstock was introduced into the reactor with the desired flow rate, and the products were periodically collected and analyzed using a Shimadzu Gas Chromatograph equipped with an MS detector (GC-MS) connected with an Optima-5-MS column having dimensions 60 × 0.25 × 0.25 (L × D × t) in m × mm × μm. The activity, selectivity, and stability of the three catalysts were compared over TOS. After completion of the reaction, the reactor was purged with N2 gas at a flow rate of 100 mL/min for 2 h at 100 °C to remove the residual feedstock over the catalyst bed. The catalyst was unloaded from the reactor and dried at 120 °C for 12 h in a convective oven. The spent catalyst was thoroughly characterized by XRD, FTIR, XRF, CHNS, and TGA to understand the deactivation of ZB catalysts. One gram of spent catalyst was immersed in 50 mL of DCM taken in an RB flask equipped with a spiral coil-type condenser to extract the retained compounds present in the catalyst pores at 100 °C for 12 h, and the extracted compounds in the solvent were analyzed by using GC–MS.
3. Results and Discussion
The ZB-1, ZB-2, and ZB-3 catalysts with increasing (Si/Al)global ratio were obtained by increasing in SiO2/Al2O3 molar ratio in the gel composition. The (Si/Al)global ratio and the quantity (in g/100 g of gel) of powder obtained (yield) after calcination with the change in SiO2/Al2O3 molar ratio in the gel composition are depicted in Figure 1.
Figure 1.

Effect of gel SiO2/Al2O3 molar ratio on Si/Al ratio and the quantity of ZB catalysts.
The crystal growth rate, number of crystals produced per unit mass of gel, efficiency of silica incorporation into the framework, and resultant ZB powder (g) yield per 100 g of the gel are decreased with an increase in SiO2/Al2O3 molar ratio in the gel composition,30 as shown in Figure 1. The (Si/Al)global ratios of the resultant powder were obtained by metal analysis using XRF and EDX ( Table 1).
Table 1. The (Si/Al)global Ratios and Relative Crystallinities (%) of ZB-1, ZB-2, and ZB-3.
| code | relative crystallinitya | average crystal sizea (nm) | Si/Al wt ratiob | Si/Al wt ratioc |
|---|---|---|---|---|
| ZB-1 | 98.9 | 10.31 | 14.7 | 19.8 |
| ZB-2 | 83.4 | 22.62 | 32.0 | 37.9 |
| ZB-3 | 100 | 9.09 | 40.3 | 52.1 |
XRD.
EDX.
XRF.
3.1. Powder X-ray Diffraction Analysis
The powder X-ray diffraction patterns of the resultant solid product obtained from the gel composition after hydrothermal treatment with different Si/Al ratios are depicted in Figure 2. The synthesized ZB samples show the Bragg’s diffraction patterns at 2θ = 7.9 and 22.6 were well coordinated with the BEA characteristic peaks, which also indicate that ZB-1, ZB-2, and ZB-3 possess a high degree of crystallinity without any phase impurities. However, the change in the alumina precursor concentration has impact on the intensities of Bragg’s reflections that appeared at 2θ = 7.9 and 22.6 were different due to the formation of sub-colloid (<10 nm) and colloidal (10 nm) particles.31 The broad peak at 2θ = 7.9 indicates the presence of two polymorphs with smaller crystal sizes and relatively sharp reflections at 2θ = 22.6 that are associated with the highly ordered BEA crystal orientation with larger crystal sizes.
Figure 2.
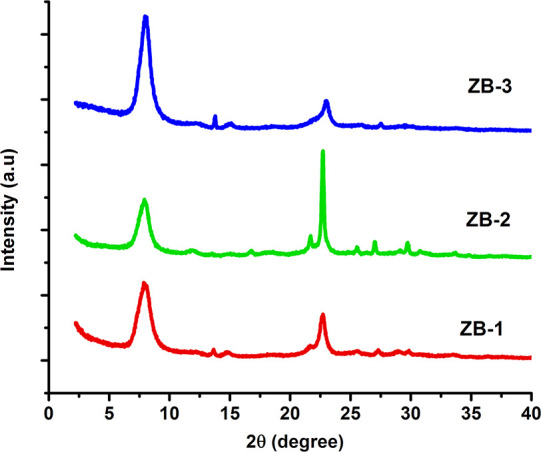
Powder XRD patterns of ZB-1, ZB-2, and ZB-3.
Ultrasonication of the gel composition generates a localized high temperature and high-pressure sonic waves, which causes the breaking down of the complex precursors of silica and alumina to very fine fragments, leading to enhanced nucleation rate, which results in an efficient and rapid decrease in the crystal size.32,33 The average crystal size of the three catalysts is evaluated from the characteristic diffraction peaks using the Debye-Scherrer formula, and the values are 10.3, 22.6, and 9.1 nm (Table 1) for ZB-1, ZB-2, and ZB-3, respectively. The sharp and high intense reflection at 2θ = 22.6 due to a rapid increase in the crystallite size of ZB-2 compared to ZB-1 and ZB-3. The percentage of relative crystallinity was estimated from the area under the diffraction peaks, and the values are 98.9, 83.4, and 100% for ZB-1, ZB-2, and ZB-3, respectively, indicating that an increase in the average crystal size results in the reduction of the percentage of crystallinity in the case of ZB-2.
3.2. Textural Property Analysis
The textural properties of ZB-1, ZB-2, and ZB-3 samples that were evaluated using N2 adsorption–desorption isotherms are displayed in Figure 3. All three samples exhibited type-IV isotherm possessing intrinsic mesoporous nature along with a hysteresis loop. The specific surface area is obtained using the BET method when the relative pressure P/P0 < 0.3, and the values are 438, 380, and 429 m2/g for ZB-1, ZB-2, and ZB-3, respectively. The specific surface area of the ZB-2 catalyst is lower due to the formation of large-sized crystals (confirmed through XRD) during the hydrothermal synthesis. The external surface area was estimated by a t-plot method, the total pore volume was evaluated at a relative pressure P/P0 = 0.995. The BJH method was used to estimate the mesopore volume and average pore size from the desorption curve, and the data is summarized in Table 2.
Figure 3.

(a) N2 Adsorption–desorption isotherms and (b) pore size distribution of ZB-1, ZB-2, and ZB-3.
Table 2. Textural Properties of ZB-1, ZB-2, and ZB-3.
| surface area (m2/g) | pore volume (cm3/g) | |||||
|---|---|---|---|---|---|---|
| code | total (BET) | externala | micropore | mesoporeb | total | mean pore diab (nm) |
| ZB-1 | 438 | 115 | 0.17 | 0.18 | 0.35 | 3.2 |
| ZB-2 | 380 | 102 | 0.14 | 0.05 | 0.20 | 2.07 |
| ZB-3 | 429 | 142 | 0.17 | 0.14 | 0.30 | 2.82 |
t-plot method.
BJH method.
A sudden uptake in the N2 adsorbed volume was observed (Figure 3a) when the relative pressure P/P0 > 0.8, indicating the existence of larger mesoporous intercrystallites in the case of ZB-1 and ZB-3. High fraction of mesopore volume and large mean pore diameter were observed in ZB-1 and ZB-3 catalysts, which are attributed to the formation of interparticle voids and large mesoporous intercrystallites generated from the disordered agglomeration of nanoscale crystals during the crystallization step.34,35 In the case of the ZB-2 sample, the decrease in the mesopore volume and mean pore diameter indicates that formation of small range of mesopore intercrystallites during the hydrothermal synthesis.36
3.3. 27Al MAS NMR Analysis
Solid-state 27Al MAS NMR was used to determine the aluminium local environment of the synthesized ZB catalysts. As shown in Figure 4, it is revealed that all synthesized catalysts possessed strong centered resonance approximately at 54 ppm corresponding to the incorporation of Al in the framework (FAL) in tetrahedral coordination. The Brønsted acidity in ZB catalysts originated from charge compensating protons generated by partial substitution of Al in the Si framework showing the tetrahedral coordination. The FAL concentration was evaluated by integrating the intensity of the broad peak at δ = 54 ppm, and the intensity decreases with an increase in the Si/Al ratio.
Figure 4.

27Al MAS NMR spectra of ZB-1, ZB-2, and ZB-3.
The Al tetrahedral peak positions were 54.7, 55.3, and 55.7 ppm for ZB-1, ZB-2, and ZB-3, which are slightly shifted toward the left from a central position. This might be due to a small distortion that occurred in the framework during the synthesis because of the change in the SiO2/Al2O3 molar ratio of the gel composition or smaller particles possessing high surface energy that produces greater strain in the lattice, which causes the peak broadening. The small signal at the chemical shift at 0 ppm corresponds to the octahedral coordination of Al generated either from non-framework aluminium or during the calcination of the process by converting the Brønsted acidic sites (BAS) into Lewis acidic sites (LAS). Octahedral aluminum is assigned as the extra framework Al (EFAL) present in the pore channels. The concentration of both FAL and EFAL decreases with increasing the Si/Al ratio due to decrease in the alumina precursor concentration in the gel composition.37,38
3.4. Temperature-Programmed Desorption Studies
The NH3-TPD profiles of ZB-1, ZB-2, and ZB-3 are displayed in Figure 5, and all three catalysts that possess three distinct desorption temperatures are assigned as to weak, medium, and strong acidic sites. The NH3 desorption peaks located in the temperature region of 50–200 °C, 200–350 °C, and 350–500 °C correspond to the weak, moderate, and strong acid sites, respectively. Weak acidic sites resulted from the non-framework alumina or strong adsorption of NH3 to the terminal silanol group, while the medium and strong acidic sites originated from the bridging Si-OH-Al group when Al atom replaces the Si atom from the framework.
Figure 5.

NH3-TPD curves for ZB-1, ZB-2, and ZB-3.
The acidic strength and acidic site concentration for all three catalysts are summarized in Table 3. The peak temperature for ZB-1, ZB-3, and ZB-3 are 344, 311, and 295 for medium acidic sites and 428, 416, and 422 °C for strong acidic sites, respectively. From NH3-TPD analysis, it is revealed that the total acidity decreases with increasing the Si/Al ratio due to decreasing the concentration of Al in both framework and non-framework.
Table 3. Acidity and Acidic Strength of ZB-1, ZB-2, and ZB-3.
| acidic
strength (°C) |
acidic
site concentration (μmol/g) |
||||||
|---|---|---|---|---|---|---|---|
| code | weak | medium | strong | weak | medium | strong | total acidity |
| ZB-1 | 344 | 428 | 9.2 | 149 | 181.4 | 339.6 | |
| ZB-2 | 176 | 311 | 416 | 7.5 | 81.8 | 124.3 | 213.7 |
| ZB-3 | 198 | 295 | 422 | 25.7 | 81.7 | 54.5 | 161.9 |
3.5. FTIR Analysis
The FTIR spectra of H-ZB with different Si/Al ratios are depicted in Figure 6. The broad band at 3300–3700 cm–1 attributed to the presence of bridged Si-O(H)-Al or strong BAS and the terminal Si-OH group attached to the strongest hydrogen bond having strong internal structural defects. In addition, IR band at 1640 cm-1 corresponds to adsorbed water hydroxyl group H-O-H bending vibrations. A large and broad band that appears at 1030–1200 cm–1 represents the assymetric stretching vibrations of Si-O-Si-Al group, which is sensitive to the framework Si/Al ratio. The IR band that appeared at 900–1000 cm–1 belongs to the terminal Si-OH group on the external surface of the crystallites. The band at a wavenumber range of 750–820 cm–1 is attributed to the O-T-O symmetric stretching vibrations, and the wavenumber position is shifted to the right with a decrease in the Al content in the framework. The band at wavenumber 525–580 cm–1 indicates the presence of the five and six membered T-O-T rings structure as the characteristic peak of crystalline ZB catalyst.
Figure 6.

FTIR spectra of ZB-1, ZB-2, and ZB-3.
3.6. Morphology Studies
The surface morphology and average particle size were examined using FE-SEM, and (Si/Al)global ratios were determined from EDX analysis, both are shown in Figure 7.
Figure 7.

(a) FE-SEM images of the surface morphology, (b, c) particle size distribution, and (d) EDX plots for ZB-1, ZB-2, and ZB-3.
The surface morphology of ZB samples exhibited well-defined spherical at all Si/Al ratios with different average particle sizes. A lower crystallization temperature favors the nucleation rate compared to crystal growth, leading to a smaller size of crystals. The average particle size was obtained from Image J software after careful image thresholding and normalizing. The average particle size of ZB-1, ZB-2, and ZB-3 are 850, 101.5, and 345.3 nm, respectively. The average particle size entirely depends on the framework SiO2/TEAOH and SiO2/Al2O3 ratio and the extent of Al incorporated into the framework from the gel during the hydrothermal crystallization. EDX analysis was used to obtain the elemental composition (Table 4), and the Si/Al ratio values were calculated from EDX are 14.8, 32, and 40.3, respectively, for ZB-1, ZB-2, and ZB-3. The amount of alumina incorporated into the framework decreases with increasing the SiO2/Al2O3 molar ratio of gel composition, as also confirmed through XRF analysis.
Table 4. Elemental Composition in wt % from EDX for ZB-1, ZB-2, and ZB-3.
| code | Si (%) | Al (%) | O (%) | K (%) |
|---|---|---|---|---|
| ZB-1 | 48.8 | 3.3 | 47.8 | 0.1 |
| ZB-2 | 44.8 | 1.4 | 53.8 | ND |
| ZB-3 | 44.4 | 1.1 | 54.5 | ND |
3.7. Catalyst Activity Studies
The catalytic activity studies as a function of time for ZB catalysts are shown in Figure 8. Three catalysts exhibited extremely high anisole conversion (>45%) with enhanced selectivity (>98%) toward the desired product (4-MAP) without the formation of any multi-acylated anisole that was confirmed by GC–MS. In the case of the ZB-1 catalyst, maximum conversion was attained within 1 h due to possessing more number of acidic sites. On the other hand, the ZB-2 and ZB-3 catalysts had achieved maximum conversion after 4 h on stream, which signifies the role of acidic site concentration, and these observations are consistent with NH3-TPD results. Interestingly, all three catalysts were showing high catalytic activity, indicating that even a moderate number of acidic sites are sufficient for attaining the maximum conversion over the strong catalyst surface. The ZB catalysts are extremely regioselective (>98%) toward the facile formation of 4-MAP, and the extent of formation of other side products such as ortho and meta-isomers is much lower due to the catalyst pore topology and pore connectivity.2 To minimize the deactivation in micropore volume, the feed molar ratio of 2:1 has been chosen to enhance the catalyst stability by using excess anisole that can act as a self-solvent and mitigate the probability of the formation of higher acylated products. Catalytic activity has been rapidly decreased with increasing TOS in the case of ZB-1 and ZB-3 due to the leaching of aluminum from the catalyst surface by acetic acid, (formed in the reaction) and also the strong retention of the product in the intercrystallite and mesopore region of ZB catalysts due to having higher equilibrium adsorption constant of 4-MAP compared to feedstock molecules.28,39 The access of active sites to the fresh feedstock molecules is hindered by retention of product in the catalyst pore due to strong interaction of 4-MAP with BAS causes catalytic deactivation. The retention of 4-MAP in the intercrystallite and mesopore volume is very high compared to that in micropore volume.28 In the case of ZB-2, the deactivation rate is relatively very low due to possessing a smaller particle size and medium acidic strength, and most of the acidic sites responsible for the reaction are in the micropore volume and lower mesopore volume inclusively makes the ZB-2 catalyst relatively stable among three catalysts.
Figure 8.

The catalytic activity studies as function of time (a) Anisole conversion and (b) 4-MAP selectivity for ZB catalysts.
3.8. Spent Catalyst Studies
The powder X-ray diffraction patterns of the spent catalysts were compared with those of the fresh catalysts (Figure 9). The diffraction patterns of the spent catalysts are well-matched with those of the fresh catalysts, indicating that no structural deformation occurred during the reaction. In the case of spent catalysts, the intensity of the diffraction peaks was decreased in comparison to the fresh catalysts, probably due to the leaching of alumina either from the framework or extra framework. In addition, the relative crystallinity was reduced compared to fresh catalysts (Table 5), which is due to the retention of 4-MAP in the catalyst pores.
Figure 9.

The powder XRD patterns of fresh and spent catalysts.
Table 5. Change in Si/Al Ratios and Relative Crystallinities of Spent Catalysts.
| code | Si/Al wt ratio | relative crystallinity (%) |
|---|---|---|
| ZB-1 | 30.5 | 89.98 |
| ZB-2 | 58.3 | 81.82 |
| ZB-3 | 62.3 | 100 |
The (Si/Al)global ratio of spent catalysts increases by 1.2 to 2 times, confirming the leaching of extra framework alumina and possibly a little extent of alumina from framework by acetic acid formed during the reaction. The extent of dealumination has been decreased from 2 to 1.2 times with increasing the Si/Al ratio from ZB-1 to ZB-3, indicating that catalysts with high Si/Al ratio are relatively stable compared to lower ratios due to decreasing the concentration of alumina in the both framework and extra framework.
In order to determine the amount of coke retained in the catalyst pore during the reaction, the ZB spent catalysts have been subjected to CHNS analysis. The amount of coke retained in the catalyst surface during the reaction were 22.62, 14.96, and 12.88 wt %, respectively, for ZB-1, ZB-2, and ZB-3. Even though the ZB-2 catalyst consists of ∼15 wt % coke in its pore volume, most of the acidic sites responsible for the reaction are situated in the micropore volume that makes this catalyst sustainable for longer TOS. TGA analysis of spent catalysts was carried out in an air atmosphere from RT to 800 °C (Figure 10). Rapid weight loss has been observed for the three catalysts in the temperature range of 150–500 °C, indicating the oxidization of coke present in the catalyst pore to CO2 in the air atmosphere. The amount of coke retained in the catalyst pore was estimated from the weight loss obtained from RT to 700 °C were 27.36, 22.53, and 14.7 wt % for ZB-1, ZB-2, and ZB-3, respectively.
Figure 10.

TGA curves of spent catalysts.
Extraction of the retained compounds from the spent catalysts was carried out in an RB flask connected with a condenser using DCM as a solvent at 100 °C for 12 h. Prior to the solvent extraction, the spent catalyst was dried at 120 °C to remove the feedstock molecules from the surface of the catalysts. The GC–MS analysis of extracted solvent has indicated that no multi-acylated anisole compounds are formed during the reaction and the analyte contains only 4-MAP. It is confirmed that catalytic deactivation is mainly due to the retention of 4-MAP in the catalyst pore, and the coke content that confirms from both CHNS and TGA analysis is purely from 4-MAP. The CHNS analysis data of the spent catalysts before and after solvent extraction is shown in Table 6. The coke content is not observed in the case of ZB-1 and ZB-2 spent catalysts after solvent extraction indicates that solvent could extract the product completely from the catalyst pores. However, the solvent cannot extract the complete coke content from the ZB-3 spent catalyst that might be due to the retention of coke in the micropore volume and also strong interaction of 4-MAP with the BAS in the mesopore region of the catalyst.
Table 6. CHNS Data Analysis of Spent Catalysts before and after Solvent Reflux.
| before
solvent reflux (wt %) |
after
solvent reflux (wt %) |
|||||||
|---|---|---|---|---|---|---|---|---|
| code | C (%) | H (%) | N (%) | S (%) | C (%) | H (%) | N (%) | S (%) |
| ZB-1 | 22.62 | 4.85 | ND | 0.14 | ND | 3.57 | ND | ND |
| ZB-2 | 14.96 | 1.78 | ND | 0.2 | 0.01 | 2.75 | ND | 0.02 |
| ZB-3 | 12.88 | 1.48 | ND | 0.05 | 5.29 | 1.55 | ND | 0.04 |
The FTIR spectra of spent catalysts have shown the band centered at 2850 and 2930 cm–1 attributed to the stretching vibrations of the methyl group and asymmetrical stretching vibrations of the CH2 group, respectively (Figure 11), confirming the presence of coke.
Figure 11.

FTIR spectra of spent catalysts.
The IR band at 550–600 cm–1 corresponds to the five-membered T-O-T ring of crystalline BEA pore topology, indicating that its crystalline nature remains intact even after the reaction, and the observations are well matched with the aforementioned XRD analysis. The band at wavenumbers around 3460 cm–1 corresponds to the presence of bridging hydroxyl group, and the intensity of peak is relatively lower compared to fresh catalysts.
4. Conclusions
Nanocrystallite sized (10–30 nm) ZB-1, ZB-2, and ZB-3 catalysts with three different Si/Al ratios have been synthesized by a sonication-assisted hydrothermal method. The catalytic activity and stability of the synthesized catalysts were tested for Friedel–Crafts acylation of anisole with acetic anhydride as an acylating agent in a continuous down-flow fixed bed reactor. The active sites of ZB-1, ZB-2, and ZB-3 catalysts are readily accessible for the feedstock molecules that initially lead to very high anisole conversion (>45%) and higher product selectivity (>98%) toward 4-MAP. It was observed that with increasing TOS ZB-1 and ZB-3 catalysts, it started deactivating due to strong retention of 4-MAP in the mesopore volume and leaching of aluminum from the catalyst surface during the reaction. Hence, it was concluded that among three catalysts, ZB-2 catalyst showed superior catalytic stability throughout the reaction time due to its smaller particles size, low mesopore volume, and having more number of active sites responsible for the reaction that were situated in the micropore volume. A thorough investigation of spent catalysts revealed that the structure of BEA remains intact even after carrying out the reaction. The CHNS and TGA analysis of spent catalysts indicate that both ZB-1 and ZB-3 catalysts are highly susceptible for coke formation. The solvent extraction of spent catalysts was confirmed that the deactivation was mainly due to retention of product in the catalyst pores.
Author’s Contributions
G.N.: Development of methodology, material synthesis and characterization, catalytic activity studies and data interpretation, preparation of manuscript, and editing. B.M.K.: FTIR, XRF, BET, and TPD analysis and catalytic activity studies. K.K: SEM analysis and activity studies, B.S.: modification of methodology and supervision, P.R.L.: project administration, supervision, review and editing, P.S.: conceptualization and modification of methodology, supervision, and manuscript review.
Acknowledgments
We thank the Director, CSIR-IICT for the support (IICT/Pubs./2022/166). Author G.N. is thankful to CSIR for the fellowship.
Author Present Address
∥ Present addressAQ2: Please confirm if it is correct to capture this data as present address.: Academy of Scientific and Innovative Research (AcSIR), Ghaziabad 201002, India (G.N., B.M.K., K.K., and P.S.)
The authors declare no competing financial interest.
References
- Makihara M.; Aoki H.; Komura K. Reaction Profiles of High Silica MOR Zeolite Catalyzed Friedel–Crafts Acylation of Anisole Using Acetic Anhydride in Acetic Acid. Catal. Lett. 2018, 148, 2974–2979. 10.1007/s10562-018-2530-1. [DOI] [Google Scholar]
- Makihara M.; Komura K. A Novel Friedel-Crafts Acylation Reaction of Anisole for Production of 4-Methoxyacetophenone with High Selectivity and Sufficient Reusability of Mordenite Zeolite Catalyst. Green Sustainable Chem. 2017, 07, 185–192. 10.4236/gsc.2017.73014. [DOI] [Google Scholar]
- Gutiérrez-Rubio S.; Shamzhy M.; Čejka J.; Serrano D. P.; Moreno I.; Coronado J. M. Vapor Phase Acylation of Guaiacol with Acetic Acid over Micro, Nano and Hierarchical MFI and BEA Zeolites. Appl. Catal., B 2021, 285, 119826 10.1016/j.apcatb.2020.119826. [DOI] [Google Scholar]
- Frouri F.; Célérier S.; Ayrault P.; Richard F. Inorganic Hydroxide Fluorides as Solid Catalysts for Acylation of 2-Methylfuran by Acetic Anhydride. Appl. Catal., B 2015, 168-169, 515–523. 10.1016/j.apcatb.2015.01.020. [DOI] [Google Scholar]
- Zhao D.; Wang J.; Zhang J. Effects of Modified Beta Zeolites with Acid on Anisole Acetylation in a Fixed Bed Reactor. Catal. Lett. 2008, 126, 188–192. 10.1007/s10562-008-9605-3. [DOI] [Google Scholar]
- Parsharamulu T.; Venkanna D.; Lakshmi Kantam M.; Bhargava S. K.; Srinivasu P. The First Example of Ortho-Arylation of Benzamides over Pd/Mesoporous Silica: A Novel Approach for Direct Sp2 C-H Bond Activation. Ind. Eng. Chem. Res. 2014, 53, 20075–20084. 10.1021/ie503576d. [DOI] [Google Scholar]
- Raveendranath Reddy K.; Venkanna D.; Lakshmi Kantam M.; Bhargava S. K.; Srinivasu P. SnO2-SiO2 Mesoporous Composite: A Very Active Catalyst for Regioselective Synthesis of Aromatic Ketones with Unusual Catalytic Behavior. Ind. Eng. Chem. Res. 2015, 54, 7005–7013. 10.1021/acs.iecr.5b00910. [DOI] [Google Scholar]
- Barla M. K.; Velagala R. R.; Minpoor S.; Madduluri V. R.; Srinivasu P. Biomass Derived Efficient Conversion of Levulinic Acid for Sustainable Production of γ-Valerolactone over Cobalt Based Catalyst. J. Hazard. Mater. 2021, 405, 123335 10.1016/j.jhazmat.2020.123335. [DOI] [PubMed] [Google Scholar]
- Bachiller-Baeza B.; Anderson J. A. FTIR and Reaction Studies of the Acylation of Anisole with Acetic Anhydride over Supported HPA Catalysts. J. Catal. 2004, 228, 225–233. 10.1016/j.jcat.2004.08.010. [DOI] [Google Scholar]
- Cardoso L. A. M.; Alves W. Jr.; Gonzaga A. R. E.; Aguiar L. M. G.; Andrade H. M. C. Friedel-Crafts Acylation of Anisole with Acetic Anhydride over Silica-Supported Heteropolyphosphotungstic Acid (HPW/SiO2). J. Mol. Catal. A: Chem. 2004, 209, 189–197. 10.1016/j.molcata.2003.08.022. [DOI] [Google Scholar]
- Selvin R.; Hsu H. L.; Her T. M. Acylation of Anisole with Acetic Anhydride Using ZSM-5 Catalysts: Effect of ZSM-5 Particle Size in the Nanoscale Range. Catal. Commun. 2008, 10, 169–172. 10.1016/j.catcom.2008.08.013. [DOI] [Google Scholar]
- Moreau P.; Finiels A.; Meric P. Acetylation of Dimethoxybenzenes with Acetic Anhydride in the Presence of Acidic Zeolites. J. Mol. Catal. A: Chem. 2000, 154, 185–192. 10.1016/S1381-1169(99)00373-8. [DOI] [Google Scholar]
- Winé G.; Pham-Huu C.; Ledoux M. J. Acylation of Anisole by Acetic Anhydride Catalysed by BETA Zeolite Supported on Pre-Shaped Silicon Carbide. Catal. Commun. 2006, 7, 768–772. 10.1016/j.catcom.2006.03.002. [DOI] [Google Scholar]
- Simon-Masseron A.; Marques J. P.; Lopes J. M.; Ribeiro F. R.; Gener I.; Guisnet M. Influence of the Si/Al Ratio and Crystal Size on the Acidity and Activity of HBEA Zeolites. Appl. Catal., A 2007, 316, 75–82. 10.1016/j.apcata.2006.09.022. [DOI] [Google Scholar]
- Ji X.; Qin Z.; Dong M.; Wang G.; Dou T.; Wang J. Friedel-Crafts Acylation of Anisole and Toluene with Acetic Anhydride over Nano-Sized Beta Zeolites. Catal. Lett. 2007, 117, 171–176. 10.1007/s10562-007-9131-8. [DOI] [Google Scholar]
- Jansen J. C.; Creyghton E. J.; Njo S. L.; Van Koningsveld H.; Van Bekkum H. On the Remarkable Behaviour of Zeolite Beta in Acid Catalysis. Catal. Today 1997, 38, 205–212. 10.1016/S0920-5861(97)00070-9. [DOI] [Google Scholar]
- Marques J. P.; Gener I.; Ayrault P.; Lopes J. M.; Ramôa Ribeiro F.; Guisnet M. Semi-Quantitative Estimation by IR of Framework, Extraframework and Defect A1 Species of HBEA Zeolites. Chem. Commun. 2004, 20, 2290–2291. 10.1039/b409964h. [DOI] [PubMed] [Google Scholar]
- Marques J. P.; Gener I.; Ayrault P.; Bordado J. C.; Lopes J. M.; Ribeiro F. R.; Guisnet M. Dealumination of HBEA Zeolite by Steaming and Acid Leaching: Distribution of the Various Aluminic Species and Identification of the Hydroxyl Groups. C. R. Chim. 2005, 8, 399–410. 10.1016/j.crci.2005.01.002. [DOI] [Google Scholar]
- Beers A. E. W.; Hoek I.; Nijhuis T. A.; Downing R. S.; Kapteijn F.; Moulijn J. A. Structured Catalysts for the Acylation of Aromatics. Top. Catal. 2000, 13, 275–280. 10.1023/A:1009053410163. [DOI] [Google Scholar]
- Čejka J.; Prokešová P.; Červený L.; Mikulcová K. The Effect of Zeolite Pore Size and Channel Dimensionality on the Selective Acylation of Naphthalene with Acetic Anhydride. Stud. Surf. Sci. Catal. 2002, 2, 627–634. 10.1016/S0167-2991(02)80082-9. [DOI] [Google Scholar]
- Bai G. Y.; Dou H. Y.; Qiu M. D.; He F.; Fan X. X.; Ma Z. Friedel–Crafts Acylation of Anisole over Cr-Doped Hβ Zeolite. Res. Chem. Intermed. 2010, 36, 483–490. 10.1007/s11164-010-0158-x. [DOI] [Google Scholar]
- Winé G.; Vanhaecke E.; Ivanova S.; Ziessel R.; Pham-huu C. Microwave Heating Effects on Acylation of Anisole, Catalyzed by BEA Zeolite Supported on β-SiC. Catal. Commun. 2009, 10, 477–480. 10.1016/j.catcom.2008.10.014. [DOI] [Google Scholar]
- Derouane E. G.; Schmidt I.; Lachas H.; Christensen C. J. H. Improved Performance of Nano-Size H-BEA Zeolite Catalysts for the Friedel–Crafts Acetylation of Anisole by Acetic Anhydride. Catal. Lett. 2004, 95, 13–17. 10.1023/B:CATL.0000023715.41857.56. [DOI] [Google Scholar]
- Wagholikar S. G.; Niphadkar P. S.; Mayadevi S.; Sivasanker S. Acylation of Anisole with Long-Chain Carboxylic Acids over Wide Pore Zeolites. Appl. Catal., A 2007, 317, 250–257. 10.1016/j.apcata.2006.10.023. [DOI] [Google Scholar]
- Jayat F.; Picot M. J. S.; Rohan D.; Guisnet M. Acylation of Aromatics over a HBEA Zeolite . Effect of Solvent and of Acylating Agent. Stud. Surf. Sci. Catal. 1997, 91–98. 10.1016/S0167-2991(97)80892-0. [DOI] [Google Scholar]
- Ji X.; Qin Z.; Wang G.; Dong M.; Hou X.; Wang J. Critical Temperatures and Pressures of the Reacting Mixture in the Acylation of Anisole with Acetic Anhydride. J. Chem. Eng. Data 2006, 1156–1160. 10.1021/je060072r. [DOI] [Google Scholar]
- Sarsani V. R.; Lyon C. J.; Hutchenson K. W.; Harmer M. A.; Subramaniam B. Continuous Acylation of Anisole by Acetic Anhydride in Mesoporous Solid Acid Catalysts: Reaction Media Effects on Catalyst Deactivation. J. Catal. 2007, 245, 184–190. 10.1016/j.jcat.2006.10.001. [DOI] [Google Scholar]
- Rohan D.; Canaff C.; Fromentin E.; Guisnet M. Acetylation of Anisole by Acetic Anhydride over a HBEA Zeolite - Origin of Deactivation of the Catalyst. J. Catal. 1998, 177, 296–305. 10.1006/jcat.1998.2108. [DOI] [Google Scholar]
- Guidotti M.; Canaff C.; Coustard J.-M.; Magnoux P.; Guisnet M. Acetylation of Aromatic Compounds over H-BEA Zeolite: The Influence of the Substituents on the Reactivity and on the Catalyst Stability. J. Catal. 2005, 230, 375–383. 10.1016/j.jcat.2004.12.021. [DOI] [Google Scholar]
- Camblor M. A.; Mifsud A.; Pérez-Pariente J. Influence of the Synthesis Conditions on the Crystallization of Zeolite Beta. Zeolites 1991, 11, 792–797. 10.1016/S0144-2449(05)80057-0. [DOI] [Google Scholar]
- Mintova S.; Valtchev V.; Onfroy T.; Marichal C.; Knözinger H.; Bein T. Variation of the Si/Al Ratio in Nanosized Zeolite Beta Crystals. Microporous Mesoporous Mater. 2006, 90, 237–245. 10.1016/j.micromeso.2005.11.026. [DOI] [Google Scholar]
- Mendoza H. R.; Jordens J.; Pereira M. V. L.; Lutz C.; Van Gerven T. Effects of Ultrasonic Irradiation on Crystallization Kinetics, Morphological and Structural Properties of Zeolite FAU. Ultrason. Sonochem. 2020, 64, 105010 10.1016/j.ultsonch.2020.105010. [DOI] [PubMed] [Google Scholar]
- Kornas A.; Olszówka J. E.; Urbanova M.; Brabec L.; Rathousky J.; Dedecek J.; Pashkova V. Ultrasonic Pretreatment as a Tool for the Preparation of Low-Defect Zeolite Mordenite. ACS Omega 2021, 6, 2340–2345. 10.1021/acsomega.0c05655. [DOI] [PMC free article] [PubMed] [Google Scholar]
- Zhang J.; Cao P.; Yan H.; Wu Z.; Dou T. Synthesis of Hierarchical Zeolite Beta with Low Organic Template Content via the Steam-Assisted Conversion Method. Chem. Eng. J. 2016, 291, 82–93. 10.1016/j.cej.2016.01.088. [DOI] [Google Scholar]
- Tian F.; Wu Y.; Shen Q.; Li X.; Chen Y.; Meng C. Effect of Si/Al Ratio on Mesopore Formation for Zeolite Beta via NaOH Treatment and the Catalytic Performance in α-Pinene Isomerization and Benzoylation of Naphthalene. Microporous Mesoporous Mater. 2013, 173, 129–138. 10.1016/j.micromeso.2013.02.021. [DOI] [Google Scholar]
- Bok T. O.; Onuchin E. D.; Zabil’skaya A. V.; Konnov S. V.; Knyazeva E. E.; Panov A. V.; Kleimenov A. V.; Ivanova I. I. Nanocrystalline Zeolites Beta: Features of Synthesis and Properties. Pet. Chem. 2016, 56, 1160–1167. 10.1134/S0965544116120021. [DOI] [Google Scholar]
- Petushkov A.; Merilis G.; Larsen S. C. Microporous and Mesoporous Materials From Nanoparticles to Hierarchical Structures : Controlling the Morphology of Zeolite Beta. Microporous Mesoporous Mater. 2011, 143, 97–103. 10.1016/j.micromeso.2011.02.012. [DOI] [Google Scholar]
- Wang Z.; Wang L.; Zhou Z.; Zhang Y.; Li H.; Stampfl C.; Liang C.; Huang J. Benzylation of Arenes with Benzyl Chloride over H-Beta Zeolite: Effects from Acidity and Shape- Selectivity. J. Phys. Chem. C 2017, 121, 15248–15255. 10.1021/acs.jpcc.7b04335. [DOI] [Google Scholar]
- Derouane E. G.; Dillon C. J.; Bethell D.; Derouane-Abd Hamid S. B. Zeolite Catalysts as Solid Solvents in Fine Chemicals Synthesis: 1. Catalyst Deactivation in the Friedel-Crafts Acetylation of Anisole. J. Catal. 1999, 187, 209–218. 10.1006/jcat.1999.2575. [DOI] [Google Scholar]