Abstract
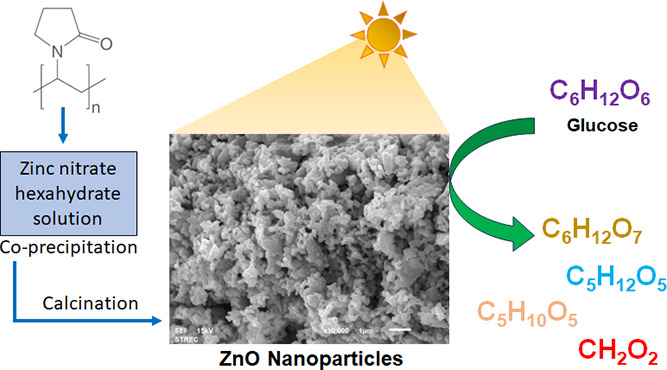
Biomass conversions to chemicals via various conventional technologies require high energy consumption, high temperature, high pressure, or high system cost. Alternatively, photocatalysis is one of the greener technologies because it utilizes the energy from lamps or natural sunlight with catalysts to synthesize chemicals under mild conditions and room temperature. In this work, zinc oxide (ZnO) particles were successfully synthesized using polyvinylpyrrolidone as an additive in coprecipitation to control the size and protect the aggregation. The crystal structure of hexagonal wurtzite was found in the obtained nanoparticles. The photocatalytic activities of the obtained samples were evaluated for the production of high-value chemicals (gluconic acid, xylitol, arabinose, and formic acid) via the photocatalytic conversion of glucose under UV-A irradiation. The photocatalytic results indicated the relationship of defects (i.e., oxygen vacancies and zinc vacancies) with glucose conversions. From the ZnO nanoparticles calcined at various temperatures from 400 to 700 °C, the one calcined at 700 °C showed the highest glucose conversion of 21.5% with a high yield of carboxylic acid products (gluconic acid and formic acid). The gluconic acid showed the highest yield of 15% for 180 min, while the formic acid, arabinose, and xylitol presented the highest yields of 7, 1, and 0.5% for 180 min, respectively. Pure ZnO nanoparticles can convert glucose into value-added products without adding an acid or base in the reaction.
Introduction
Nowadays, it is well known that zinc oxide (ZnO) is one of the vital semiconductor materials with a wide bandgap of 3.37 eV at room temperature.1 This bandgap can be excited using short-wavelength emissions such as UV radiation, high excitonic binding energy around 60 MeV, and a short luminescence lifetime.1 ZnO can be used in many applications, such as gas sensors,2 optical luminescence,3 transparent conductive coatings,4 and electrodes for dye-sensitized solar cells.5 Moreover, it is one of the most widely used photocatalysts due to its high catalytic efficiency, low cost, environmental sustainability, and human body-friendly material.6,7 ZnO can be synthesized by various techniques, such as sol–gel,8 chemical vapor deposition,9 a hydrothermal method,10 a glycothermal method,11 and precipitation.12 Each method of the synthesis process can directly affect the properties of one material, such as structures including particle size, crystal structure, morphology, and surface defects.13
Among the various fabrication methods, precipitation is very attractive for commercial development. The continuous process with an easy up-scaling potential from the laboratory experiments can be expected without loss in product quality.14 During the precipitation process, the use of polymeric additives to carry out coprecipitation achieves the control of the precipitate with respect to its chemical composition, shape, and size.14−16 Various nanoparticles are relatively aggregated due to their large surface area and high surface energy. Therefore, the grain size must be reduced, and the dispersion must be enhanced to suit the applications, especially in catalysis and photovoltaics. Polyvinylpyrrolidone (PVP) can be used in polymer-assisted coprecipitation as a surfactant to reduce the size and aggregation.16 Moreover, the addition of PVP may create some defects in ZnO that can benefit some optoelectronic applications.
Recently, photocatalysis has been challenged in the green synthesis of chemicals via biomass conversions using metal oxides in the photocatalytic process. Biomass conversion has attracted much attention as one of the promising technologies to produce renewable chemicals and energy in the future. Generally, biomass can be converted into chemicals via various conventional technologies such as fast pyrolysis, steam gasification, and supercritical conversion. However, they have limitations, including the requirement of high energy consumption, high temperature, high pressure, or high system cost. There are also many steps to produce chemicals using conventional processes. Photocatalysis is one of the greener technologies because it utilizes energy from lamps or natural sunlight with catalysts to synthesize chemicals under mild conditions and room temperature. This information has been added to the revised manuscript to clarify the points to the readers.17
Glucose is one of the monosaccharides found in the structure of plant biomass. It is transformed into various forms of high-value chemicals, such as gluconic acid, glucaric acid, arabinitol, 5-hydroxymethylfurfural, ethanol, H2, etc.18 The photocatalytic glucose conversions using semiconductor photocatalysts have also been gradually developed in the past decade. H2 and small-molecule gas productions via photocatalytic glucose oxidation got high attention.19−21 The study of the products from the photocatalytic conversion of glucose in the liquid phase was later developed and reported.17,18,22−24 Titanium dioxide (TiO2) is the main photocatalyst that has been frequently studied because it presents excellent photocatalytic activity, chemical stability, strong oxidizing ability, nontoxicity, long durability, and transparency to visible light.18 Some new photocatalysts for the conversion of glucose are Bi5O7Br,25 Bi2WO6,20 CuO,26 and Zn1–xCdxS27 with various modifications or complex synthesis systems. ZnO-based photocatalysts have been attractive because they have bandgaps and several properties similar to TiO2. Anyway, ZnO can also express better photocatalytic performance since the electron mobility of ZnO is 2 orders of magnitude higher than that of TiO2 contributing to high quantum efficiency.
There is still not much work that uses ZnO-based photocatalysts for glucose conversion. In the literature, the composite ZnO/cobalt tetra(2,3-bis(butylthio)maleonitrile)porphyrazine (CoPzS8) photocatalyst was found to be employed for photocatalytic glucose conversion under simulated sunlight irradiation. The result showed that the ZnO/CoPzS8 presented a high photocatalytic activity for glucose conversion in pure water without additional acid or base.28 In this contribution, pristine ZnO nanoparticles without complex modification were successfully prepared by simple coprecipitation using PVP as an additive for size reduction, aggregation reduction, and the creation of some unique defects in ZnO that can benefit photocatalytic applications. The effects of calcination conditions on the morphological appearance, crystal structure, and surface defects of the resulting ZnO were investigated. The photocatalytic activities of ZnO nanoparticles without adding acid or base in the reaction were first analyzed based on the photooxidation reaction of conversion of glucose to high-value products.
Experimental Section
Materials
Zinc nitrate hexahydrate (Sigma-Aldrich, Milwaukee, WI), polyvinylpyrrolidone (PVP) (Mw ≈ 1,300,000, Sigma-Aldrich), acetic acid 99.9% (Fluka, Steinheim, Germany), and ethanol 99.9% (QRCTM) were used to prepare ZnO nanoparticles. All chemicals were analytical grade and used as-purchased without further purification.
Synthesis of ZnO Nanoparticles
In a typical synthesis procedure, ZnO nanoparticles were synthesized from the method modified from ref (12). Zinc nitrate hexahydrate (9 g) was added to mixed ethanol (45 mL) and acetic acid (18 mL). The solution was stirred at room temperature for 15 min before adding PVP (1 g), and the mixture was continuously stirred for 60 min. The mixture solution was dried in an oven at 100 °C overnight. The obtained ZnO powder was calcined for 2 h in various temperatures at 400, 500, 600, 700, and 800 °C (called ZnO-400 to ZnO-800 °C, respectively).
Characterizations of Catalysts
The morphological appearance of synthesized ZnO was characterized by scanning electron microscopy (SEM, JEOL JSM 5800). X-ray diffraction (XRD, Siemens D5000) with Cu Kα radiation was used to analyze the crystalline structure of ZnO. Thermogravimetric/differential thermal analysis (TG/DTA, PerkinElmer Diamond) was conducted to measure differential weight related to the thermal property. The Brunauer–Emmett–Teller method (BET) was used to estimate the surface area by N2 adsorption (Micromeritics ChemiSorb 2750). The obtained N2 adsorption–desorption isotherms were used to calculate the total pores and pore diameters using the Barrett–Joyner–Halenda (BJH) method.23 Photoluminescence (PL, PerkinElmer LS 55) with 300 nm excitation was performed to study the charge recombination of electron–hole pairs. Fourier transform infrared spectroscopy (FT-IR, Nicolet Impact 400) was used to identify the chemical functions of the synthesized materials. X-ray photoelectron spectroscopy (XPS, Kratos Analytical AMICUS, operated using Mg Kα X-rays) was carried out to investigate the chemical states and structures of photocatalysts.
Photocatalytic Reaction
The photocatalytic activities of synthesized ZnO were measured by converting glucose under UV-A irradiation to generate value-added chemicals. The glucose solution (100 mL, 30 mg/L) and ZnO photocatalyst (0.05 g) were mixed and transferred to a photocatalytic reactor. The solution was stirred for 30 min under dark conditions to complete a homogeneous suspension and complete adsorption of glucose on the ZnO surfaces to ensure that the results of glucose conversion are based on only photocatalysis. After that, photocatalysis was done by stimulation with light from 15 W UV-A light (Philips TLD15W/05, wavelength ≈365 nm, six lamps) under continuous stirring. The solution was sampled every 30 min for 2 h. Glucose conversion and chemical product yields were examined by high-performance liquid chromatography (HPLC, Shimadzu, LC-20AD) equipped with a refractive index detector (Shimadzu RID-10A). Separation was performed via an Aminex HPX-87H column (300 × 7.8 mm) at 65 °C using 5 mM sulfuric acid as the mobile phase. Glucose conversion and product yield were investigated according to the methods described in refs (17) and (23).
Results and Discussion
Physical Properties of ZnO Nanoparticles
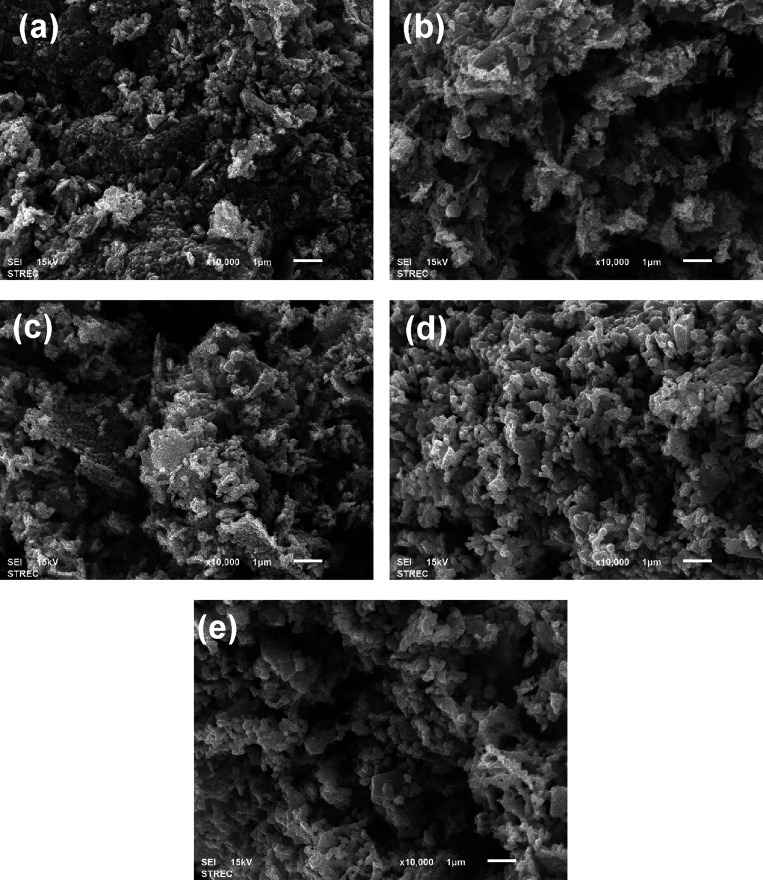
SEM analysis was conducted to find the surface morphology of ZnO nanoparticles prepared from the polymer-assisted coprecipitation method with different calcination temperatures. The SEM image showed the homogeneity of ZnO nanoparticles, which had a spherical shape in all samples. These results resemble the previous study29 attributed to PVP addition. Moreover, the agglomeration of the ZnO nanoparticles was found. The particle size of ZnO nanoparticles was increased with an increase in the calcination temperature. Because the aggregation of particles was formed during the calcination, the high heating process led to faster nucleation growth of ZnO nanoparticles, resulting in particle agglomeration.30,31 The average aggregate size of the ZnO nanoparticles presented in Figure 1 is estimated to be in the range between 0.46 and 1.20 μm using ImageJ software.
Figure 1.
SEM images of (a) ZnO-400 °C, (b) ZnO-500 °C, (c) ZnO-600 °C, (d) ZnO-700 °C, and (e) ZnO-800 °C (scale bars = 1 μm).
The formation and phase analyses of the prepared ZnO nanoparticles were analyzed by Siemens D5000 XRD with Cu Kα radiation (λ = 1.5418 Å). The XRD patterns of ZnO nanoparticles with different calcination temperatures are shown in Figure 2. The XRD patterns contain peaks corresponding to the reflection from the (100), (002), (101), (102), and (110) crystal planes of ZnO. These peaks correspond to the hexagonal wurtzite ZnO crystal system. The peak intensity of ZnO nanoparticles at a high calcination temperature is higher than other peaks. This is because the increasing calcination temperature can enhance the ZnO polycrystalline structure.32 Moreover, a broad peak around 2θ = 22.5° in all XRD patterns is not found, corresponding to the peak of PVP crystalline.33 It can be confirmed that PVP did not remain inside the ZnO nanoparticles. In addition, it can be observed that the narrowing of peaks (101) of ZnO nanoparticles increases with the calcination temperature due to the improvement in crystallinity after the calcination.31 Further, the crystallite size of ZnO nanoparticles at different temperatures has been estimated from the full width at half-maximum (fwhm) according to the Debye–Sherrer formula, as shown in eq 1.
| 1 |
where k is the shape factor (0.94), λ is the X-ray wavelength, β is the full width at half-maximum (fwhm), and θ is the Bragg angle.34 The crystallite sizes of all samples were estimated with the (1 0 1) diffraction peak. The crystalline sizes of ZnO nanoparticles at calcination temperatures of 400, 500, 600, 700, and 800 °C were 34, 36, 38, 39, and 40 nm, respectively, as shown in Table 1. Moreover, the specific surface area of ZnO nanoparticles was found to decrease with increasing calcination temperature because of the compact agglomeration of ZnO nanoparticles. This decrease in surface area with increasing calcination temperature is also supported by the increase in the crystalline size. The range of specific surface area was 28–49 m2/g, as shown in Table 1.
Figure 2.
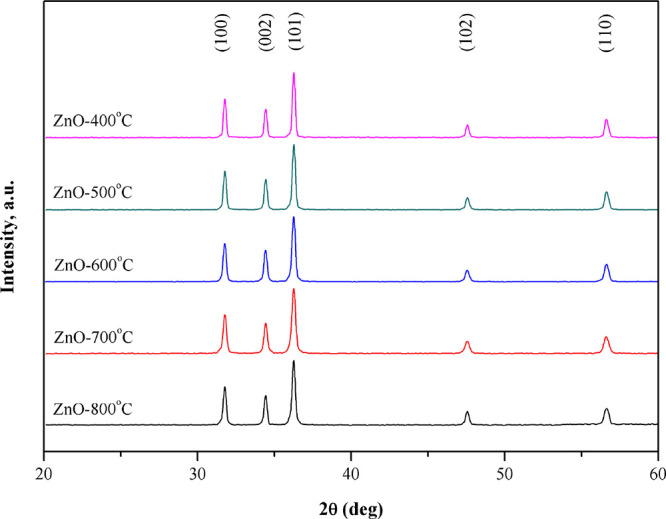
XRD patterns of ZnO nanoparticles calcined at various temperatures.
Table 1. Summary of the Physical Properties of ZnO Nanoparticles at Various Temperatures.
| photocatalyst | XRD 2θ of wurtzite (101) (degree)a | crystalline size (nm)a | surface area (m2/g)b | total pore (cc/g)b | average pore diameter (nm)b |
|---|---|---|---|---|---|
| ZnO-400 °C | 36.24 | 34 | 51 | 0.143 | 24.31 |
| ZnO-500 °C | 36.24 | 36 | 49 | 0.146 | 24.10 |
| ZnO-600 °C | 36.24 | 38 | 45 | 0.138 | 23.80 |
| ZnO-700 °C | 36.24 | 39 | 44 | 0.141 | 23.61 |
| ZnO-800 °C | 36.24 | 50 | 28 | 0.126 | 12.50 |
Measured from XRD.
Measured from N2 adsorption.
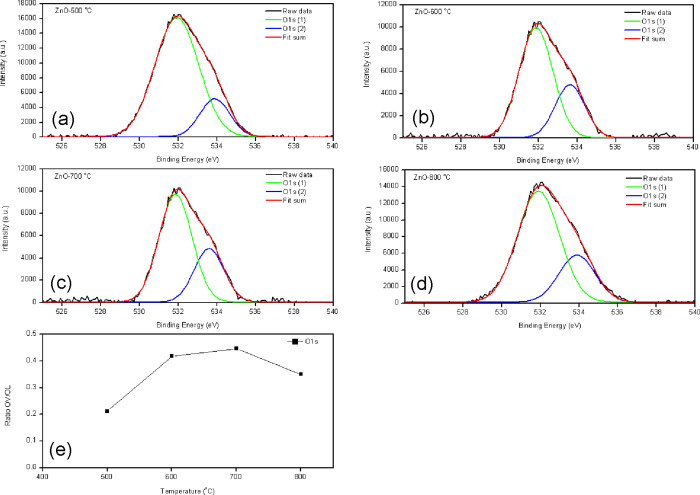
The elemental compositions and chemical states of Zn and O in the synthesized ZnO nanoparticle with different calcination temperatures were investigated using XPS, as shown in Figure 3. The binding energy of the O 1s peak for ZnO nanoparticles presented two sharps, centered at 531 and 533 eV, by fitting the experimental dot with two Gaussian curves, as shown in Figure 3a–d. The component on the binding energy located at 531 eV indicates the presence of the O2– ions on the wurtzite structure of the hexagonal Zn2+ ion array (OL). Meanwhile, the component on the binding energy located at 533 eV attributes the oxygen vacancies of the ZnO matrix (OV).35,36Figure 3e presents the ratio of the OV/OL of ZnO nanoparticles in different calcination temperatures. The result showed that the ratio of OV/OL increased with increasing calcination temperature. It can be concluded that a higher calcination temperature exhibits higher oxygen vacancies. The high oxygen vacancies can induce high photocatalytic activity.
Figure 3.
(a–d) XPS (O 1s) spectra and (e) plot of the ratio of oxygen vacancy (OV) to lattice oxygen (OL) of ZnO nanoparticles calcined at various temperatures.
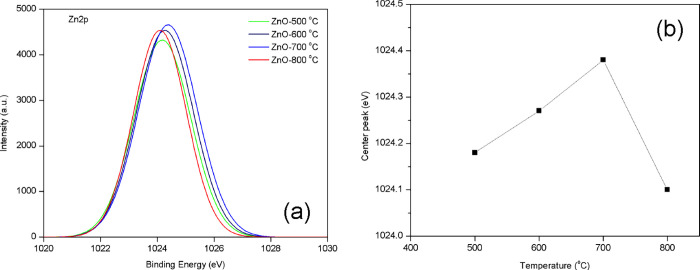
Figure 4a shows the high-resolution Zn 2p XPS spectra of all four samples with one peak at 1024 eV, ascribed to a spin–orbital coupling for Zn 2p3/2. The Zn element of all samples only exists in the Zn2+ chemical state.37,38 In addition, the center peak of Zn 2p3/2 was increased with increasing the calcination temperature range of 500–700 °C because of the ratio of OV/OL, as presented in Figure 4b.
Figure 4.
(a) XPS (Zn 2p3/2) spectra and (b) plot of the peak centers of ZnO nanoparticles calcined at various temperatures.
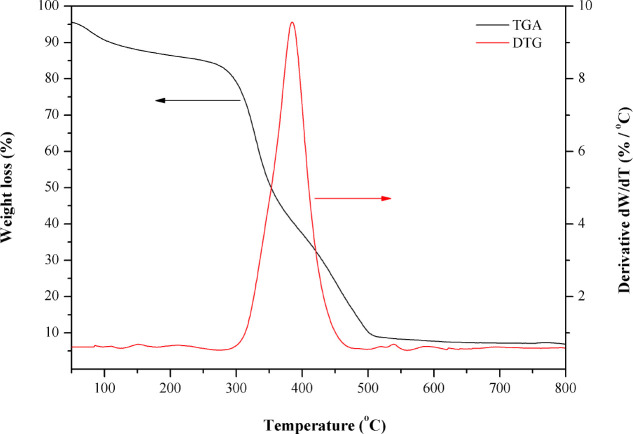
To confirm the suitable calcination temperature for removing PVP inside the ZnO nanoparticles, the ZnO nanoparticles with PVP were examined. The TGA thermograms of the dried ZnO powder with PVP and the temperature scale for measurement from 50 to 800 °C are shown in Figure 5. The weight loss of ZnO powder with PVP decreased by about 15% in the temperature range of 50–250 °C. This can be attributed to the evaporation of water molecules. A significant weight loss was observed in the thermal degradation at the temperature range of 300–500 °C, assigned to the decomposition of PVP. The final weight loss at the temperature range of 500–800 °C can be ascribed to removing carbon residues and forming nanocrystalline ZnO particles.39,40 From these results, it can be concluded that the suitable calcination temperature is above 500 °C for complete PVP removal.
Figure 5.
TGA thermogram of the dried ZnO powder (with PVP) before calcination.
FT-IR was used to confirm PVP removal inside ZnO nanoparticles after calcination. The FT-IR spectra of the calcined ZnO nanoparticles at 400 and 500 °C compared with PVP were presented in the spectral range of 4000–500 cm–1, as shown in Figure 6. The result showed that the peak around 3440 cm–1 is due to the O–H stretching vibration, associated with the amounts of water on the ZnO surface, and the narrow peak around 2950 cm–1 corresponds to C–H vibrations. The peak at 1664 cm–1 for pure PVP, which corresponds to the C=O bond, is shifted to the peak at around 1660 cm–1 for ZnO after calcination at 400 and 500 °C. Moreover, the peak intensity at 1664 cm–1 decreased with increasing calcination temperature. This indicated that the ZnO nanoparticle calcined at 500 °C deprived PVP and carbon residual, while the calcination temperature at 400 °C maintained some content of PVP.41 Further, the peak near 1000 cm–1 corresponds to the metal–oxygen tension or Zn–O bond. An increase in calcination temperature also increases the intensity due to the high Zn–O bonding from the thermal evolution.42
Figure 6.
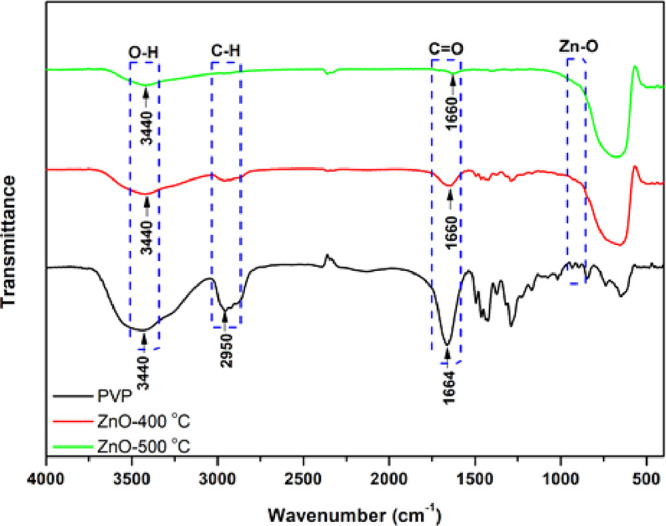
FT-IR spectra of PVP, ZnO-400 °C, and ZnO-500 °C.
Optical Properties of ZnO Nanoparticles
Photoluminescence (PL) spectroscopy was used to investigate the recombination of photogenerated electron and hole pairs. It can also be used to study the defects and other impurity states of the material. The PL spectra of the ZnO nanoparticles prepared with different calcination temperatures recorded at a 300 nm excitation wavelength (λex) are presented in Figure 7. The PL spectra of ZnO nanoparticles showed two prominent emission peaks. The intense emission peak is located at 380 nm in the ultraviolet region, attributed to free-exciton recombination in the near-band edge of ZnO. Another peak appears in the visible region at 480 nm, attributed to the oxygen and zinc vacancies (VO/VZn) on the ZnO surface.43,44 In addition, the PL intensity can be used to investigate the recombination rates of electrons and holes. At a low relative PL intensity of the ZnO nanoparticle calcined at 700 °C, the lowest recombination rate of the electron and hole (better optical properties) was observed. In contrast, the calcination temperature decreased, resulting in a high PL intensity and a high charge recombination rate. Moreover, the lowest PL intensity in the visible region of the calcined ZnO nanoparticle at 700 °C resulted in high oxygen vacancies. Wang et al. have reported that the increased oxygen vacancies can improve the charge separation efficiency and enhance the photocatalytic performance.45
Figure 7.
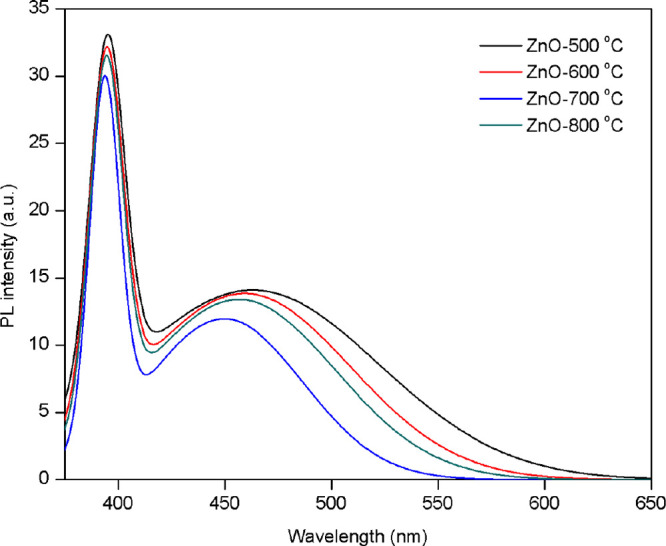
PL spectra of ZnO nanoparticles calcined at various temperatures.
Green Chemical Synthesis via Photocatalytic Glucose Conversions
Glucose conversion via photocatalysis uses the photocatalytic activity of ZnO nanoparticles, as shown in Figure 8. When irradiation is incident on the photocatalysts with the photon energy at least equal to the energy bandgap, electrons from the valence band are excited to the conduction band, leaving positive holes (h+) in the valence band. The photoinduced electrons and holes can migrate to the photocatalyst surface. The holes undergo redox reactions with the adsorbed water vapor to form the hydroxyl radical (·OH), while the electrons undergo redox reactions with the adsorbed O2 and generate superoxide anion radicals (O2·–).46 The superoxide anion radicals can further react to form hydrogen peroxide (H2O2) and hydroxyl radicals. All generated radicals act as strong oxidation reagents to react with glucose and conversely to be value-added chemicals.
Figure 8.
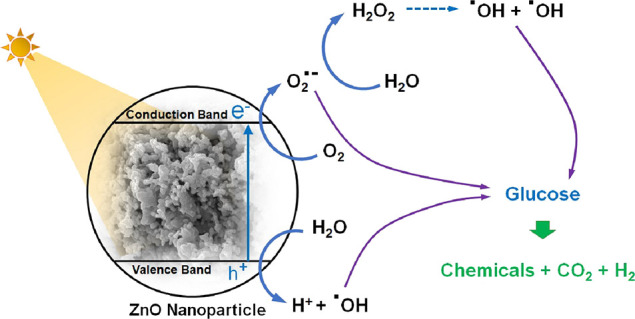
Photocatalytic activity of ZnO nanoparticles on glucose conversion.
Photocatalytic conversions of glucose with ZnO nanoparticles fabricated by polymer-assisted coprecipitation with different calcination temperatures were performed under UV-A irradiation (total power of 90 W), as presented in Figure 9. The photocatalytic reaction was carried out without acid and base in the reaction for 180 min with the temperature being controlled at 25 °C. The initial glucose concentration was 1 g/L in the presence of ZnO. An increase in the calcination temperature induced a higher glucose conversion. The ZnO nanoparticles calcined at 700 °C showed the highest glucose conversion of 21.5%. The result is shown in Figure 9 due to the good properties of the calcined ZnO nanoparticle at 700 °C, such as high specific surface area, low recombination of electrons and holes, and high oxygen vacancies. These properties led to enhancing the photocatalytic activity for glucose conversion. In addition, the glucose conversion increased with an increase in the irradiation time. This experiment found four value-added products: gluconic acid, arabinose, xylitol, and formic acid. This result is related to a previous report by Roongraung et al.23
Figure 9.
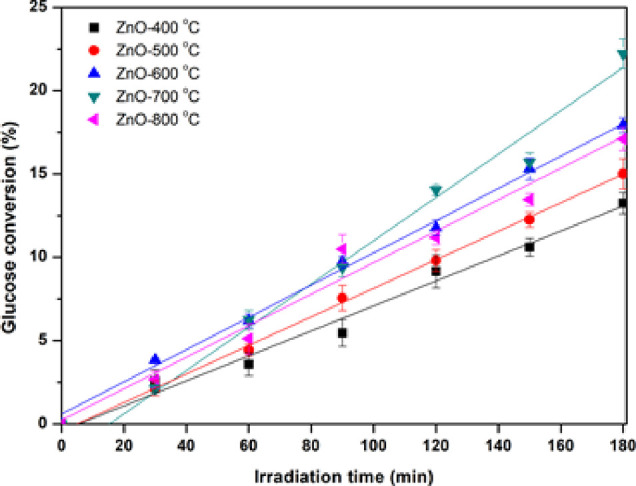
Photocatalytic conversions of glucose under UV irradiation for 180 min with ZnO nanoparticles calcined at various temperatures.
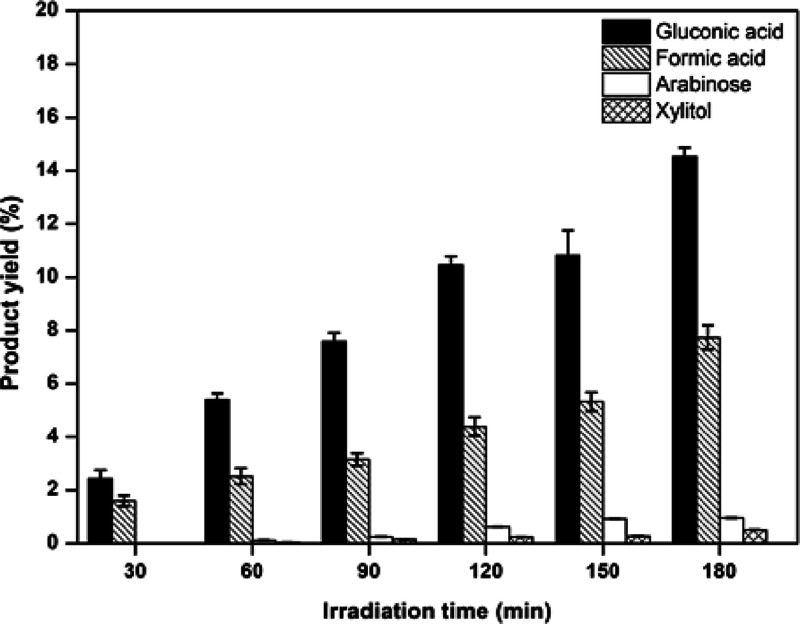
The yields of the four main products using ZnO calcined at 700 °C as a photocatalyst are shown in Figure 10. The result indicated that the highest yields of the four main products were found with increased irradiation time. The gluconic acid showed the highest yield of 15% for 180 min compared with other value-added products. At the same time, the formic acid, arabinose, and xylitol presented the highest yields of 7, 1, and 0.5% at 180 min, respectively. These results confirm that the ZnO nanoparticles enhance the high selectivity of carboxylic acid products (gluconic acid and formic acid). Moreover, the comparison of the conversion rate and glucose conversion of ZnO nanoparticles with different calcination temperatures is shown in Figure 11. The conversion rate was found to have a trend similar to glucose conversion. The ZnO nanoparticles calcined at 700 °C showed a conversion rate of 11.5 min–1, as shown in Figure 11a. Furthermore, the glucose conversions in each collecting time of ZnO at different calcination temperatures are shown in Figure 11b. It can be seen that the glucose conversion was not much different in the first 30 min. However, the conversion rate of ZnO calcined at 700 °C after 60 min observed the high glucose conversion compared with other calcination temperatures. From all the results, it can be concluded that the ZnO nanoparticles prepared by polymer-assisted coprecipitation are suitable to calcine at 700 °C. The ZnO nanoparticles calcined at 700 °C show two critical properties for photocatalytic activity, including surface area and charge separation efficiency. These properties enhance high photocatalytic activity because the reaction occurs on the surface of ZnO nanoparticles, and the charge separation efficiency can be extended to the photooxidation of glucose.
Figure 10.
Product yields of gluconic acid, formic aid, arabinose, and xylitol produced from glucose conversions using ZnO nanoparticles calcined at 700 °C.
Figure 11.
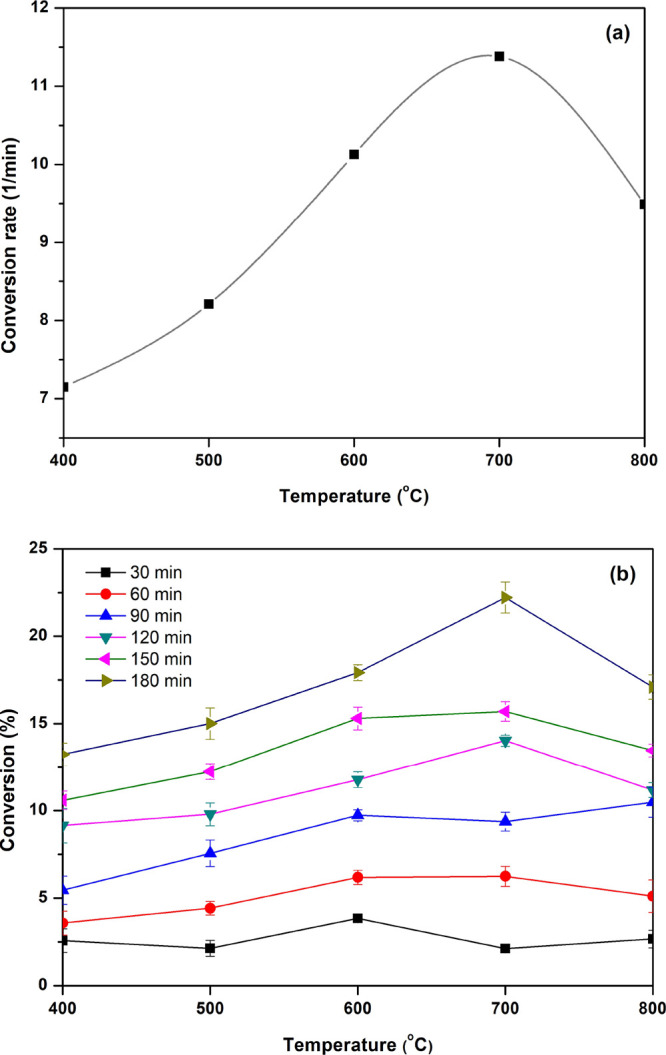
Comparison of (a) conversion rates and (b) glucose conversions using ZnO nanoparticles calcined at various temperatures.
Compared with other reports, Colmenares and Magdziarz studied the photocatalytic conversion of glucose with TiO2 photocatalysts.22 They found that the gluconic acid is the same as in this work, but they also found glucaric acid, where there is no signal detected of glucaric acid in this work. For other TiO2 photocatalysts, i.e., surfactant-assisted synthesized TiO2 particles,47 Ag-TiO2 nanofibers,18,24 zeolite-supported TiO2,23 and B/N and Ag/N codoped TiO2,17 the products found in this work are the same, but the selectivity was different. With increasing irradiation, high selectivity of carboxylic acid products and increased product yield was found, as mentioned above.
After chemical synthesis via photocatalytic conversion of glucose, the glucose solution was centrifuged. The catalysts could be separated from the solution using vacuum filter paper supported by the filter glass with water soaking to dissolve all glucose. The filtered catalysts showed the potential to be reused after drying.
Conclusions
The ZnO nanoparticles were successfully fabricated by the polymer-assisted coprecipitation method. The temperature of 700 °C is the suitable calcination temperature for ZnO nanoparticles because it presents better physical and optical properties. The ZnO calcined at 700 °C showed a crystal structure in hexagonal wurtzite with a high surface area (44 m2/g). Moreover, they had a high ratio of oxygen and zinc vacancies, a common defect in ZnO nanoparticles. These defects led to a high charge separation efficiency and enhanced high photocatalytic glucose conversion. The ZnO nanoparticles calcined at 700 °C showed the highest glucose conversion of 21.5% with a high yield of carboxylic acid products (gluconic and formic acid). The gluconic acid showed the highest yield of 15% for 180 min, while the formic acid, arabinose, and xylitol presented the highest yields of 7, 1, and 0.5% for 180 min, respectively. Moreover, the ZnO nanoparticles calcined at 700 °C also showed the highest conversion rate of 11.5 min–1. This experiment demonstrates that pure ZnO nanoparticles can convert glucose into value-added products without the addition of acid or base in the reaction.
Acknowledgments
The Research Strengthening Project of the Faculty of Engineering with Faculty of Science (King Mongkut’s University of Technology Thonburi) and Thailand Science Research and Innovation (TSRI) (Basic Research Fund: the fiscal year 2022, under project number FRB650048/0164) partly supported this work. The authors would like to acknowledge Ms. Wassana Lekkla for her assistance in schematic revision. K.R. thanks the KMUTT postdoctoral scholarship for the academic support.
The authors declare no competing financial interest.
References
- Wang Y.; Hou Z.; Guo H.; Shen L.; Wang G.; Cui F.; Zhang Q. Preparation of ZnO nanorods via aqueous solution process and their PL properties. Mater. Lett. 2013, 91, 107–110. 10.1016/j.matlet.2012.09.070. [DOI] [Google Scholar]
- Gupta S. K.; Joshi A.; Kaur M. Development of gas sensors using ZnO nanostructures. Journal of Chemical Sciences 2010, 122 (1), 57–62. 10.1007/s12039-010-0006-y. [DOI] [Google Scholar]
- RodnyiI P. A.; Khodyuk V. Optical and luminescence properties of zinc oxide. Opt. Spectrosc. 2011, 111 (5), 776–785. 10.1134/S0030400X11120216. [DOI] [Google Scholar]
- Liu Y.; Zeng H.; Li Y. ZnO-based transparent conductive thin films: Doping, performance, and processing. J. Nanomater. 2013, 2013, 196521. 10.1155/2013/196521. [DOI] [Google Scholar]
- Jose R.; Thavasi V.; Ramakrishna S. Metal oxides for dye-sensitized solar cells. J. Am. Ceram. Soc. 2009, 92 (2), 289–301. 10.1111/j.1551-2916.2008.02870.x. [DOI] [Google Scholar]
- Hariharan R.; Senthilkumar S.; Suganthi A.; Rajarajan M. Synthesis and characterization of daunorubicin modified ZnO/PVP nanorods and its photodynamic action. J. Photochem. Photobiol., A 2013, 252, 107–115. 10.1016/j.jphotochem.2012.11.017. [DOI] [PubMed] [Google Scholar]
- Gancheva M.; Markova-Velichkova M.; Atanasova G.; Kovacheva D.; Uzunov I.; Cukeva R. Design and photocatalytic activity of nanosized zinc oxides. Appl. Surf. Sci. 2016, 368, 258–266. 10.1016/j.apsusc.2016.01.211. [DOI] [Google Scholar]
- Kamalasanan M. N.; Chanda S. Sol-gel synthesis of ZnO thin films. Thin Solid Films 1996, 288, 112–115. 10.1016/S0040-6090(96)08864-5. [DOI] [Google Scholar]
- Haga K.; Katahira F.; Watanabe H. Preparation of ZnO films by atmospheric pressure chemical-vapor deposition using zinc acetylacetonate and ozone. Thin Solid Films 1999, 343–344 (1–2), 145–147. 10.1016/S0040-6090(98)01649-6. [DOI] [Google Scholar]
- Tam K. H.; Cheung C. K.; Leung Y. H.; Djurišić A. B.; Ling C. C.; Beling C. D.; Fung S.; Kwok W. M.; Chan W. K.; Phillips D. L.; Ding L.; Ge W. K. Defects in ZnO nanorods prepared by a hydrothermal method. J. Phys. Chem. B 2006, 110 (42), 20865–20871. 10.1021/jp063239w. [DOI] [PubMed] [Google Scholar]
- Hassanpour M.; Salavati-Niasari M.; Tafreshi S. A. H.; Safardoust-Hojaghan H.; Hassanpour F. Synthesis, characterization and antibacterial activities of Ni/ZnO nanocomposites using bis(salicylaldehyde) complex precursor. J. Alloys Compd. 2019, 788, 383–390. 10.1016/j.jallcom.2019.02.255. [DOI] [Google Scholar]
- Lam S.-M.; Kee M.-W.; Sin J.-C. Influence of PVP surfactant on the morphology and properties of ZnO micro/nanoflowers for dye mixtures and textile wastewater degradation. Mater. Chem. Phys. 2018, 212, 35–43. 10.1016/j.matchemphys.2018.03.002. [DOI] [Google Scholar]
- Chen D.; Wang Z.; Ren T.; Ding H.; Yao W.; Zong R.; Zhu Y. Influence of defects on the photocatalytic activity of ZnO. J. Phys. Chem. C 2014, 118 (28), 15300–15307. 10.1021/jp5033349. [DOI] [Google Scholar]
- Aimable A.; Buscaglia M. T.; Buscaglia V.; Bowen P. Polymer-assisted precipitation of ZnO nanoparticles with narrow particle size distribution. Journal of the European Ceramic Society 2010, 30 (2), 591–598. 10.1016/j.jeurceramsoc.2009.06.010. [DOI] [Google Scholar]
- Man J.; Gu W.; Hu Z.; Dou X.; Zhang H. High-performance ZnO humidity sensor synthesized by coprecipitation with PVP as surfactant for human respiration detection. Optoelectronics Letters 2023, 19 (1), 1–7. 10.1007/s11801-023-2105-2. [DOI] [Google Scholar]
- Yu Z. J.; Kumar M. R.; Sun D. L.; Wang L. T.; Hong R. Y. Large scale production of hexagonal ZnO nanoparticles using PVP as a surfactant. Mater. Lett. 2016, 166, 284–287. 10.1016/j.matlet.2015.12.102. [DOI] [Google Scholar]
- Suriyachai N.; Chuangchote S.; Laosiripojana N.; Champreda V.; Sagawa T. Synergistic effects of co-doping on photocatalytic activity of titanium dioxide on glucose conversion to value-added chemicals. ACS Omega 2020, 5 (32), 20373–20381. 10.1021/acsomega.0c02334. [DOI] [PMC free article] [PubMed] [Google Scholar]
- Payormhorm J.; Chuangchote S.; Kiatkittipong K.; Chiarakorn S.; Laosiripojana N. Xylitol and gluconic acid productions via photocatalytic-glucose conversion using TiO2 fabricated by surfactant-assisted techniques: Effects of structural and textural properties. Mater. Chem. Phys. 2017, 196, 29–36. 10.1016/j.matchemphys.2017.03.058. [DOI] [Google Scholar]
- Ilie M.; Cojocaru B.; Parvulescu V. I.; Garcia H. Improving TiO2 activity in photoproduction of hydrogen from sugar industry wastewaters. Int. J. Hydrogen Energy 2011, 36 (24), 15509–15518. 10.1016/j.ijhydene.2011.09.029. [DOI] [Google Scholar]
- Madriz L.; Tatá J.; Carvajal D.; Núñez O.; Scharifker B.; Mostany J.; Borrás C.; Cabrerizo F. M.; Vargas R. Photocatalysis and photoelectrochemical glucose oxidation on Bi2WO6: Conditions for the concomitant H2 production. Renewable Energy 2020, 152, 974–983. 10.1016/j.renene.2020.01.071. [DOI] [Google Scholar]
- Zhou B.; Song J.; Zhou H.; Wu T.; Han B. Using the hydrogen and oxygen in water directly for hydrogenation reactions and glucose oxidation by photocatalysis. Chemical Science 2016, 7 (1), 463–468. 10.1039/C5SC03178H. [DOI] [PMC free article] [PubMed] [Google Scholar]
- Colmenares J. C.; Magdziarz A. Room temperature versatile conversion of biomass-derived compounds by means of supported TiO2 photocatalysts, Magdziarz, A. J. Mol. Catal. A: Chem. 2013, 366, 156–162. 10.1016/j.molcata.2012.09.018. [DOI] [Google Scholar]
- Roongraung K.; Chuangchote S.; Laosiripojana N. Enhancement of photocatalytic oxidation of glucose to value-added chemicals on TiO2 photocatalysts by a zeolite (type Y) support and metal loading. Catalysts 2020, 10 (4), 423. 10.3390/catal10040423. [DOI] [Google Scholar]
- Roongraung K.; Chuangchote S.; Laosiripojana N.; Sagawa T. Electrospun Ag-TiO2 manofibers for photocatalytic glucose conversion to high-value chemicals. ACS Omega 2020, 5 (11), 5862–5872. 10.1021/acsomega.9b04076. [DOI] [PMC free article] [PubMed] [Google Scholar]
- Xu H.; Hu Y.; Huang D.; Lin Y.; Zhao W.; Huang Y.; Zhang S.; Tong Y. Glucose-induced formation of oxygen vacancy and Bi-metal comodified Bi5O7Br Nanotubes for Efficient Performance Photocatalysis. ACS Sustainable Chem. Eng. 2019, 7 (6), 5784–5791. 10.1021/acssuschemeng.8b05336. [DOI] [Google Scholar]
- Singh J.; Manna A. K.; Soni R. K. Sunlight driven photocatalysis and non-enzymatic glucose sensing performance of cubic structured CuO thin films. Appl. Surf. Sci. 2020, 530, 147258 10.1016/j.apsusc.2020.147258. [DOI] [Google Scholar]
- Zhao H.; Li C.-F.; Yong X.; Kumar P.; Palma B.; Hu Z.-Y.; Van Tendeloo G.; Siahrostami S.; Larter S.; Zheng D.; Wang S.; Chen Z.; Kibria M. G.; Hu J. Coproduction of hydrogen and lactic acid from glucose photocatalysis on band-engineered Zn1-xCdxS homojunction. iScience 2021, 24 (2), 102109 10.1016/j.isci.2021.102109. [DOI] [PMC free article] [PubMed] [Google Scholar]
- Cheng M.; Zhang Q.; Yang C.; Zhang B.; Deng K. Photocatalytic oxidation of glucose in water to value-added chemicals by zinc oxide-supported cobalt thioporphyrazine. Catalysis Science & Technology 2019, 9 (24), 6909–6919. 10.1039/C9CY01756A. [DOI] [Google Scholar]
- Kareem S. J. Studying the effect of polyvinylpyrrolidone (PVP) on characterization of ZnO nanoparticles synthesized by sol-gel method. Iraqi J. Mech. Mater. Eng. 2018, 18 (3), 460–469. 10.32852/iqjfmme.v18i3.181. [DOI] [Google Scholar]
- Alibe I.; Matori K.; Sidek H.; Yaakob Y.; Rashid U.; Alibe A.; Mohd Zaid M.; Ahmad Khiri M. Effects of calcination holding time on properties of wide band gap willemite semiconductor nanoparticles by the polymer thermal treatment method. Molecules 2018, 23 (4), 873. 10.3390/molecules23040873. [DOI] [PMC free article] [PubMed] [Google Scholar]
- Baharudin K. B.; Abdullah N.; Derawi D. Effect of calcination temperature on the physicochemical properties of zinc oxide nanoparticles synthesized by coprecipitation. Materials Research Express 2018, 5 (12), 125018. 10.1088/2053-1591/aae243. [DOI] [Google Scholar]
- Sugihartono I.; Retnoningtyas A.; Rustana C.; Umiatin; Yudasari N.; Isnaen; Imawan C.; Kurniadewi F. The influence of calcination temperature on optical properties of ZnO nanoparticles. AIP Conf. Proc. 2019, 2169 (1), 060010 10.1063/1.5132688. [DOI] [Google Scholar]
- Choudhary S.; Sengwa R. J. ZnO nanoparticles dispersed PVA–PVP blend matrix based high performance flexible nanodielectrics for multifunctional microelectronic devices. Curr. Appl. Phys. 2018, 18 (9), 1041–1058. 10.1016/j.cap.2018.05.023. [DOI] [Google Scholar]
- Gurushankar K.; Jeyavijayan S.; Gohulkumar M.; Viswanathan K. Synthesis, optical and morphological studies of ZnO nanoparticles capped with PVP as a surfactant. Int. J. Chem. Sci. 2018, 16 (1), 240. [Google Scholar]
- Guo H. L.; Zhu Q.; Wu X. L.; Jiang Y. F.; Xie X.; Xu A. W. Oxygen deficient ZnO1–x nanosheets with high visible light photocatalytic activity. Nanoscale 2015, 7 (16), 7216–7223. 10.1039/C5NR00271K. [DOI] [PubMed] [Google Scholar]
- Chang F. M.; Brahma S.; Huang J. H.; Wu Z. Z.; Lo K. Y. Strong correlation between optical properties and mechanism in deficiency of normalized self-assembly ZnO nanorods. Sci. Rep. 2019, 9 (1), 1–9. 10.1038/s41598-018-37601-8. [DOI] [PMC free article] [PubMed] [Google Scholar]
- Knut R.; Lindblad R.; Grachev S.; Faou J. Y.; Gorgoi M.; Rensmo H.; Søndergård E.; Karis O. Reactive ZnO/Ti/ZnO interfaces studied by hard x-ray photoelectron spectroscopy. J. Appl. Phys. 2014, 115 (4), 043714 10.1063/1.4854636. [DOI] [Google Scholar]
- Chen W.; Liu X.; Zhuo S.; Chai J.; Xu T.; Shi E. Hydrogen Annealing on the structural, optical and magnetic properties of Yb-doped ZnO diluted magnetic semiconductor thin films. International Journal of Magnetics and Electromagnetism 2018, 4, 1–6. 10.35840/2631-5068/6513. [DOI] [Google Scholar]
- Cao X. T.; Showkat A. M.; Bach L. G.; Lee W. K.; Lim K. T. Preparation and characterization of Poly (4-vinylpyridine) encapsulated zinc oxide by surface-initiated RAFT polymerization. Mol. Cryst. Liq. Cryst. 2014, 599 (1), 55–62. 10.1080/15421406.2014.935921. [DOI] [Google Scholar]
- Yu Z. J.; Kumar M. R.; Sun D. L.; Wang L. T.; Hong R. Y. Large scale production of hexagonal ZnO nanoparticles using PVP as a surfactant. Mater. Lett. 2016, 166, 284–287. 10.1016/j.matlet.2015.12.102. [DOI] [Google Scholar]
- Al-Hada N. M.; Saion E. B.; Shaari A. H.; Kamarudin M. A.; Flaifel M. H.; Ahmad S. H.; Gene S. A. A facile thermal-treatment route to synthesize ZnO nanosheets and effect of calcination temperature. PloS One 2014, 9 (8), e103134 10.1371/journal.pone.0103134. [DOI] [PMC free article] [PubMed] [Google Scholar]
- Bai S.; Hu J.; Li D.; Luo R.; Chen A.; Liu C. C. Quantum-sized ZnO nanoparticles: synthesis, characterization and sensing properties for NO2. J. Mater. Chem. 2011, 21 (33), 12288–12294. 10.1039/c1jm11302j. [DOI] [Google Scholar]
- Han N.; Wu X.; Chai L.; Liu H.; Chen Y. Counterintuitive sensing mechanism of ZnO nanoparticle based gas sensors. Sens. Actuators, B 2010, 150 (1), 230–238. 10.1016/j.snb.2010.07.009. [DOI] [Google Scholar]
- Chandrika M.; Ravindra A. V.; Rajesh C.; Ju S. Tailoring of crystal phase, morphology, and optical properties of ZnO nanostructures by starch-assisted co-precipitation synthesis and annealing. Eur. Phys. J. Plus 2020, 135 (1), 1–15. 10.1140/epjp/s13360-019-00073-4. [DOI] [Google Scholar]
- Wang C.; Wu D.; Wang P.; Ao Y.; Hou J.; Qian J. Effect of oxygen vacancy on enhanced photocatalytic activity of reduced ZnO nanorod arrays. Appl. Surf. Sci. 2015, 325, 112–116. 10.1016/j.apsusc.2014.11.003. [DOI] [Google Scholar]
- Muangmora R.; Kemacheevakul P.; Chuangchote S. Titanium dioxide and its modified forms as photocatalysts for air treatment. Current Analytical Chemistry 2021, 17 (2), 185. 10.2174/1573411016666200131130152. [DOI] [Google Scholar]
- Payormhorm J.; Chuangchote S.; Laosiripojana N. CTAB-assisted sol-microwave method for fast synthesis of mesoporous TiO2 photocatalysts for photocatalytic conversion of glucose to value-added sugars. Mater. Res. Bull. 2017, 95, 546–555. 10.1016/j.materresbull.2017.08.016. [DOI] [Google Scholar]


