

Abstract

The aurora kinase is a key enzyme that is implicated in tumor growth. Research revealed that small molecules that target aurora kinase have beneficial effects as anticancer agents. In the present study, in order to identify potential antibreast cancer agents with aurora kinase inhibitory activity, we employed QSARINS software to perform the quantitative structure–activity relationship (QSAR). The statistical values resulted from the study include R2 = 0.8902, CCCtr = 0.7580, Q2 LOO = 0.7875, Q2LMO = 0.7624, CCCcv = 0.7535, R2ext = 0.8735, and CCCext = 0.8783. Among the four generated models, the two best models encompass five important variables, including PSA, EstateVSA5, MoRSEP3, MATSp5, and RDFC24. The parameters including the atomic volume, atomic charges, and Sanderson’s electronegativity played an important role in designing newer lead compounds. Based on the above data, we have designed six series of compounds including 1a–e, 2a–e, 3a–e, 4a–e, 5a–e, and 6a–e. All these compounds were subjected to molecular docking studies by using AutoDock v4.2.6 against the aurora kinase protein (1MQ4). Among the above 30 compounds, the 2-amino thiazole derivatives 1a, 2a, 3e, 4d, 5d, and 6d have excellent binding interactions with the active site of 1MQ4. Compound 1a had the highest docking score (−9.67) and hence was additionally subjected to molecular dynamic simulation investigations for 100 ns. The stable binding of compound 1a with 1MQ4 was verified by RMSD, RMSF, RoG, H-bond, molecular mechanics-generalized Born surface area (MM-GBSA), free binding energy calculations, and solvent-accessible surface area (SASA) analyses. Furthermore, newly designed compound 1a exhibited excellent ADMET properties. Based on the above findings, we propose that the designed compound 1a may be utilized as the best theoretical lead for future experimental research of selective inhibition of aurora kinase, therefore assisting in the creation of new antibreast cancer drugs.
1. Introduction
Cancer is the second largest disease responsible for the death of many worldwide. According to the World Health Organization1 statistics, cancer was responsible for the death of nearly 10 million people in 2020. Similarly, a recent survey in 2023 by Seigel et al. anticipated that 1,958,310 new cancer cases and deaths of about 609,820 cases occur in the United States.2 There is an assortment of options available for the successful treatment of cancer, ranging from chemotherapy to radiotherapy. However, the available treatment modalities are not sufficient to completely eradicate cancer. One of the commonly employed methods of treatment is chemotherapy. There are more than 200 anticancer drugs on the market. Despite this, cancer prevention is not in full swing due to limitations of chemotherapy like cost, side effects, long periods of treatment, etc. This state of affairs strongly recommends the design and development of newer anticancer drugs.
Thiazole is an important five-membered privileged heterocyclic ring seen in a number of bioactive compounds. Recent studies suggested that thiazole is one of the critical core motifs in the design and development of novel agents with different bioactivities.3,4 This is due to the fact that the thiazole ring, when present as an essential element of lead compounds, determines the physicochemical, pharmacokinetic, and druglike properties.5−7 Additionally, while designing new medicinal compounds, the substituted thiazole ring may act as a pharmacophore or sometimes as a spacer group in molecular hybridization or as a bioisoster.8−10 Due to such vast application of thiazoles in medicinal chemistry research, scientists have reported a collection of thiazole derivatives with a sundry of biological activities including anticancer activity.11−16 Due to its excellent anticancer properties, the thiazole template encompasses the main scaffold in the anticancer drugs including the tyrosine kinase inhibitor Dasatinib, competitive and selective BRAF inhibitor Dabrafenib, microtubule inhibitor Epothilone, microtubule stabilizer Ixabepilone, and a cytotoxic marine peptide useful in multidrug-resistant cancer Patellamide A (Figure 1).
Figure 1.

Structures of anticancer drugs containing a thiazole template.
Aurora kinases, also known as mitotic kinases, are one key types of regulatory enzymes that control the mitosis part of the cell division process. They belong to the enzyme family serine/threonine kinase and play a pivotal role in overseeing critical processes throughout mitosis, encompassing the maturation and parting of centrosomes, the assembly of the mitotic spindle, and the orderly segregation of chromosomes.17,18 The dysregulation of aurora kinases, stemming from genetic amplification and excessive protein expression, leads to aneuploidy and has the potential to foster the development of cancer.19,20 There are three isoforms discovered in mammals including aurora kinase A (AURKA), aurora kinase B (AURKB), and aurora kinase C (AURKC).21 Among the three isoenzymes, the overexpression of aurora kinase isoforms A and B had a greater impact on the evolution of a wide variety of cancers, whereas isoform C has a lesser role in progressing cancer. Hence, inhibitors of AURKA and AURKB are useful in the treatment of cancer.22,23 Previous reports suggest that thiazole derivatives 4-((5-bromothiazol-2-yl)amino)-N-methylbenzamide (A) and 4-methyl-5-(2-(4-morpholinophenylamino)pyrimidin-4-yl)thiazol-2-amine (B) have promising anticancer activity through aurora kinase inhibition (Figure 2).24,25
Figure 2.

Chemical structures of amino thiazole derivatives (A, B) with anti-aurora kinase activity.
In the past few decades, computer-aided drug design (CADD) tools have been used extensively by medicinal chemists for the successful discovery of novel therapies.26 The fields of drug discovery and development have witnessed significant advancements in computational methodologies. Quantitative structure–activity relationship (QSAR) studies have become indispensable tools for predicting the biological activities of novel compounds. Additionally, the assessment of absorption, distribution, metabolism, excretion, and toxicity (ADMET) properties is crucial for optimizing drug candidates. Molecular docking techniques allow us to investigate the binding interactions between ligands and target proteins, while molecular dynamic simulation provides insights into the dynamic behavior of these complexes. Several noteworthy studies in these domains have significantly contributed to our understanding and application of these methodologies in the design of promising novel heterocyclic derivatives with a wide spectrum of biological properties including anticancer activity.27−43 In this article, we leverage these cutting-edge techniques to explore the potential of 2-amino thiazole derivatives (Figure 3) as aurora kinase Inhibitors in the context of breast cancer treatment. Through the integration of QSAR, ADMET prediction, molecular docking, and molecular dynamic simulation, we aim to provide a comprehensive and up-to-date analysis that advances our understanding of this promising class of compounds for the therapeutic development of novel anticancer agents at an accelerated phase.
Figure 3.

General structure of the explored 2-amino thiazole derivatives.
In view of the above facts, initially, we conducted the QSAR analysis using the QSARINS tool,44,45 followed by ADMET and drug-likeness properties using SwissADME software.46,47 Further, we carried out molecular docking and molecular dynamic simulation studies to understand the binding modes and affinities to the target aurora kinase for the identification of a potential lead compound.
2. Materials and Methods
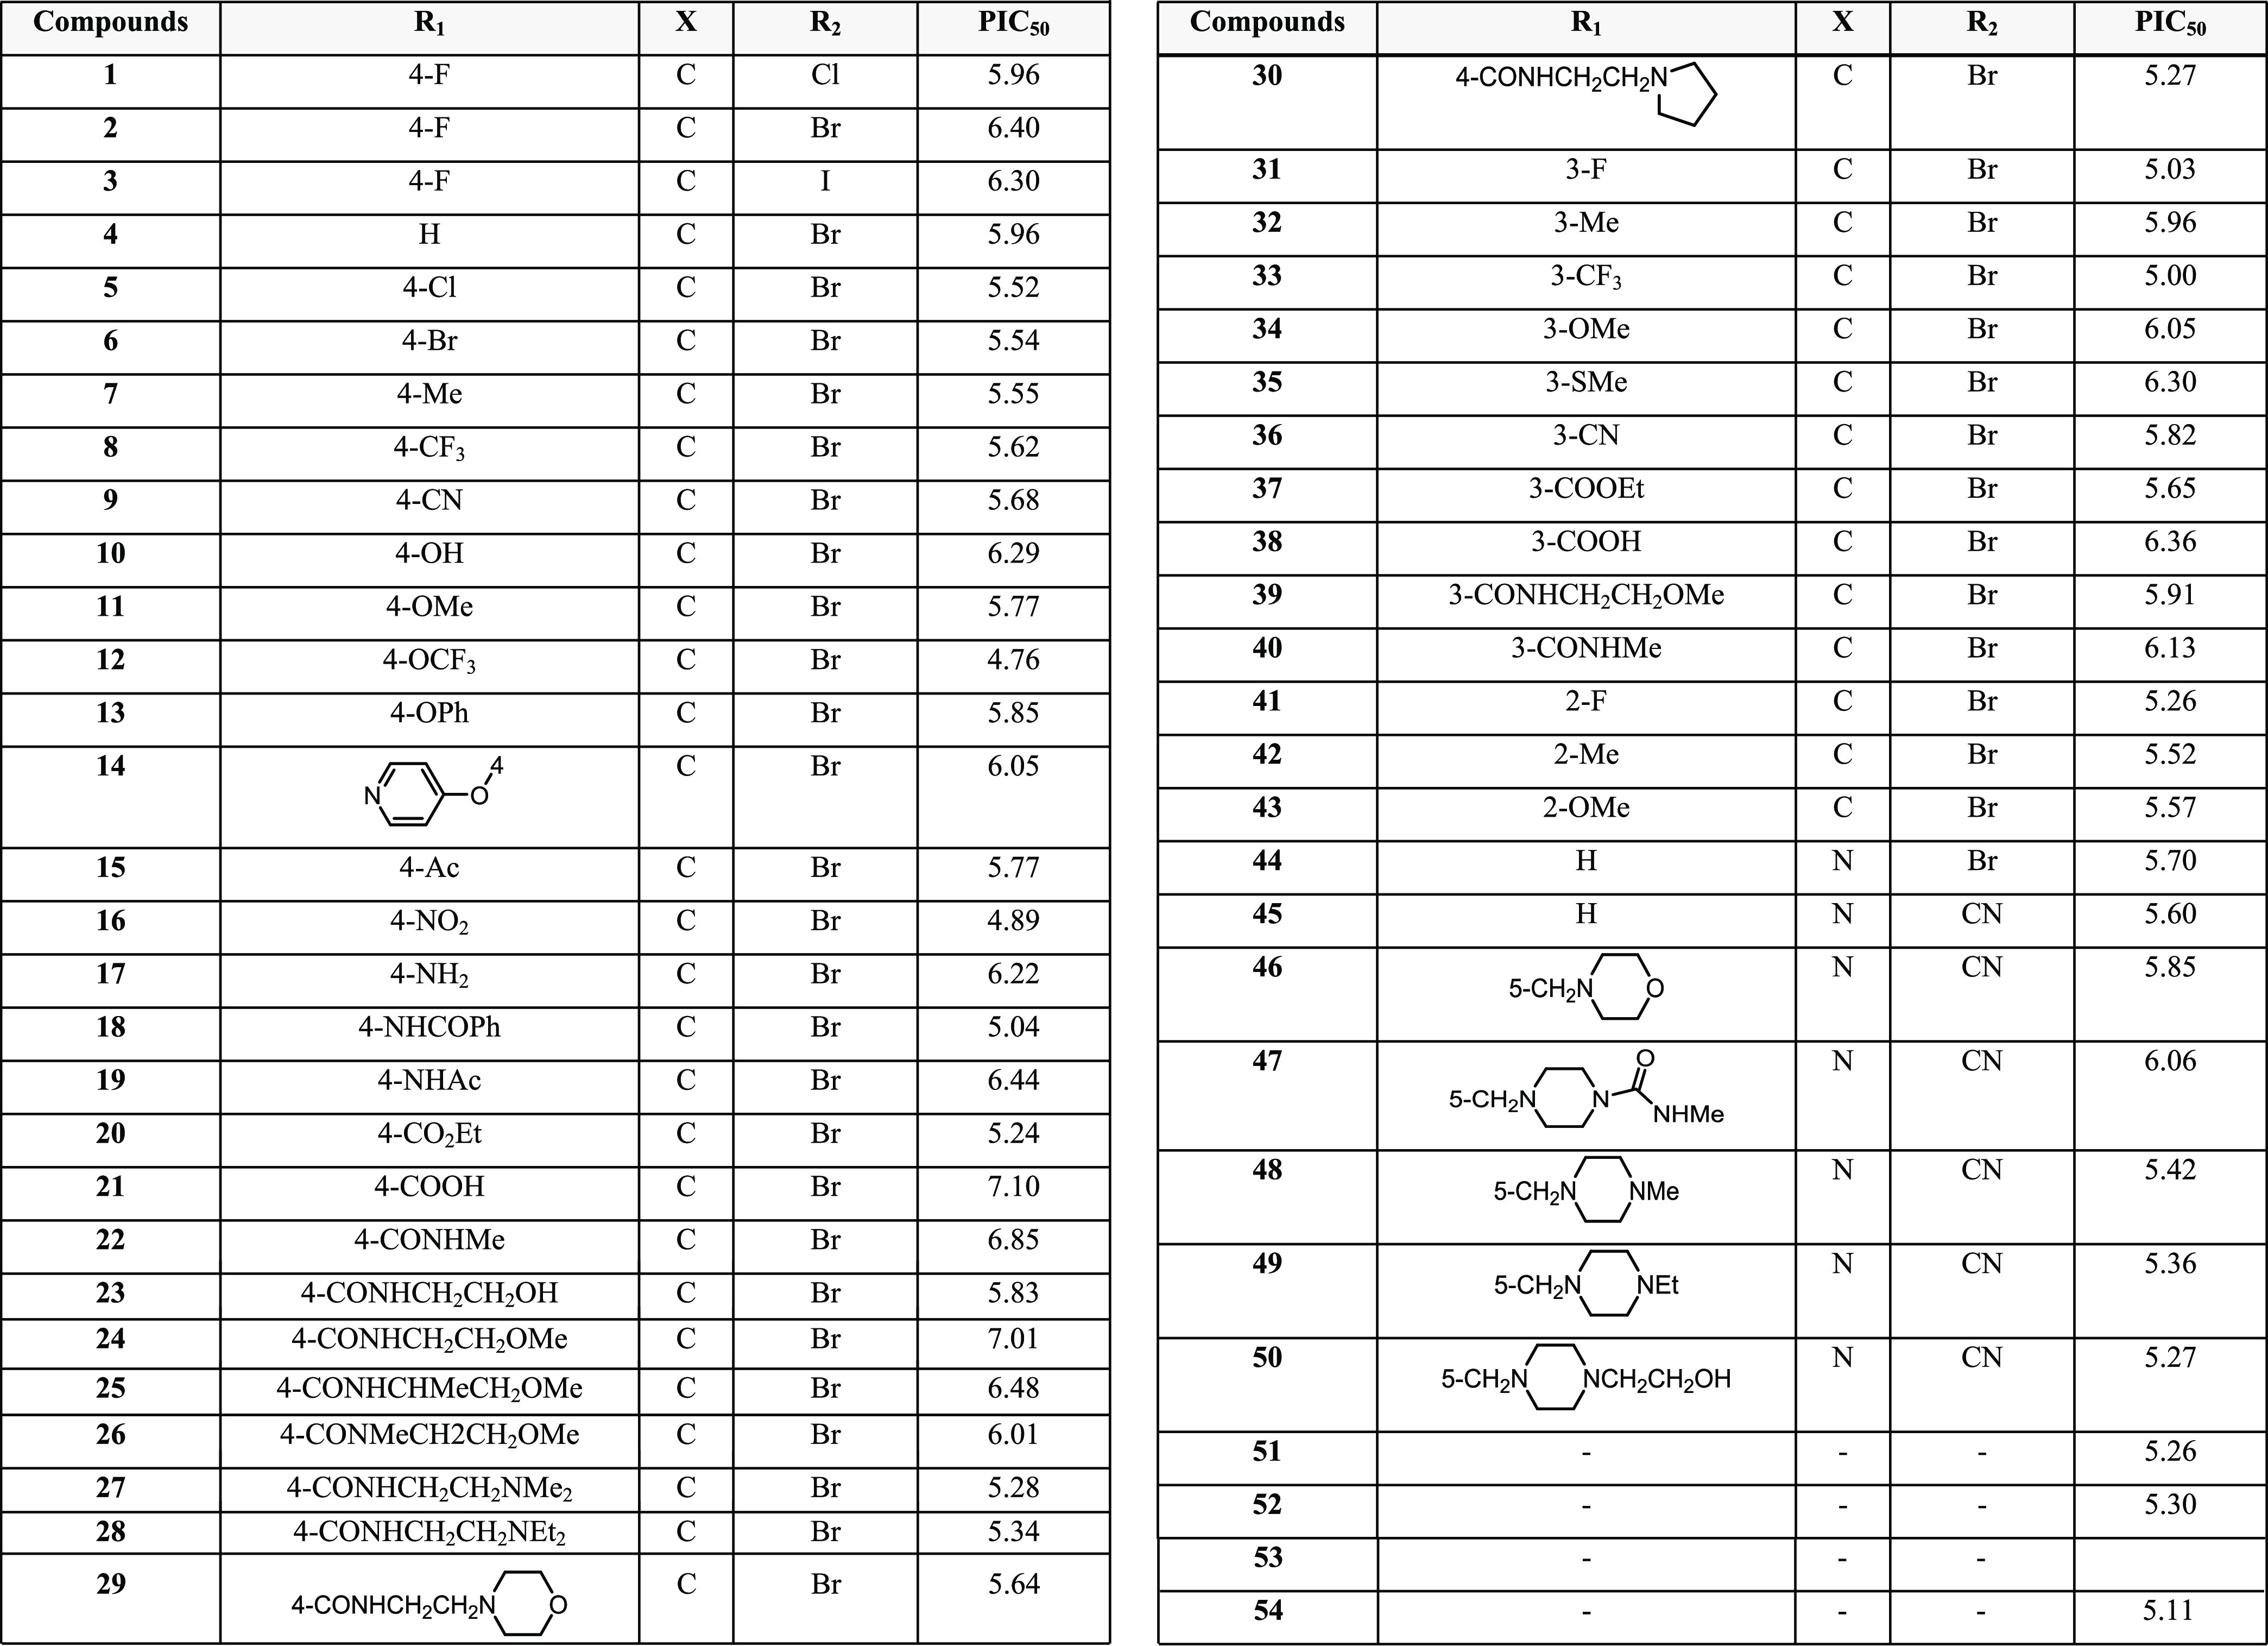
Using ordinary least squares, “QSARINS” permits the construction of a large number of linear regression models that are rigorously verified and validated using the chemometric approach. A collection of 54 compounds with aurora kinase inhibitory characteristics was chosen from a data set of amino thiazole derivatives reported in the literature.48,49 The IC50 values generated for the above 54 compounds were modified into pIC50 values by the use of dependent variables (Table 1).
Table 1. pIC50 Values of the Data Set Aurora Kinase Inhibitors.

2.1. Preparation of Molecular Structures and Optimization of 3D Geometry
The molecular structures required for the study were created using ChemDraw Professional 16, and the structures were further converted into mol2 file format by using Open Babel v2.4.1.17.50
ChemDraw Professional 16 version was used to create the molecular structures, which were then translated to the mol2 format using Open Babel v2.4.1.17.51 When hydrogens were added, Avogadro V1.2.018 was also utilized to optimize the shape of the molecules. The steepest descent method was employed in combination with the molecular modeling force field (MMFF94) developed by using molecular mechanics. The Avogadro tool and the “scoring function energy” were used to calculate the ideal conformer with the global minimal energy for each molecule. The same conformer was used throughout the investigation.52
2.2. Data Set Preparation
2.2.1. Model Generation and Descriptor Selection
The molecular geometries of the compounds were optimized by using the MMFF94 molecular mechanics technique. The findings were used to compute descriptors, and no falsified frequencies were found. As a result, the calculated geometries were local energy surface potential minima. Chem Des-Chemopy was used to compute a number of molecular descriptors. The statistical significance of the models utilized was determined using the Microsoft Excel data analysis add-in and multiple validation processes.53 A numerical representation of a molecular attribute generated from a standardized experiment or mathematical approach is termed a molecular descriptor. Descriptors can be estimated using structural data such as van der Waals forces, atomic bond counts, distances, pharmacophoric properties, partial charges, volume, and shape, or they can be generated experimentally using physical features.
The correlation coefficients between each description and pIC50 were determined to reduce the number of descriptors. The coefficient of determination (R2) of the descriptors used for model creation is less than 0.5; all of the descriptors in Table 1 are chosen. Table 2 displays the pIC50 values for the specified descriptors. The following factors were considered while using the successive-step model to choose the descriptors, as shown in Table 2. To avoid collinearity between variables, one descriptor was employed for every five compounds, and different types of descriptors were used. Multiple linear regression (MLR) was performed to assess the linear association between pIC50 and the other descriptors with valid models having R2 greater than 0.568. The standard equation was used to find the linear relationship between pIC50 and descriptors.54
Table 2. Best Model’s Correlation Matrix.
| descriptors | EstateVSA5 | PSA | MoRSEP3 | MATSp5 | RDFC24 |
|---|---|---|---|---|---|
| EstateVSA5 | 1.0000 | ||||
| PSA | 0.1702 | 1.0000 | |||
| MoRSEP3 | 0.2210 | –0.0837 | 1.0000 | ||
| MATSp5 | 0.0388 | 0.3835 | –0.2034 | 1.0000 | |
| RDFC24 | 0.2714 | –0.0710 | –0.2270 | 0.0312 | 1.0000 |
The chemical descriptor data for the aforementioned substances were obtained from the Chem Des-Chemopy Web site. All-zero values, missing values, and descriptors with constant values (>50%) were removed from the variables, which were organized and prefiltered. Pairwise correlation was used to select descriptors with values larger than 0.85. The correlation matrix constructed using all of the filtered descriptors was used to choose those having a greater association with activity for this investigation.55 The study comprised 11 variables having a cutoff correlation value of higher than 0.10 from the descriptor screening. (The correlation matrix, as well as the compound Pki values of selected descriptors and intercorrelation between selected descriptors, are shown in Table 2.)56 The 44 molecules studied were separated into training and prediction groups in a 5:1 ratio based on the response order. Only a handful of the best models were presented based on several trials and models.
2.3. Model Calculation and Variable Selection
“QSARINS” explores all conceivable pairings of the given descriptors based on user selections. Model fitness was measured using Friedman’s LOF (lack-of-fit) function, and a genetic technique was employed to identify descriptors linked to molecular-level physiological features. The LOF smoothness level is initially set at 1.0. In order to investigate the novel possibilities, defined parameters such as mutation probability (0.1), population size (500), and maximum generations were combined with a genetic algorithm.
2.4. Model Validation
The validity of the models produced by “QSARINS” was examined both internally and externally, and the application domain was also examined. Selected models underwent internal validation using the cross-validation leave-one-out (Q2LOO), cross-validation leave-many-out (Q2LMO), root mean squared error (RMSE), and Y-scrambling techniques, as well as external validation using the Q2 F1, Q2 F2, and Q2 F3 techniques as well as the concordance correlation coefficient (CCC). Fifty percent of the items from the training set were randomly removed every time Q2LMO was run 5000 times. Five thousand rounds of response data rearranging are required in Y-scrambling to reduce chance association in the initial model. It is important to note that the model’s RMSE under prediction must have a lower RMSE and that its R2 and Q2LOO must be higher than those of scrambled ones. The major use of CCC is to evaluate the repeatability of models (CCCext), which it does by measuring the agreement between two variables. The applicability domain in modeling is a theoretical area determined by the descriptors used and assessed using leverage analysis.
where m is the total number of query compounds (hat) and XI is the descriptor row value for query compound I. X is the np matrix of the training set, where n is the number of samples in the training set and p is the number of model descriptors. The model domain’s leverage cutoff value h* is 3(p + 1)/n. The sample is larger than h* when the leverage of the training set is greater than h*. The test set prediction (X outlier) is an extension of the model, and the code R1 R2 Ki (nM) determines the model. A compound with a standardized residual of greater than three (3 standard deviation units) is referred to as a Y-outlier. The model was enhanced steadily by the use of descriptors, which were incrementally added until the model could no longer be improved. Then, we excluded the descriptors that had the least statistically significant impact on the model fit. The process was continued until no more descriptors could be eliminated without leading to a statistically significant loss of fit. Three models were made using these criteria. As shown in Table 2, the ideal prediction model with the fewest descriptors, maximum determination coefficient (R2),57−59 and no descriptor collinearity was selected for further improvement. The “leave-one-out” (LOO) cross-validation approach was used to evaluate the models’ validity. During the validation stage, all molecules’ data, with the exception of one, were used to train the model function. Next, the pIC50 for the chemical that was not examined in the research was predicted using the model’s characteristics. Statistical measures including Q2 (cross-validated correlation coefficient), R2 (regression coefficient), SD (standard deviation), and SE (standard error) were used to evaluate the quality of the proposed QSAR models:
2.5. Designing of Compounds Based on the Best Model
The residual values generated by the constructed QSAR model demonstrate that the bioactivity variation from the experimental inhibition value was not particularly significant. The selected QSAR model, which included structural information, helped in the creation of compounds with better aurora kinase inhibitory activity. The above findings clearly suggest that 2-amino thiazole is an indispensable structure for the designing of newer aurora kinase inhibitors. Hence, we designed six series (1a–1e, 2a–2e, 3a–3e, 4a–4e, 5a–5e, and 6a–6e) of 2-amino thiazole derivatives bearing a 4-bromophenyl (useful for making hydrophobic interactions with an aurora kinase enzyme) motif at the fifth position of the thiazole ring and a range of bioactive structural fragments (imidazolidones/pyrimidines/alkyl chains/amides/urea derivatives/hydrazones) on the amino group present at the position 2 of the thiazole ring. The interaction along the hydrophobic and hydrophilic areas of the aurora kinase active site was examined in our work, and the results are significant for compound design. To produce low-energy conformers of the selected target compounds, geometry optimization and Avogadro’s tool were applied.60 The best available low-energy conformers for each ligand were chosen for the docking investigations.61,62
2.6. In Silico Predicted ADMET and Drug-Likeness Properties
To ascertain their drug-likeness, the best-fitting ligands obtained by molecular docking studies were analyzed for their ADME with the help of the SwissADME tool. Among the characteristics used were lipophilicity (log P), molar solubility in water (log S), BBB permeability, skin permeation, and human gastrointestinal absorption (HIA). Along with druglike characteristics like Lipinski’s rule of five, the synthetic accessibility (SA) was also predicted using a score from 1 to 10, where 1 indicates that the synthetic route is fairly simple and 10 indicates that the chemical has a complicated structure and is difficult to synthesize. It was also used to determine the bioavailability score. Toxicities of potential inhibitors were predicted using toxicity prediction.63 To analyze the recommended compounds’ pharmacokinetic characteristics, the 2D structures of the compounds were created using ChemDraw Ultra 16.0.64 When importing each structure, the structural smile was input at the http://swissadme.ch/ Web site’s interface. SwissADME drug design online service was used to obtain the ADMET characteristics and parameters.65,66
2.7. Molecular Docking Studies
From the constructed QSAR model, the compatibility and interactions of the designed possible aurora kinase inhibitors were estimated using AutoDock version 4.2.667 against the Aurora-A protein kinase (PDB: 1MQ4). The choice of 1MQ4 was driven by its relevance to our research objectives. This structure represents aurora kinase A (Aurora-A), a protein implicated in cancer including breast cancer. Inhibiting the Aurora-A mutation is a promising therapeutic avenue. PDB 1MQ4 provides a crystallographic complex of Aurora-A with a ligand, making it a suitable template for our molecular docking and dynamic simulations. It is a well-studied system in the context of kinase inhibitors. For the current investigation, the Protein Data Bank’s (www.rcsb.org) original 3D coordinates structure of the 1MQ4 with resolution 1.90 was employed. By filling in the missing residues, we refined the basic PDB receptor structure. In order to examine the docking parameters that were discovered to be helpful for docking the proposed compounds, the cocrystallized ligand was redocked with 1MQ4.
All of the ligand structures were created using the ChemDraw Professional 16 edition, and Open Babel version 2.4.1 was used to convert the necessary file types. The Avogadro tool was used to optimize their geometries while employing the steepest descent technique with the MMFF94 force field and 10e–9 as the convergence parameter. The revised PDB file was assessed only for chain A. A pdbqt file was prepared after assigning Kollman’s unified atom charges, and polar hydrogen was added geometrically throughout the protein processing.
Ligand preparation was done by adding polar hydrogens together with the addition of Gasteiger charges. A pdbqt file was developed on recognizing the torsions in ligands, which is helpful in the conformational search of inhibitors during the process of docking. The autogrid algorithm was used to create a 3D grid to estimate the binding energies between the enzymes and the inhibitors. Precalculated grid maps were required in AutoDock in order to cover the region of the active site in the macromolecule and the size of the grid was set to 60 × 60 × 60 xyz points. The grid spacing was between 0.503 Å and the energetic map was calculated using the distance-dependent function of the dielectric constant. A grid center box with a size of x = −7.29, y = 27.37, and z = 80.08 was set to cover the binding site of the protein. The grid box includes the active binding site of the enzyme, with enough space for the ligand rotational and translational walk. Lamarckian genetic algorithm (LGA) was used as a search engine for inspecting the poses of the ligand conformation along with its orientations within the aurora kinase active site.68 The following are the details of the optimized parameters: The population size was kept at 150 people, but the maximum number of energy evaluations per run was elevated to 25,000,000. The highest generation number was 2700 together with the gene mutation rate maintained at 0.02. The remaining parameters were set by default. The group representative was chosen from each group based on the lowest binding energy configuration with the highest percentage frequency.69 The Ligplot+ v2.124 tool was used to produce and exhibit representations of ligand postures and interactions.70
Following the same protocols as those mentioned above, we conducted docking studies with the most active compound against additional Aurora-A protein kinases (PDB: 1OL7 and 2DWB). This was done to gain insight into the potential impact of protein flexibility.
2.8. Molecular Dynamics (MD) Studies
Molecular dynamics (MD) simulations were run using the “Desmond V 5.9 software” (Schrodinger 2019-3) to examine how the solvent system affected the structure of the protein–ligand complex (PLC). For the MDS of the docked complex, the optimized potentials for liquid simulations 4 (OPLS 4) force field were used (ligand 1MQ4).71 For the purpose of running dynamics simulations, the site of the complex has been center filled in an orthorhombic cubic box and transferable intermolecular potential 3P (TIP3P) water molecules and buffers have been added at a distance of 10 Å between the box edge and the protein atom. Along with counterions like Na+ and Cl– that were injected to randomly neutralize the system, the boundary condition box volume has also been estimated as per complex type.72 For comparison of simulation results, a clinically tested 2-amino thiazole substituted imidazolidinone derivative was chosen as the reference standard.
The estimated lead complex compound 1MQ4 includes 28,252 atoms with 8124 waters in addition to 458,000 Å box volume for MD simulations. The complex has more than 49998 atoms and 9209 waters. The Desmond protocol was used to minimize the solvated constructed system using the OPLS 4 force field parameters, and then relaxation was used. To hold heavy atoms on the solute in check, the system was simulated using the Berendsen NVT ensemble/canonical ensemble (constant temperature, constant volume) at a temperature of 10 K. Under the isothermal isobaric ensemble (NPT), the MDS was conducted at 300 K, 1 atom, and 200 ps of thermostat relaxation time (NPT). The Nose–Hoover thermostat and the Martyne–Tobias–Klein barostat techniques were used in conjunction with MD simulations to keep the temperature and pressure scales at 300 K and 1 atom, respectively. Every 50 ps, the simulation’s progress was meticulously documented. Following the simulation procedure, which lasts for 100 ns of production, the NPT ensemble was started. The frames have been gathered and studied using the simulation interaction diagram to investigate the trajectories, which assisted in identifying fluctuations.73,74 The Prime MM-GBSA, which computes the energy of optimized receptors in their unbound state, as well as that of free ligands and the complex formed by binding the ligand to the receptor, was calculated. Additionally, it evaluates the strain energy of the ligand by immersing it in a solvent environment generated by the VSGB 2.0 suite Further, to explore the potential key residues that contribute to ligand binding, pairwise per-residue energy decomposition was performed.
3. Results and Discussion
3.1. QSAR Model Development and Designing of Analogues
As an aurora kinase inhibitor, pharmacological data of around 54 amino thiazole derivatives were used from the literature to find aurora kinase inhibitory molecules 1–54 (Table 1). pIC50 (logIC50) was utilized as a measure of physiological activity, with IC50 values equating to the compound concentration required to inhibit 30% of the tested molecules under similar experimental conditions. The linear association between IC50 and the related descriptors was investigated using partial least squares regression (PLS) and principal component regression (PCR). MLR, on the other hand, provided the best predictive model with the fewest predictive factors and a high regression coefficient (R2) of the most important variables. Model 01 was created using MLR, with the descriptors accounting for 50% of the variation in biological activity and a standard error (SE) of 0.374.
3.1.1. Model 1
ntr = 54 npred = R2 = 0.5514, R2adj= 0.4907, R2 – R2adj = 0.0606, LOF = 0.1892, Kxx = 0.2687, DeltaK = 0.0869, RMSEtr = 0.3338, MAEtr = 0.2746, RSStr = 4.7918, CCCtr = 0.7108, s = 0.3599, F = 9.0944, Q2loo = 0.3558, R2 – Q2loo = 0.1956, RMSEcv = 0.4000, MAEcv = 0.3252, PRESScv = 6.8810, CCCcv = 0.5901, Q2LMO = 0.3103, R2Yscr = 0.1191, Q2Yscr = −0.2005, RMSEAVYscr = 0.4674, Q2Yrnd = RMSEext = 0.4015, MAEext = 0.3439, PRESSext = 1.2899, R2ext = 0.4473, Q2-F1 = 0.3327, Q2-F2 = 0.3062, Q2-F3 = 0.3509, CCCext = 0.6620, r2m aver = 0.2995, r2m delta = 0.0245.
In William’s graphic, this model produced three outliers (6, 31, and 53) with high root mean squared error (RMSE) values, and low Q2 LOO and Q2 LMO values. After deleting the outliers that were found, research is carried out to improve the model. The models that were created were reviewed, and the best model is shown below.
3.1.2. Model 2
ntr = 48 npred = R2 = 0.8902, R2adj= 0.6912, R2 – R2adj = 0.059, LOF = 0.1849, Kxx = 0.2822, DeltaK = 0.0808, RMSEtr = 0.3197, MAEtr = 0.2614, RSStr = 3.9866, CCCtr = 0.8780, s = 0.3476, F = 10.3337, Q2loo = 0.7875, R2 – Q2loo = 0.6727, RMSEcv = 0.3841, MAEcv = 0.3140, PRESScv = 5.7533, CCCcv = 0.8535, Q2LMO = 0.7624, R2Yscr = 0.1314, Q2Yscr = −0.2235, RMSEAVYscr = 0.4768, Q2Yrnd = −0.2261, RMSEext = 0.2596, MAEext = 0.2113, PRESSext = 0.9067, R2ext = 0.8734, Q2-F1 = 0.6919, Q2-F2 = 0.6835, Q2-F3 = 0.7430, CCCext = 0.8783, r2m aver = 0.6798, r2m delta = 0.0715.
Model 2 is well-fit and has good internal validation results. The external validation parameter values have fallen marginally in contrast to the previous model with no outliers in William’s plot. Table 2 displays the descriptor correlation matrix for Model 2. Figure 4 represents a scatter plot of 2-amino thiazole’s experimental vs calculated aurora kinase inhibitory activities, with anticipated values that are similar to the actual values. Figure 5 depicts the final model’s Kxy (intercorrelation among descriptors and response) versus Q2 LMO, revealing that the “leave-many-out” parameter values were close to the model parameters, showing that the model is resilient and stable. Figure 6 illustrates a Y-scramble plot of Kxy versus RYscr2 and Q2Yscr, illustrating that the final model’s correlation coefficients are significantly higher than those obtained following end-point scrambling, indicating that the structure–response relationship is broken. A William’s plot of standardized residuals versus leverage levels was used to demonstrate the forecast and convey the model’s applicability scope as shown in Figure 7. All of the compounds are in the model’s application domain (Figure 8) with leverage values smaller than the warning h* of 0.462, as shown in William’s plot (Figure 7). When the CCC parameter values are increased, the values of Q2F1, Q2F2, and Q2F3 are almost the same and of better value. All of these findings indicate that the best model discovered was not discovered by chance and that there is a link between the 2-amino thiazole structure and the aurora kinase inhibitory activity.
Figure 4.

Scatter diagram of data set compounds based on testing results of the best model equation.
Figure 5.

Visualization of data set compounds using LMO scatter plots based on experimental values from the best model equation.
Figure 6.

Layout is shown with a Y-scramble.
Figure 7.

Best model plot by William (h*, 0.462) warning value.
Figure 8.

Applicability domain plot of the best model.
The 3D-MoRSE method, which uses electron diffraction descriptors to create three-dimensional molecular representations of structure, was widely used in QSAR/QSPR investigations. They were derived from interatomic distances, scattering parameters (0–31 integer values), and weighting by atomic properties such as atomic charges (RDFC24), total surface area (PSA), MOE descriptors (EstateVSA5), and atomic polarizability (MoRSEP3), as well as Moran autocorrelation log 5 weighted by atomic polarizabilities (MATSP5). Weighting descriptors can be used to make compounds more sensitive to the presence of specific molecular fragments. In other words, the distance between atoms with a high or low electron density can be reflected by weighting the atomic partial charges.75
The 3D-MoRSE descriptors weighted with schemes, where the hydrogen’s involvement is reduced, should show less variance as the scattering parameters increase. According to the literature, atomic mass, van der Waals volume, and polarizability weightings have the lowest relative variation in comparison. The dynamics of the cumulative sum of 3D-MoRSE terms arranged by interatomic distance can reveal the effect of various interatomic distances. As 3D-MoRSE descriptor values rise, atomic groups that contribute to the 3D-MoRSE descriptor are more likely to be active than those that do not. Finding the best interatomic distance in active compounds and comparing it to nonactive compounds might help in interpreting 3D-MoRSE descriptors by working out the ideal range of MoRSE values required for the best activity.76 All of the descriptors in model 2 were found to have a positive correlation with activity. Table 3 provides the pIC50 values for all compounds using the final model.
Table 3. Best Model Equation Predicted PIC50 Values of the Original Data Set.
| compound | Exp.PIC50 | EstateVSA5 | PSA | MoRSEP3 | MATSp5 | RDFC24 | pred.PIC50 | residuals |
|---|---|---|---|---|---|---|---|---|
| 1 | 5.9600 | 18.33 | 75.226 | –0.322 | 0.277 | 0 | 5.9359 | –0.0241 |
| 2 | 6.4000 | 18.33 | 73.244 | –0.324 | 0.192 | 0 | 5.8130 | –0.5870 |
| 3 | 6.3000 | 29.666 | 167.031 | –0.288 | 0.051 | 0 | 6.2479 | –0.0521 |
| 4 | 5.9600 | 17.534 | 72.682 | –0.343 | –0.041 | 0 | 5.4735 | –0.4865 |
| 5 | 5.5200 | 17.534 | 73.499 | –0.016 | –0.121 | 0 | 5.6200 | 0.1000 |
| 6 | 5.5400 | 17.534 | 71.044 | 0.404 | –0.256 | 0 | 5.7503 | 0.2103 |
| 7 | 5.5500 | 17.534 | 74.003 | –0.075 | –0.019 | 0 | 5.7126 | 0.1626 |
| 8 | 5.6200 | 6.197 | 69.409 | –0.002 | 0.001 | 0 | 5.5840 | –0.0360 |
| 9 | 5.6800 | 18.33 | 73.881 | –0.521 | –0.005 | 0 | 5.4042 | –0.2758 |
| 10 | 6.2900 | 30.462 | 128.381 | –0.177 | 0.168 | 0 | 6.3348 | 0.0448 |
| 11 | 5.7700 | 24.643 | 76.71 | –0.269 | 0.165 | 0 | 5.9404 | 0.1704 |
| 12 | 4.7600 | 6.197 | 88.322 | –0.304 | 0.004 | –0.01 | 5.3133 | 0.5533 |
| 13 | 5.8500 | 17.534 | 72.253 | –0.203 | 0.126 | 0.064 | ||
| 14 | 6.0500 | 29.927 | 73.663 | –0.321 | 0.116 | 0.003 | 5.9494 | –0.1006 |
| 15 | 5.7700 | 25.253 | 128.914 | 0.054 | –0.001 | 0 | 6.2011 | 0.4311 |
| 16 | 4.8900 | 18.33 | 175.353 | –0.137 | 0.094 | 0 | ||
| 17 | 6.2200 | 18.33 | 49.583 | –0.559 | –0.041 | 0.048 | 5.8275 | –0.3925 |
| 18 | 5.0400 | 18.33 | 136.857 | –1.08 | 0.069 | 0.027 | 5.6876 | 0.6476 |
| 19 | 6.4400 | 6.197 | 160.82 | 0.072 | 0.086 | –0.011 | 6.0080 | –0.4320 |
| 20 | 5.2400 | 6.197 | 129.757 | –0.154 | –0.001 | 0 | 5.7252 | 0.4852 |
| 21 | 7.1000 | 30.462 | 176.895 | 0.082 | 0.004 | 0 | 6.5234 | –0.5766 |
| 22 | 6.8500 | 25.377 | 152.038 | –0.492 | 0.003 | 0.039 | 6.3832 | –0.4668 |
| 23 | 5.8300 | 18.33 | 175.499 | –0.261 | 0.135 | 0 | 6.2254 | 0.3954 |
| 24 | 7.0100 | 25.439 | 156.211 | –0.223 | 0.136 | 0.038 | 6.7711 | –0.2389 |
| 25 | 6.4800 | 25.439 | 165.292 | –0.213 | 0.131 | 0 | 6.3325 | –0.1475 |
| 26 | 6.0100 | 37.387 | 118.848 | –0.966 | 0.126 | 0.047 | 6.3455 | 0.3355 |
| 27 | 5.2800 | 18.33 | 127.956 | –1.166 | 0.102 | 0.023 | 5.5771 | 0.2971 |
| 28 | 5.3400 | 6.197 | 143.284 | –0.893 | 0.091 | –0.06 | ||
| 29 | 5.6400 | 6.197 | 153.323 | –1.156 | 0.065 | 0.005 | 5.2137 | –0.4263 |
| 30 | 5.2700 | 6.197 | 135.38 | –1.583 | 0.091 | 0.029 | 5.1479 | –0.1221 |
| 31 | 5.0300 | 18.33 | 85.251 | –0.32 | 0.002 | 0 | ||
| 32 | 5.9600 | 17.534 | 74.812 | –0.439 | –0.037 | 0 | 5.4148 | –0.5452 |
| 33 | 5.0000 | 12.263 | 74.823 | –0.565 | 0.222 | 0 | 5.5738 | 0.5738 |
| 34 | 6.0500 | 24.643 | 95.883 | –0.042 | –0.001 | 0 | 5.9756 | –0.0744 |
| 35 | 6.3000 | 29.296 | 126.173 | –0.124 | –0.028 | 0.014 | 6.2623 | –0.0377 |
| 36 | 5.8200 | 18.33 | 72.711 | –0.425 | 0.119 | 0 | 5.6369 | –0.1831 |
| 37 | 5.6500 | 6.197 | 126.389 | –0.664 | 0.135 | 0.006 | 5.5782 | –0.0718 |
| 38 | 6.3600 | 30.462 | 181.175 | –0.175 | 0.219 | 0 | 6.6312 | 0.2712 |
| 39 | 5.9100 | 18.33 | 165.328 | –1.019 | 0.12 | 0 | 5.5842 | –0.3258 |
| 40 | 6.1300 | 25.377 | 151.58 | –0.68 | 0.196 | 0 | 6.0029 | –0.1271 |
| 41 | 5.2600 | 24.396 | 61.311 | –0.302 | –0.127 | 0 | 5.4573 | 0.1973 |
| 42 | 5.5200 | 17.534 | 57.506 | –0.099 | –0.044 | 0 | 5.5901 | 0.0701 |
| 43 | 5.5700 | 24.643 | 72.97 | –0.324 | –0.105 | 0 | 5.5241 | –0.0459 |
| 44 | 5.7000 | 12.394 | 69.415 | –0.208 | –0.006 | 0 | 5.5222 | –0.1778 |
| 45 | 5.6000 | 6.197 | 71.087 | –0.375 | 0.169 | 0 | 5.5299 | –0.0701 |
| 46 | 5.8500 | 6.197 | 95.535 | –0.012 | 0.033 | –0.002 | 5.7061 | –0.1439 |
| 47 | 6.0600 | 13.245 | 142.869 | –0.058 | 0.196 | 0 | 6.2350 | 0.1750 |
| 48 | 5.4200 | 6.197 | 87.023 | –0.601 | 0.047 | –0.004 | 5.2140 | –0.2060 |
| 49 | 5.3600 | 6.197 | 91.502 | –1.917 | 0.028 | 0.013 | ||
| 50 | 5.2700 | 6.197 | 109.65 | –0.254 | –0.024 | –0.006 | 5.4564 | 0.1864 |
| 51 | 5.2600 | 18.33 | 115.608 | –1.107 | 0.003 | 0 | 5.1479 | –0.1121 |
| 52 | 5.3000 | 17.534 | 62.947 | –0.389 | –0.017 | 0 | 5.4284 | 0.1284 |
| 53 | 5.4400 | 18.33 | 41.772 | –0.891 | –0.041 | 0.026 | 5.2638 | –0.1762 |
| 54 | 5.1100 | 29.927 | 95.3 | –0.254 | –0.013 | 0 |
3.2. Aurora Kinase Inhibitory Activity of the Designed Compounds
Based on the best model 2, we have designed six series of the 2-amino thiazole derivatives. The general structures of the designed compounds (1a–1e, 2a–2e, 3a–3e, 4a–4e, 5a–5e, 6a–6e) containing a thiazole core substituted with a 4-bromophenyl at position 5 and a wide range of substituents (imidazolidones/pyrimidines/alkyl chains/amides/urea derivatives/hydrazones) at position 2 are represented in Figure 9 and Table 4, respectively. Further, the best model descriptors and predicted Pki values for the newly designed compounds are summarized in Table 5. From the results shown in Table 5, it is clearly evident that the 2,4-disubstituted thiazole ring is critical for activity. Among the six series of compounds, the compounds of series 1a–1e had shown promising Pki values, representing that the incorporation of the substituted imidazolidone ring is useful for enhancing inhibitory activity. Additionally, within the five compounds 1a–1e, the molecule 1a bearing 2-(4-(2-hydroxybenzylidene)-5-oxo-2-phenyl-4,5-dihydro-1H-imidazole-1-carbothioamido)acetamide showed the highest activity with a predicted Pki value of 8.73. Further, it was observed that the designed compounds 2a, 3e, 4d, 5d, and 6d of the other four series of compounds had elicited greater activity within their series with Pki values of 6.34, 6.42, 7.08, 6.54, and 7.11, respectively. The results indicate that the further optimization of compounds that displayed lower Pki values may improve the activity.
Figure 9.

General structures of the designed six series of compounds (1a–1e, 2a–2e, 3a–3e, 4a–4e, 5a–5e, and 6a–6e).
Table 4. Substituents Present on the Amino Group of 2-Amino Thiazole Scaffold 1a–1e, 2a–2e, 3a–3e, 4a–4e, 5a–5e, and 6a–6e.

Table 5. Best Model Descriptors and Predicted Pki Values for the Newly Designed Compounds.
| compound code | EstateVSA5 | PSA | MoRSEP3 | MATSp5 | RDFC24 | pred. Pki |
|---|---|---|---|---|---|---|
| 1a | 11.577 | 191.305 | –0.959 | –0.107 | 0.271 | 8.73 |
| 1b | 41.909 | 228.781 | –0.541 | –0.156 | 0.173 | 8.42 |
| 1c | 23.719 | 197.641 | –2.147 | –0.146 | 0.255 | 7.81 |
| 1d | 30.829 | 189.502 | –0.821 | –0.146 | 0.156 | 7.65 |
| 1e | 35.842 | 290.959 | –1.03 | –0.117 | 0.099 | 7.34 |
| 2a | 11.337 | 90.097 | 0.003 | 0.301 | 0.015 | 6.34 |
| 2b | 11.337 | 94.009 | 0.134 | 0.275 | 0 | 6.24 |
| 2c | 11.337 | 63.055 | –0.251 | 0.237 | –0.002 | 5.74 |
| 2d | 11.337 | 81.175 | 0.069 | 0.231 | –0.025 | 5.76 |
| 2e | 11.337 | 92.057 | 0.026 | 0.101 | –0.033 | 5.50 |
| 3a | 6.197 | 44.153 | –0.379 | 0.435 | 0 | 5.76 |
| 3b | 11.337 | 53.826 | –0.191 | 0.298 | 0 | 5.84 |
| 3c | 24.406 | 135.721 | –0.49 | 0.143 | –0.001 | 5.97 |
| 3d | 12.273 | 134.953 | –0.418 | 0.13 | 0.002 | 5.84 |
| 3e | 24.406 | 135.976 | –0.57 | 0.133 | 0.04 | 6.42 |
| 4a | 6.197 | 130.929 | –0.004 | 0.33 | 0 | 6.28 |
| 4b | 6.197 | 92.519 | 0.025 | 0.295 | 0.013 | 6.25 |
| 4c | 6.197 | 93.465 | –0.088 | 0.307 | 0.055 | 6.72 |
| 4d | 0 | 87.917 | 0.204 | 0.424 | 0.064 | 7.08 |
| 4e | 6.197 | 90.437 | –0.757 | 0.162 | 0.04 | 5.81 |
| 5a | 13.245 | 149.448 | –0.304 | 0.284 | 0 | 6.19 |
| 5b | 24.396 | 117.249 | 0.152 | 0.208 | –0.009 | 6.37 |
| 5c | 6.197 | 109.85 | –0.087 | 0.247 | –0.029 | 5.65 |
| 5d | 6.197 | 171.601 | –0.088 | 0.484 | –0.004 | 6.54 |
| 5e | 6.197 | 173.488 | –1.031 | 0.479 | 0.048 | 6.48 |
| 6a | 19.056 | 175.045 | 1.078 | 0.029 | –0.051 | 6.47 |
| 6b | 31.189 | 171.794 | 0.973 | 0.093 | –0.036 | 6.85 |
| 6c | 25.123 | 165.735 | 0.91 | 0.004 | –0.126 | 5.42 |
| 6d | 38.113 | 158.026 | 1.48 | 0.099 | –0.051 | 7.11 |
| 6e | 25.98 | 174.477 | 0.469 | 0.032 | –0.059 | 6.02 |
3.3. In Silico Predicted ADMET Properties
It was found that several physical and chemical properties of these newly designed compounds were revealed by these in silico predicted ADME results (Table 6). These include the five principles of molecular synthesis (iLOGP), as well as other parameters/properties, nAH (no. of aromatic heavy atoms), MW (molecular weight), RB (rotatable bonds), number of HBD (hydrogen bond donor), HBA (hydrogen bond acceptor), iLOGP (octanol/water partition coefficient), MR (molecular refractivity), and TPSA (topological polar surface area). As demonstrated in Table 6, all of the designed compounds do not produce more than one violation of Lipinski’s rule of five and the concept of drug-likeness qualities (Table S1). There is one exception to the allowable range: compound 6c has an MR value that is beyond the acceptable range for all of the other parameters.
Table 6. In Silico Predicted ADME Properties of the Designed Compounds.
| compounds | M.W. | iLOGP | HBD | HBA | TPSA | RB | n.AH | M.R |
|---|---|---|---|---|---|---|---|---|
| 1a | 618.52 | 4.00 | 3 | 5 | 167.25 | 9 | 23 | 167.41 |
| 1b | 647.52 | 3.70 | 2 | 6 | 192.84 | 10 | 23 | 174.21 |
| 1c | 668.58 | 3.41 | 3 | 5 | 167.52 | 9 | 23 | 184.92 |
| 1d | 632.55 | 4.35 | 2 | 5 | 156.25 | 10 | 23 | 171.88 |
| 1e | 650.52 | 3.29 | 5 | 7 | 207.71 | 9 | 23 | 171.46 |
| 2a | 361.26 | 2.88 | 1 | 3 | 78.94 | 3 | 17 | 90.32 |
| 2b | 375.29 | 3.13 | 1 | 3 | 78.94 | 4 | 17 | 95.12 |
| 2c | 423.33 | 3.43 | 1 | 3 | 78.94 | 4 | 23 | 110.19 |
| 2d | 437.36 | 3.74 | 1 | 3 | 78.94 | 4 | 23 | 115.75 |
| 2e | 447.35 | 3.34 | 2 | 5 | 105.65 | 4 | 17 | 117.53 |
| 3a | 289.58 | 2.44 | 1 | 1 | 53.16 | 2 | 11 | 64.54 |
| 3b | 334.03 | 2.54 | 1 | 1 | 53.16 | 2 | 11 | 67.62 |
| 3c | 486.77 | 3.54 | 2 | 4 | 106.41 | 4 | 17 | 117.43 |
| 3d | 531.22 | 3.66 | 2 | 4 | 106.41 | 4 | 17 | 120.12 |
| 3e | 565.66 | 3.77 | 2 | 4 | 106.41 | 4 | 17 | 125.13 |
| 4a | 297.17 | 2.00 | 1 | 2 | 70.23 | 3 | 11 | 69.56 |
| 4b | 345.64 | 2.41 | 1 | 2 | 70.23 | 5 | 11 | 79.17 |
| 4c | 457.39 | 3.36 | 2 | 3 | 85.50 | 6 | 17 | 125.41 |
| 4d | 409.34 | 3.45 | 2 | 4 | 85.50 | 7 | 11 | 109.82 |
| 4e | 381.29 | 2.19 | 2 | 4 | 85.50 | 5 | 11 | 100.20 |
| 5a | 312.19 | 1.86 | 2 | 2 | 82.26 | 4 | 11 | 72.25 |
| 5b | 443.15 | 3.32 | 2 | 2 | 82.26 | 5 | 17 | 103.99 |
| 5c | 374.25 | 2.89 | 2 | 2 | 82.26 | 5 | 17 | 93.97 |
| 5d | 409.30 | 2.20 | 2 | 3 | 116.56 | 5 | 11 | 101.59 |
| 5e | 438.24 | 2.32 | 2 | 4 | 119.80 | 6 | 11 | 109.29 |
| 6a | 561.25 | 3.65 | 1 | 5 | 112.80 | 5 | 21 | 131.47 |
| 6b | 516.79 | 3.52 | 1 | 5 | 112.80 | 5 | 21 | 128.78 |
| 6c | 595.69 | 3.73 | 1 | 5 | 112.80 | 5 | 21 | 136.48 |
| 6d | 530.82 | 3.88 | 1 | 5 | 112.80 | 6 | 21 | 133.59 |
| 6e | 575.27 | 4.17 | 1 | 5 | 112.80 | 6 | 21 | 136.28 |
The predicted toxicity profiles including mutagenicity, tumorigenicity, irritancy, and reproductive toxicity of the designed compounds are summarized in Figure 10. The results indicated that the compounds have no toxicity and hence they are suitable for further research.
Figure 10.

Predicted toxicity profile of the designed compounds.
3.4. Molecular Docking Studies
This study used the Chemopy server to derive molecular descriptors of energy-optimized compounds based on SAR studies, experiments, and projected bioactivities of the data set substances (Table 6). The results of this study were used to determine Pki values by using the model equation. Molecular docking investigations were also carried out on molecules with higher Pki values (Table 7). In the case of the redocked ligand from 1MQ4, the cocrystal ligand showed an outstanding docking score of −9.688 kcal/mol–1. The amino acid residue LYS 143 (distance 2.63), GLN 177 (distance 2.70), GLU 181 (distance 3.17), LYS 258 (distance 2.65), ASP 274(distance 1.99), and LEU 289 (distance 2.20) of protein was identified to form a hydrogen-bond interaction. It was also involved in the pi–π bond interaction with the phenyl ring PHE 144 (distance 3.66). These interactions resulted in a significant docking score by enhancing the cocrystallized ligand’s stability in the target protein’s active site domain (Figure 11). According to the QSAR training selected references compounds 3, 19, 21, and 38 hydrogen-bond interactions LEU 139, ALA 213, ARG 137 and ARG 220. Reference compound 47 showed an outstanding docking score of −8.95 kcal/mol the amino residues GLN 77 and LYS 258 of protein was identified to form a hydrogen bonds interaction. In compound 1a, −9.67 kcal/mol hydrogen-bond interactions with LYS 143 (distance 1.96), LYS 162 (distance 2.27), and ASN 261 (distance 2.48) were observed in addition to interactions with amino thiazole involved in pi-sulfur ASP 274 (distance 2.01).
Table 7. Amino Acid Interactions and Docking Scores Exhibited by the Cocrystal Ligand and Significantly Scored Compoundsa.
| compound code | amino acid involved in the interactions | type of bond | distance (Å) | HB strength | docked score (kcal/mol) |
|---|---|---|---|---|---|
| cocrystal ligand | LYS 143 | HB | 2.63 | strong | –9.68 |
| PHE 144 | π–π bond | 3.66 | |||
| GLN 177 | HB | 2.70 | strong | ||
| GLU 181 | HB | 3.17 | weak | ||
| LYS 258 | HB | 2.65 | strong | ||
| ASP 274 | HB | 1.99 | strong | ||
| LEU 289 | HB | 2.20 | strong | ||
| 3 | ALA 213 | HB | 2.97 | strong | –6.40 |
| ARG 139 | HB | 3.31 | weak | ||
| ARG 220 | HB | 2.71 | strong | ||
| 19 | ALA 213 | HB | 3.01 | strong | –6.64 |
| ARG 220 | HB | 2.93 | strong | ||
| 21 | LEU 139 | HB | 2.94 | strong | –6.37 |
| ALA 213 | HB | 3.00 | strong | ||
| 38 | LEU 139 | HB | 3.03 | strong | –6.60 |
| ALA 213 | HB | 2.94 | strong | ||
| ARG 220 | HB | 3.17 | weak | ||
| 47 | GLN 77 | HB | 3.24 | weak | –8.95 |
| LYS 258 | HB | 2.29 | strong | ||
| 1a | LYS 143 | HB | 1.96 | strong | –9.67 |
| LYS 162 | HB | 2.27 | strong | ||
| ASN 261 | HB | 2.48 | strong | ||
| ASP 274 | HB | 2.01 | strong | ||
| 2a | ALA 213 | HB | 3.28 | weak | –8.39 |
| GLY 216 | π–π bond | 3.44 | weak | ||
| ASN 261 | halogen bond | 2.67 | |||
| 3e | LYS 143 | HB | 2.69 | strong | –8.71 |
| LYS 162 | HB | 3.04 | strong | ||
| GLU 260 | halogen bond | 2.95 | |||
| 4d | LYS 143 | HB | 3.65 | weak | –7.97 |
| LYS 162 | HB | 3.92 | weak | ||
| GLN 177 | HB | 3.84 | weak | ||
| GLU 181 | HB | 3.26 | weak | ||
| ASP 274 | HB | 2.90 | strong | ||
| 5d | LYS 162 | HB | 2.60 | strong | –7.99 |
| GLU 260 | HB | 2.88 | strong | ||
| 6d | LYS 162 | HB | 2.82 | strong | –8.91 |
| ASN 261 | HB | 2.89 | strong |
HB = hydrogen bond.
Figure 11.

2D docked pose interactions of the cocrystal ligand at the active site of the target protein (PDB: 1MQ4).
In the active site of aurora kinase, all of the designed compounds interacted well. Consequently, compound 2a, which encompasses the 2-amino thiazole core, hydrophobic and hydrophilic areas, and the outside, ALA 213 (distance 3.28) of protein was identified as the hydrogen bond, GLY 216 (distance 3.44), pi–π bond in the phenyl ring, and ASN 261 (distance 2.61) were identified as the halogen bond resulting in higher stability in the active site. Compound 3e, the hydrophilic, and hydrophobic portions of the allosteric site have been shown to interact. Compound 3e interacted well with LYS 143 (distance 2.69), LYS 162 (distance 3.04) in H-bond in addition, and amino thiazole alkyl derivative GLU 260 (distance 2.95) in Halogen bond. Compound 4d amino thiazole amide derivative engaged with LYS 143 (distance 3.65), LYS 162 (distance 3.92), GLN 177 (distance 3.84), GLU 181 (distance 3.26), and ASP 274 (distance 2.90) hydrogen bonded to the amide nitrogen of compound 4d. Compound 5d urea derivatives interacted with hydrogen bonds LYS 162 (distance 2.60) and GLU 260 (distance 2.88). Compound 6d hydrazone derivatives interacted with LYS 162 (distance 2.82) and GLU 260 (distance 2.89) and hydrogen bonded to the oxo group. It was observed that the same amino acid LYS 143 was found to be involved in the hydrogen-bond contact with compounds 1a, 3e, and 4d. The findings were positive, emphasizing the usefulness of model equation descriptors in the QSAR research. Ligplot+ docking interactions of proposed compounds with 1MQ4 are shown in Figures 12 and 13, respectively.
Figure 12.

2D docked pose interactions of the reference compounds 3, 19, 21, 38, and 47 at the active site of the target protein (PDB: 1MQ4).
Figure 13.

2D docked pose interactions of the designed compounds 1a, 2a, 3e, 4d, 5d, and 6d at the active site of the target protein (PDB: 1MQ4).
The most active ligands (1a, 2a, 3a, 4d, 5d, and 6d) identified in the molecular docking studies against 1MQ4 were also docked against two other PDBs of aurora kinase A, i.e., 1OL7 and 2DWB. In Figures 14 and 15, we have displayed the docking poses, whereas in Tables 8 and 9, we summarized the type of interactions and the docking score details for all of the above six compounds against 1OL7 and 2DWB. Among the six molecules, ligand 1a showed the highest docking score of −9.30 kcal/mol, and it formed hydrogen-bond interactions with the amino acid residues LYS 162 (distance 2.67), GLU 260 (distance 2.55), and ASN 261 (distance 2.16) of protein-1OL7. The other five ligands made fewer interactions with 1OL7 and hence had a docking score of less than 1a. In a similar way, among the six molecules docked against 2DWB, again, ligand 1a displayed a good docking score of −8.80 kcal/mol through hydrogen-bond interactions with the amino acid residues LYS 143 (distance 3.00), GLU 260 (distance 2.74), and ASP 274 (distance 2.85) of protein. This data suggests that 1a is the most promising compound that may be useful as an anticancer agent through the inhibition of the aurora kinase A enzyme.
Figure 14.

2D docked pose interactions of the designed compounds 1a, 2a, 3e, 4d, 5d, and 6d at the active site of the target protein (PDB: 1OL7).
Figure 15.

2D docked pose interactions of the designed compounds 1a, 2a, 3e, 4d, 5d, and 6d at the active site of the target protein (PDB: 2DWB).
Table 8. Amino Acid Interactions and Docking Scores Exhibited by Ligands 1a, 2a, 3e, 4d, 5d, and 6d against PDB 1OL7a.
| compound code | amino acid involved in the interactions | type of bond | distance (Å) | HB strength | docked score (kcal/mol) |
|---|---|---|---|---|---|
| 1a | LYS 162 | HB | 2.67 | strong | –9.30 |
| GLU 260 | HB | 2.55 | strong | ||
| ASN 261 | HB | 2.16 | strong | ||
| 2a | ALA 213 | HB | 2.74 | weak | –8.09 |
| ASN 261 | halogen bond | 3.46 | |||
| 3e | LYS 143 | HB | 2.20 | strong | –8.60 |
| LYS 162 | HB | 3.49 | strong | ||
| ASP 274 | HB | 3.13 | strong | ||
| 4d | LYS 143 | HB | 2.24 | strong | –8.07 |
| LYS 162 | HB | 3.39 | weak | ||
| ASP 274 | HB | 3.13 | weak | ||
| 5d | LYS 143 | HB | 2.47 | strong | –7.62 |
| LYS 162 | HB | 2.25 | strong | ||
| 6d | ASP 256 | HB | 2.64 | strong | –7.91 |
| ASN 261 | HB | 3.30 | weak |
HB = hydrogen bond.
Table 9. Amino Acid Interactions and Docking Scores Exhibited by Ligands 1a, 2a, 3e, 4d, 5d, and 6d against PDB 2DWBa.
| compound code | amino acid involved in the interactions | type of bond | distance (Å) | HB strength | docked score (kcal/mol) |
|---|---|---|---|---|---|
| 1a | LYS 143 | HB | 3.00 | strong | –8.80 |
| GLU 260 | HB | 2.74 | strong | ||
| ASP 274 | HB | 2.85 | strong | ||
| 2a | ARG 137 | HB | 2.13 | strong | –8.06 |
| ALA 213 | halogen bond | 2.03 | |||
| 3e | GLU 211 | HB | 2.53 | strong | –7.71 |
| ALA 213 | HB | 2.88 | strong | ||
| GLY 216 | HB | 3.02 | strong | ||
| 4d | LYS 162 | HB | 2.20 | strong | –7.13 |
| GLU 260 | HB | 3.01 | strong | ||
| ASP 274 | HB | 3.22 | weak | ||
| 5d | LYS 162 | HB | 2.25 | strong | –7.84 |
| ASP 274 | HB | 3.34 | weak | ||
| 6d | LYS 141 | HB | 2.37 | strong | –7.88 |
| LYS 162 | HB | 2.90 | strong |
HB = hydrogen bond.
3.5. Molecular Dynamics (MD) Study
MD studies of the significantly docked score compound (1a) were carried out in order to assess the stability of the complex for 100 ns. According to the trajectory analysis, the root mean square deviation (RMSD) value for the backbone of the protein aurora kinase climbed to 1.3932 Å during the first 2 ns before declining to 1.2073 Å at the time scale of 38.4 ns (Figure 16a). From the figure, it is evident that the selected compound showed reasonable RMSD as compared with the known compounds 3, 19, 21, 38, and 47. The average RMSD scores of the AURKA backbone atoms were 1.55 Å and 1.9441 Å for heavy atoms. Root mean square oscillation (RMSO) detailing offered a steady conformation of roughly 1.45 Å, which served as a foundation for further exploration. The root mean square fluctuation (RMSF) records changes to the protein chain that were distinct from the simulation’s development illustrate the RMSF value of catalytic domain residues with protein backbone amino acids, with considerable changes at the C- and N-terminal in comparison to other regions of aurora kinase (Figure 16b). This coincides with the fluctuations of AURKA upon binding with known compounds 3, 19, 21, 38, and 47.
Figure 16.


(a) Root mean square deviation (RMSD) graph of the compounds during MD simulation. (b) Root mean square fluctuation (RMSF) graph of the compounds during MD simulation. (c) Vital amino acid interactions during the MD simulation of compound 1a. (d) Percentage of amino acid interactions during the MD simulation of compound 1a. (e) Percentage protein secondary structure element (SSE) graph during MD simulation. (f) Radius of the gyration graph during MD simulation. (g) Pairwise per-residue energy decomposition analysis of AURKA upon ligand binding. Residues with the least energy in Cd_1a are shown in red, whereas the same in other complexes are marked in blue.
Water-bridge, hydrogen-bonding, and hydrophobic interactions at stable areas LEU 139, LYS 141, LYS 143, PHE 144, GLY 145, VAL 147, LYS 162, LEU 164, GLU 260, and ASP 274 were found in dynamics simulations of compound 1a (Figure 16c). During the dynamic simulation studies, amino acids LYS 141 and LYS 162 showed H-bonding as well as ionic contacts; residue LYS 162 exhibited hydrophobic/ionic interaction, while LYS 141 displayed hydrophobic/water-bridge interaction (Figure 16d). The aforementioned amino acids were critical for the stability of compound 1a inside the binding cavity and played a major role in the active site binding pocket. Throughout the molecular dynamics simulation studies, compound 1a was identified as having the highest frequency of hydrogen bonding. For 89% of the simulation time, LYS 162 interacting with oxygen resulted in stable active conformation of the molecule compound 1a inside the active site of the target protein. During 31% of the MD simulation time, H-bond networks were shown to be important at the hydroxy residue of LYS 141 engaged with the imidazolidinone ring via aromatic substituted aldehyde conserved water molecule. During 59% of the MD simulation time, the nitrogen of residue LYS 162 interacts with the thiazole ring via a conserved water molecule (Figure 16e).
MD studies of the significantly docked score compounds 3, 19, 21, 38, and 47 were carried out in order to assess the stability of the complex for 100 ns. According to the trajectory analysis, the root mean square deviation (RMSD) value for the backbone of the protein aurora kinase. Water-bridge, hydrogen-bonding, and hydrophobic interactions at stable areas. Compounds 3, 19, 21, 38, and 47 showed a steady gyration radius (Rg) with an average value of 6.25 Å after 100 ns MD simulation. A high solvent-accessible surface area. The secondary structural features and the interaction diagrams of the known compounds 3, 19, 21, 38, and 47 during simulation are shown in Figures S1–S10.
Compound 1a showed a steady gyration radius (Rg) with an average value of 6.25 Å after a 100 ns MD simulation. A high solvent-accessible surface area of 100.67–390.902 Å, a low PSA (polar surface area) of 135.211–120.86 Å, and a low MolSA (molecular surface area) of 500.159–495.451 Å and one Intra HB (intramolecular hydrogen bond) were also found in compound 1a, which helped to ensure its stability throughout a 100 ns MD simulation (Figure 16f).
3.6. Estimation of Binding Free Energy
The bound complexes identified by molecular docking and MDS were further explored by performing MM-GBSA binding free energy calculations, which are the sum of gas-phase energy, solvation free energy, and entropic contributions averaged over several snapshots of the MD trajectory. The key contributors for binding namely H-bonding, lipophilic interactions, electrostatic interactions, and van der Waals energy were also estimated from the trajectories obtained during MDS and are depicted in Table 10. The lower the binding energy, the better the binding of the protein and ligand. All of the compounds except Cd_19 showed less binding energy. The net binding energy (ΔG) of the compounds are −88.51, −51.64, −84.47, −89.69, and −6.81 kcal/mol for molecules Cd_1a, Cd_3, Cd_19, Cd_21, Cd_38, and Cd_47, respectively (Table 10). The lipophilic and van der Waals terms also favored the binding of all of the complexes.
Table 10. Calculated Binding Free Energy of the Identified Compounds with AURKAa.
| compound | ΔGBIND (kcal/mol) | ΔGCOLOUMB (kcal/mol) | ΔGLIPO (kcal/mol) | ΔGVDW (kcal/mol) | ΔGSOLV GB (kcal/mol) |
|---|---|---|---|---|---|
| Cd_1a | –88.51 | –32.30 | –37.73 | –70.10 | 43.62 |
| ref Cd_3 | –46.32 | –44.25 | –30.12 | –55.33 | 20.63 |
| ref Cd_19 | –6.815 | –6.703 | –34.08 | –42.91 | 21.18 |
| ref Cd_21 | –51.64 | –26.06 | –30.71 | –41.97 | 46.25 |
| ref Cd_38 | –84.471 | –86.013 | –34.202 | –30.94 | 73.17 |
| ref Cd_47 | –89.69 | –9.52 | –43.98 | –75.91 | 31.32 |
ΔGbind is the total binding energy; ΔGcoloumb is the Coulombic energy; ΔGlipo is the lipophilic energy; ΔGvdw is the van der Waals energy; ΔGSolv GB is the generalized Born electrostatic solvation energy.
As shown in Table 10, the reference compound 47 showed the least relative binding affinity of −89.69 kcal/mol. However, target compound 1a showed a more similar binding affinity of −88.51 kcal/mol. In Figure 16g, the essential residues involved in ligand binding, which contribute to the lowest binding energy, are depicted. Notably, residues such as Lys 156, Leu 159, Lys 162, Val 174, Ser 186, Arg 189, Tyr 212, Arg 220, Leu 264, and Leu 289 play crucial roles in facilitating ligand binding (Figure 16g).
4. Conclusions
The QSAR analysis of fifty-four 2-amino thiazole data set compounds resulted in the best model 2. The resulting model was very reliable, consistent, and predictive. The establishment of a good statistical model has opened up a new avenue for studying descriptors in the suppression of aurora kinase. Internally and externally, software statistical parameters were used to validate the model in order to predict the bioactivity. The model obtained was well-validated and predictive with good statistical values R2 = 0.8902, CCCtr = 0.7580, Q2 LOO = 0.7875, Q2LMO = 0.7624, CCCcv = 0.7535, Rext2 = 0.8735, and CCCext = 0.8783. The applicability domain (AD) model was well-defined, and the test set molecules were well predicted and the entire molecules within the model AD. Molecular descriptors EstateVSA5, PSA, MoRSEP3, MATSp5, and RDFC24 influenced the anticancer potential of the studied molecules. Through the ADMET prediction, it was observed that all of the designed compounds possess drug-likeness properties except compound 6c. The molecular docking studies on the best-predicted active compounds 1a, 2a, 3e, 4d, 5d, and 6d revealed that compound 1a had the highest docking score of −9.67. Molecular dynamics simulations were also performed using 100 ns to clarify the stability, conformation, and intermolecular interactions of compound 1a compared to known compounds 3, 19, 21, 38, and 47, resulting in satisfactory findings, and it was found that the target compound 1a showed a much closer binding affinity of −88.51 kcal/mol. All these results indicated that compound 1a is a promising lead candidate; hence, it emerged as a compound for further synthesis and bioactivity testing against breast cancer.
Acknowledgments
The authors are grateful to the management of the SRM College of Pharmacy for their consistent support and encouragement. They thank Dr. Paolo Gramatica, QSAR Research Unit, Insubria University, Italy, for the academic licensing software. A.B.S. would like to acknowledge St. Mary’s College of Pharmacy and St. Mary’s Group of Institutions, Guntur, Andhra Pradesh, India, for their support. R.R.B. would like to thank the Deanship of Graduate Studies and Research, Ajman University, UAE, for their support in providing assistance in the article processing charges of this manuscript.
Data Availability Statement
All data sets collected and analyzed during this study are available within the manuscript and in the Supporting Information.
Supporting Information Available
The Supporting Information is available free of charge at https://pubs.acs.org/doi/10.1021/acsomega.3c07003.
Table S1: Drug-likeness properties of designed compounds. Figure S1: Protein–ligand interaction histogram of compound 19. Figure S2: Protein–ligand interaction histogram of compound 21. Figure S3: Protein–ligand interaction histogram of compound 38. Figure S4: Protein–ligand interaction histogram of 47. Figure S5: Protein–ligand contacts of compounds 19 and 20. Figure S6: Protein–ligand contacts of compounds 38 and 47. Figure S7: Percentage protein secondary structure elements (SSE) graph of 19 during MD simulation. Figure S8: Percentage protein secondary structure element (SSE) graph of 21 during MD simulation. Figure S9: Percentage protein secondary structure element (SSE) graph of 38 during MD simulation. Figure S10: Percentage protein secondary structure element (SSE) graph of 47 during MD simulation (PDF)
Author Contributions
S.B. and B.M. were responsible for conceptualization, methodology, resources, investigation, software, data curation, formal analysis, writing the original draft, and visualization. S.B., I.K., M.S., and B.M. performed the conceptualization, methodology, and validation. I.K., A.B.S., and R.R.B. wrote, reviewed, and edited the manuscript and supervised and administered the study.
The authors declare no competing financial interest.
Supplementary Material
References
- Concepts and Principles; World Health Organization: Geneva, 1993. [Google Scholar]
- Siegel R. L.; Miller K. D.; Wagle N. S.; Jemal A. Cancer statistics, 2023. CA, Cancer J. Clin. 2023, 73, 17–48. 10.3322/caac.21763. [DOI] [PubMed] [Google Scholar]
- Alam N.; Arora S.; Ibrahim A.; Deval P. Current synthesis routes of thiazole and its derivatives and their broad spectrum therapeutic activity: A Review. J. Basic Appl. Res. Biomed. 2022, 8, 35–40. 10.51152/jbarbiomed.v8i1.216. [DOI] [Google Scholar]
- Duc D. X.; Chung N. T. Recent Development in the Synthesis of Thiazoles. Curr. Org. Synth. 2022, 19, 702–730. 10.2174/1570179419666220216122637. [DOI] [PubMed] [Google Scholar]
- Ayati A.; Emami S.; Asadipour A.; Shafiee A.; Foroumadi A. Recent applications of 1, 3-thiazole core structure in the identification of new lead compounds and drug discovery. Eur. J. Med. Chem. 2015, 97, 699–718. 10.1016/j.ejmech.2015.04.015. [DOI] [PubMed] [Google Scholar]
- Singh A.; Malhotra D.; Singh K.; Chadha R.; Bedi P. M. S. Thiazole derivatives in medicinal chemistry: Recent advancements in synthetic strategies, structure activity relationship and pharmacological outcomes. J. Mol. Struct. 2022, 1266, 133479 10.1016/j.molstruc.2022.133479. [DOI] [Google Scholar]
- Chhabria M. T.; Patel S.; Modi P.; S Brahmkshatriya P. Thiazole: A review on chemistry, synthesis and therapeutic importance of its derivatives. Curr. Top. Med. Chem. 2016, 16, 2841–2862. 10.2174/1568026616666160506130731. [DOI] [PubMed] [Google Scholar]
- Petrou A.; Fesatidou M.; Geronikaki A. Thiazole ring—A biologically active scaffold. Molecules 2021, 26, 3166. 10.3390/molecules26113166. [DOI] [PMC free article] [PubMed] [Google Scholar]
- Sivaprakasam P.; Han X.; Civiello R. L.; Jacutin-Porte S.; Kish K.; Pokross M.; et al. Discovery of new acylaminopyridines as GSK-3 inhibitors by a structure guided in-depth exploration of chemical space around a pyrrolopyridinone core. Bioorg. Med. Chem. Lett. 2015, 25, 1856–1863. 10.1016/j.bmcl.2015.03.046. [DOI] [PubMed] [Google Scholar]
- Subbaiah M. A. M.; Meanwell N. A. Bioisosteres of the phenyl ring: recent strategic applications in lead optimization and drug design. J. Med. Chem. 2021, 64, 14046–14128. 10.1021/acs.jmedchem.1c01215. [DOI] [PubMed] [Google Scholar]
- Jain S.; Pattnaik S.; Pathak K.; Kumar S.; Pathak D.; Jain S.; Vaidya A. Anticancer potential of thiazole derivatives: a retrospective review. Mini Rev. Med. Chem. 2018, 18, 640–655. 10.2174/1389557517666171123211321. [DOI] [PubMed] [Google Scholar]
- Ayati A.; Emami S.; Moghimi S.; Foroumadi A. Thiazole in the targeted anticancer drug discovery. Future Med. Chem. 2019, 11, 1929–1952. 10.4155/fmc-2018-0416. [DOI] [PubMed] [Google Scholar]
- Sharma P. C.; Bansal K. K.; Sharma A.; Sharma D.; Deep A. Thiazole-containing compounds as therapeutic targets for cancer therapy. Eur. J. Med. Chem. 2020, 188, 112016 10.1016/j.ejmech.2019.112016. [DOI] [PubMed] [Google Scholar]
- Raveesha R.; Anusuya A.; Raghu A.; Yogesh Kumar K.; Kumar K. Y.; Dileep Kumar M.; Kumar M. D.; Benaka Prasad S.; Prasad S. B. Synthesis and characterization of novel thiazole derivatives as potential anticancer agents: Molecular docking and DFT studies. Comput. Toxicol. 2022, 21, 100202 10.1016/j.comtox.2021.100202. [DOI] [Google Scholar]
- Patel S.; Patel R.; Parameswaran P.; Jain A.; Shard A. Design, computational studies, synthesis and biological evaluation of thiazole-based molecules as anticancer agents. Eur. J. Pharm. Sci. 2019, 134, 20–30. 10.1016/j.ejps.2019.04.005. [DOI] [PubMed] [Google Scholar]
- Kasetti A. B.; Singhvi I.; Nagasuri R.; Bhandare R. R.; Shaik A. B. Thiazole–chalcone hybrids as prospective antitubercular and antiproliferative agents: Design, synthesis, biological, molecular docking studies and in silico ADME evaluation. Molecules 2021, 26, 2847. 10.3390/molecules26102847. [DOI] [PMC free article] [PubMed] [Google Scholar]
- Vader G.; Lens S. M. The Aurora kinase family in cell division and cancer. Bioch. Biophys. Acta 2008, 1786, 60–72. 10.1016/j.bbcan.2008.07.003. [DOI] [PubMed] [Google Scholar]
- Nigg E. A. Mitotic kinases as regulators of cell division and its checkpoints. Nat. Rev. Mol. Cell Biol. 2001, 2, 21–32. 10.1038/35048096. [DOI] [PubMed] [Google Scholar]
- Mou P. K.; Yang E. J.; Shi C.; Ren G.; Tao S.; Shim J. S. Aurora kinase A, a synthetic lethal target for precision cancer medicine. Exp. Mol. Med. 2021, 53, 835–847. 10.1038/s12276-021-00635-6. [DOI] [PMC free article] [PubMed] [Google Scholar]
- Ma H. T.; Poon R. Y. Aurora kinases and DNA damage response. Mutat. Res. 2020, 821, 111716 10.1016/j.mrfmmm.2020.111716. [DOI] [PubMed] [Google Scholar]
- Diaz-Moralli S.; Tarrado-Castellarnau M.; Miranda A.; Cascante M. Targeting cell cycle regulation in cancer therapy. Pharmacol. Ther. 2013, 138, 255–271. 10.1016/j.pharmthera.2013.01.011. [DOI] [PubMed] [Google Scholar]
- Pradhan T.; Gupta O.; Singh G.; Monga V. Aurora kinase inhibitors as potential anticancer agents: Recent advances. Eur. J. Med. Chem. 2021, 221, 113495 10.1016/j.ejmech.2021.113495. [DOI] [PubMed] [Google Scholar]
- Borah N. A.; Reddy M. M. Aurora kinase B inhibition: a potential therapeutic strategy for cancer. Molecules 2021, 26, 1981. 10.3390/molecules26071981. [DOI] [PMC free article] [PubMed] [Google Scholar]
- Andersen C. B.; Wan Y.; Chang J. W.; Riggs B.; Lee C.; Liu Y.; et al. Discovery of selective aminothiazole aurora kinase inhibitors. ACS Chem. Biol. 2008, 3, 180–192. 10.1021/cb700200w. [DOI] [PubMed] [Google Scholar]
- Wang S.; Midgley C. A.; Scaërou F.; Grabarek J. B.; Griffiths G.; Jackson W.; et al. Discovery of N-phenyl-4-(thiazol-5-yl) pyrimidin-2-amine aurora kinase inhibitors. J. Med. Chem. 2010, 53, 4367–4378. 10.1021/jm901913s. [DOI] [PubMed] [Google Scholar]
- Mali S. N.; Pandey A.; Bhandare R. R.; Shaik A. B. Identification of hydantoin based Decaprenylphosphoryl-β-d-Ribose Oxidase (DprE1) inhibitors as antimycobacterial agents using computational tools. Sci. Rep. 2022, 12, 16368 10.1038/s41598-022-20325-1. [DOI] [PMC free article] [PubMed] [Google Scholar]
- Abchir O.; Daoui O.; Belaidi S.; Ouassaf M.; Qais F. A.; ElKhattabi S.; Belaaouad S.; Chtita S. Design of novel benzimidazole derivatives as potential α-amylase inhibitors using QSAR, pharmacokinetics, molecular docking, and molecular dynamics simulation studies. J. Mol. Model. 2022, 28, 106. 10.1007/s00894-022-05097-9. [DOI] [PubMed] [Google Scholar]
- Elmaaty A. A.; Darwish K. M.; Chrouda A.; Boseila A. A.; Tantawy M. A.; Elhady S. S.; Shaik A. B.; Mustafa M.; Al-Karmalawy A. A. In silico and in vitro studies for benzimidazole anthelmintics repurposing as VEGFR-2 antagonists: novel mebendazole-loaded mixed micelles with enhanced dissolution and anticancer activity. ACS Omega 2022, 7, 875–899. 10.1021/acsomega.1c05519. [DOI] [PMC free article] [PubMed] [Google Scholar]
- Chalkha M.; Akhazzane M.; Moussaid F. Z.; Daoui O.; Nakkabi A.; Bakhouch M.; Chtita S.; Elkhattabi S.; Housseini A. I.; El Yazidi M. Design, synthesis, characterization, in vitro screening, molecular docking, 3D-QSAR, and ADME-Tox investigations of novel pyrazole derivatives as antimicrobial agents. New J. Chem. 2022, 46, 2747–2760. 10.1039/D1NJ05621B. [DOI] [Google Scholar]
- Govindarao K.; Srinivasan N.; Suresh R.; Raheja R. K.; Annadurai S.; Bhandare R. R.; Shaik A. B. Quinoline conjugated 2-azetidinone derivatives as prospective anti-breast cancer agents: In vitro antiproliferative and anti-EGFR activities, molecular docking and in-silico drug likeliness studies. J. Saudi Chem. Soc. 2022, 26, 101471 10.1016/j.jscs.2022.101471. [DOI] [Google Scholar]
- Chtita S.; Aouidate A.; Belhassan A.; Ousaa A.; Taourati A. I.; Elidrissi B.; Ghamali M.; Bouachrine M.; Lakhlifi T. QSAR study of N-substituted oseltamivir derivatives as potent avian influenza virus H5N1 inhibitors using quantum chemical descriptors and statistical methods. New J. Chem. 2020, 44, 1747–1760. 10.1039/C9NJ04909F. [DOI] [Google Scholar]
- Bhandare R. R.; Munikrishnappa C. S.; Kumar G. S.; Konidala S. K.; Sigalapalli D. K.; Vaishnav Y.; Chinnam S.; Yasin H.; Al-karmalawy A. A.; Shaik A. B. Multistep synthesis and screening of heterocyclic tetrads containing furan, pyrazoline, thiazole and triazole (or oxadiazole) as antimicrobial and anticancer agents. J. Saudi Chem. Soc. 2022, 26, 101447 10.1016/j.jscs.2022.101447. [DOI] [Google Scholar]
- Ramalakshmi N.; Manimegalai P.; Bhandare R. R.; Kumar S. A.; Shaik A. B. 2D-Quantitative structure-activity relationship (QSAR) modeling, docking studies, synthesis and in-vitro evaluation of 1, 3, 4-thiadiazole tethered coumarin derivatives as antiproliferative agents. J. Saudi Chem. Soc. 2021, 25, 101279 10.1016/j.jscs.2021.101279. [DOI] [Google Scholar]
- Chtita S.; Ghamali M.; Ousaa A.; Aouidate A.; Belhassan A.; Taourati A. I.; Masand V. H.; Bouachrine M.; Lakhlifi T. QSAR study of anti-Human African Trypanosomiasis activity for 2-phenylimidazopyridines derivatives using DFT and Lipinski’s descriptors. Heliyon 2019, 5, e01304 10.1016/j.heliyon.2019.e01304. [DOI] [PMC free article] [PubMed] [Google Scholar]
- Bhandare R. R.; Shaik A. B. Assessment of the Antimicrobial and Antiproliferative Activities of Chloropyrazine-Tethered Pyrimidine Derivatives: In Vitro, Molecular Docking, and In-Silico Drug-Likeness Studies. Appl. Sci. 2021, 11, 10734. 10.3390/app112210734. [DOI] [Google Scholar]
- Shaik A. B.; Prasad Y. R.; Nissankararao S.; Shahanaaz S. Synthesis, biological and computational evaluation of novel 2, 3-dihydro-2-aryl-4-(4-isobutylphenyl)-1, 5-benzothiazepine derivatives as anticancer and anti-EGFR tyrosine kinase agents. Anti-Cancer Agents Med. Chem. 2020, 20, 1115–1128. 10.2174/1871520620666200130091142. [DOI] [PubMed] [Google Scholar]
- Aouidate A.; Ghaleb A.; Ghamali M.; Chtita S.; Choukrad M.; Sbai A.; Bouachrine M.; Lakhlifi T. Combined 3D-QSAR and molecular docking study on 7, 8-dialkyl-1, 3-diaminopyrrolo-[3, 2-f] Quinazoline series compounds to understand the binding mechanism of DHFR inhibitors. J. Mol. Struct. 2017, 1139 (1139), 319–327. 10.1016/j.molstruc.2017.03.039. [DOI] [Google Scholar]
- Chtita S.; Ghamali M.; Hmamouchi R.; Elidrissi B.; Bourass M.; Larif M.; Bouachrine M.; Lakhlifi T. Investigation of Antileishmanial Activities of Acridines Derivatives against Promastigotes and Amastigotes Form of Parasites Using Quantitative Structure Activity Relationship Analysis. Adv. Phys. Chem. 2016, 2016, 5137289. 10.1155/2016/5137289. [DOI] [Google Scholar]
- Belhassan A.; Chtita S.; Zaki H.; Alaqarbeh M.; Alsakhen N.; Almohtaseb F.; Lakhlifi T.; Bouachrine M. In silico detection of potential inhibitors from vitamins and their derivatives compounds against SARS-CoV-2 main protease by using molecular docking, molecular dynamic simulation and ADMET profiling. J. Mol. Struct. 2022, 1258, 132652 10.1016/j.molstruc.2022.132652. [DOI] [PMC free article] [PubMed] [Google Scholar]
- Daoui O.; Elkhattabi S.; Bakhouch M.; Belaidi S.; Bhandare R. R.; Shaik A. B.; Mali S. N.; Chtita S. Cyclohexane-1, 3-dione derivatives as future therapeutic agents for NSCLC: QSAR modeling, in silico ADME-Tox properties, and structure-based drug designing approach. ACS Omega 2023, 8, 4294–4319. 10.1021/acsomega.2c07585. [DOI] [PMC free article] [PubMed] [Google Scholar]
- Subramani A. K.; Sivaperuman A.; Natarajan R.; Bhandare R. R.; Shaik A. B. QSAR and Molecular Docking Studies of Pyrimidine-Coumarin-Triazole Conjugates as Prospective Anti-Breast Cancer Agents. Molecules 2022, 27, 1845. 10.3390/molecules27061845. [DOI] [PMC free article] [PubMed] [Google Scholar]
- Ouassaf M.; Belaidi S.; Al Mogren M. M.; Chtita S.; Khan S. U.; Htar T. T. Combined docking methods and molecular dynamics to identify effective antiviral 2, 5-diaminobenzophenonederivatives against SARS-CoV-2. J. King Saud Univ. Sci. 2022, 33, 101352 10.1016/j.jksus.2021.101352. [DOI] [PMC free article] [PubMed] [Google Scholar]
- Munikrishnappa C. S.; Kumar G. S.; Bhandare R. R.; Shaik A. B. Design, synthesis, and biological evaluation of novel bromo-pyrimidine analogues as tyrosine kinase inhibitors. Arab. J. Chem. 2021, 14, 103054 10.1016/j.arabjc.2021.103054. [DOI] [PubMed] [Google Scholar]
- Gramatica P.; Chirico N.; Papa E.; Cassani S.; Kovarich S. QSARINS: A new software for the development, analysis, and validation of QSAR MLR models. J. Comput. Chem. 2013, 34, 2121. 10.1002/jcc.23361. [DOI] [Google Scholar]
- QSRINS v2.2.4 release 2013. http://www.qsar.it (accessed February 2022).
- Gramatica P.; Cassani S.; Chirico N. QSARINS-chem: Insubria datasets and new QSAR/QSPR models for environmental pollutants in QSARINS. J. Comput. Chem. 2014, 35, 1036. 10.1002/jcc.23576. [DOI] [PubMed] [Google Scholar]
- Daina A.; Michielin O.; Zoete V. SwissADME: a free web tool to evaluate pharmacokinetics, drug-likeness and medicinal chemistry friendliness of small molecules. Sci. Rep. 2017, 7, 42717 10.1038/srep42717. [DOI] [PMC free article] [PubMed] [Google Scholar]
- Daoui O.; Mazoir N.; Bakhouch M.; et al. 3D-QSAR, ADMETox, and molecular docking of semisynthetic triterpene derivatives as antibacterial and insecticide agents. Struct. Chem. 2022, 33, 1063–1084. 10.1007/s11224-022-01912-4. [DOI] [PMC free article] [PubMed] [Google Scholar]
- Bakchi B.; Krishna A. D.; Sreecharan E.; Ganesh V. B. J.; Niharika M.; Maharshi S.; et al. An overview on applications of SwissADME web tool in the design and development of anticancer, antitubercular and antimicrobial agents: A medicinal chemist’s perspective. J. Mol. Struct. 2022, 1259, 132712 10.1016/j.molstruc.2022.132712. [DOI] [Google Scholar]
- Qin J.; Xi L.; Du J.; Liu H.; Yao X. QSAR studies on aminothiazole derivatives as aurora a kinase inhibitors. Chem. Biol. Drug Des. 2010, 76, 527–537. 10.1111/j.1747-0285.2010.01030.x. [DOI] [PubMed] [Google Scholar]
- O’Boyle N. M.; Banck M.; James C. A.; Morley C.; Vandermeersch T.; Hutchison G. R. Open Babel: An open chemical toolbox. J. Cheminf. 2011, 3, 33. 10.1186/1758-2946-3-33. [DOI] [PMC free article] [PubMed] [Google Scholar]
- Hanwell M. D.; Curtis D. E.; Lonie D. C.; Vandermeersch T.; Zurek E.; Hutchison G. R. Avogadro: an advanced semantic chemical editor, visualization, and analysis platform. J. Cheminf. 2012, 4, 17. 10.1186/1758-2946-4-17. [DOI] [PMC free article] [PubMed] [Google Scholar]
- Yordanova D.; Schultz T. W.; Kuseva C.; Tankova K.; Ivanova H.; Dermen I.; et al. Automated and standardized workflows in the OECD QSAR Toolbox. Comput. Toxicol. 2019, 10, 89–104. 10.1016/j.comtox.2019.01.006. [DOI] [Google Scholar]
- Cardoso-Silva J.; Papageorgiou L. G.; Tsoka S. Network-based piecewise linear regression for QSAR modelling. J. Comput.-Aided Mol. Des. 2019, 33, 831–844. 10.1007/s10822-019-00228-6. [DOI] [PMC free article] [PubMed] [Google Scholar]
- Wang Y.; Guo Y.; Qiang S.; Jin R.; Li Z.; Tang Y.; et al. 3D-QSAR, Molecular Docking, and MD Simulations of Anthraquinone Derivatives as PGAM1 Inhibitors. Front. Pharmacol. 2021, 12, 764351 10.3389/fphar.2021.764351. [DOI] [PMC free article] [PubMed] [Google Scholar]
- Gramatica P.; Chirico N.; Papa E.; Cassani S.; Kovarich S. QSARINS: A new software for the development, analysis, and validation of QSAR MLR models. J. Comput. Chem. 2013, 34, 2121–2132. 10.1002/jcc.23361. [DOI] [Google Scholar]
- Said M. F.; George R. F.; Petreni A.; Supuran C. T.; Mohamed N. M. Synthesis, molecular modelling and QSAR study of new N-phenylacetamide-2-oxoindole benzensulfonamide conjugates as carbonic anhydrase inhibitors with antiproliferative activity. J. Enzyme Inhib. Med. Chem. 2022, 37, 701–717. 10.1080/14756366.2022.2036137. [DOI] [PMC free article] [PubMed] [Google Scholar]
- Dong J.; Cao D. S.; Miao H. Y.; Liu S.; Deng B. C.; Yun Y. H.; et al. ChemDes: an integrated web-based platform for molecular descriptor and fingerprint computation. J. Cheminf. 2015, 7, 60. 10.1186/s13321-015-0109-z. [DOI] [PMC free article] [PubMed] [Google Scholar]
- Alomari F. Y.; Sharfalddin A. A.; Abdellattif M. H.; Domyati D.; Basaleh A. S.; Hussien M. A. QSAR Modeling, Molecular Docking and Cytotoxic Evaluation for Novel Oxidovanadium(IV) Complexes as Colon Anticancer Agents. Molecules 2022, 27, 649. 10.3390/molecules27030649. [DOI] [PMC free article] [PubMed] [Google Scholar]
- Zothantluanga J.; Chetia D.; Rajkhowa S.; Umar A. Unsupervised machine learning, QSAR modelling and web tool development for streamlining the lead identification process of antimalarial flavonoids. SAR QSAR Environ. Res. 2023, 34, 117–146. 10.1080/1062936X.2023.2169347. [DOI] [PubMed] [Google Scholar]
- Emami L.; Sabet R.; Khabnadideh S.; Faghih Z.; Thayori P. Quinazoline analogues as cytotoxic agents; QSAR, docking, and in silico studies. Res. Pharm. Sci. 2021, 16, 528. 10.4103/1735-5362.323919. [DOI] [PMC free article] [PubMed] [Google Scholar]
- Garima; Sharma S.; Sindhu J.; Kumar P. QSAR study of tetrahydropteridin derivatives as polo-like kinase 1 (PLK1) Inhibitors with molecular docking and dynamics study. SAR QSAR Environ. Res. 2023, 34, 91–116. 10.1080/1062936X.2023.2167860. [DOI] [PubMed] [Google Scholar]
- Cotuá J.; Llinás S.; Cotes O. Virtual Screening Based on QSAR and Molecular Docking of Possible Inhibitors Targeting Chagas CYP51. J. Chem. 2021, 2021, 6640624. 10.1155/2021/6640624. [DOI] [Google Scholar]
- Wang X.; Duan W.; Lin G.; Li B.; Chen M.; Lei F. Synthesis, 3D-QSAR and Molecular Docking Study of Nopol-Based 1,2,4-Triazole-Thioether Compounds as Potential Antifungal Agents. Front. Chem. 2021, 9, 757584 10.3389/fchem.2021.757584. [DOI] [PMC free article] [PubMed] [Google Scholar]
- Mishra S.; Dahima R. In vitro ADME studies of TUG-891, a GPR-120 inhibitor using SWISS ADME predictor. J. Drug Delivery Ther. 2019, 9, 366–369. 10.22270/jddt.v9i2-s.2710. [DOI] [Google Scholar]
- Isyaku Y.; Uzairu A.; Uba S. Computational studies of a series of 2-substituted phenyl-2-oxo-, 2-hydroxyl-and 2-acylloxyethylsulfonamides as potent anti-fungal agents. Heliyon 2020, 6, e03724 10.1016/j.heliyon.2020.e03724. [DOI] [PMC free article] [PubMed] [Google Scholar]
- Sanner M. F. Python: A Programming Language for Software Integration and Development. J. Mol. Graphics Model. 1999, 17, 57–61. [PubMed] [Google Scholar]
- Duchowicz P. R.; Bennardi D. O.; Ortiz E. V.; Comelli N. C. QSAR models for the fumigant activity prediction of essential oils. J. Mol. Graphics Model. 2020, 101, 107751 10.1016/j.jmgm.2020.107751. [DOI] [PubMed] [Google Scholar]
- Khamouli S.; Belaidi S.; Bakhouch M.; Chtita S.; Hashmi M. A.; Qais F. QSAR modeling, molecular docking, ADMET prediction and molecular dynamics simulations of some 6-arylquinazolin-4-amine derivatives as DYRK1A inhibitors. J. Mol. Struct. 2022, 1258, 132659 10.1016/j.molstruc.2022.132659. [DOI] [Google Scholar]
- Adedirin O.; Uzairu A.; Shallangwa G. A.; Abechi S. E. Computational studies on α-aminoacetamide derivatives with anticonvulsant activities. Beni-Suef Uni. J. Basic Appl. Sci. 2018, 7, 709–718. 10.1016/j.bjbas.2018.08.005. [DOI] [Google Scholar]
- Laskowski R. A.; Swindells M. B. LigPlot+: multiple ligand-protein interaction diagrams for drug discovery. J. Chem. Inf. Model. 2011, 51, 2778–2786. 10.1021/ci200227u. [DOI] [PubMed] [Google Scholar]
- Cabrera N.; Cuesta S. A.; Mora J. R.; Calle L.; Márquez E. A.; Kaunas R.; Paz J. L. In silico searching for alternative lead compounds to treat type 2 diabetes through a QSAR and molecular dynamics study. Pharmaceutics 2022, 14, 232. 10.3390/pharmaceutics14020232. [DOI] [PMC free article] [PubMed] [Google Scholar]
- Siva Kumar B.; Anuragh S.; Kammala A. K.; Ilango K. Computer aided drug design approach to screen Phytoconstituents of Adhatoda vasica as potential inhibitors of SARS-CoV-2 Main protease enzyme. Life 2022, 12, 315. 10.3390/life12020315. [DOI] [PMC free article] [PubMed] [Google Scholar]
- Khetmalis Y. M.; Chitti S.; Umarani Wunnava A.; Wunnava A. U.; Karan Kumar B.; Kumar B. K.; Murali Krishna Kumar M.; Kumar M. M. K.; Murugesan S. Design, synthesis and anti-mycobacterial evaluation of imidazo [1, 2-a] pyridine analogues. RSC Med. Chem. 2022, 13, 327–342. 10.1039/d1md00367d. [DOI] [PMC free article] [PubMed] [Google Scholar]
- Sugunakala S.; Selvaraj S. 2D QSAR and Virtual Screening based on Pyridopyrimidine Analogs of Epidermal Growth Factor Receptor Tyrosine Kinase. Curr. Comput.-Aided Drug Des. 2016, 12, 229–240. 10.2174/1573409912666160606150323. [DOI] [PubMed] [Google Scholar]
- Di Tullio M.; Maccallini C.; Ammazzalorso A.; Giampietro L.; Amoroso R.; De Filippis B.; et al. QSAR, QSPR and QSRR in Terms of 3-D-MoRSE Descriptors for In Silico Screening of Clofibric Acid Analogues. Mol. Inf. 2012, 31, 453–458. 10.1002/minf.201200001. [DOI] [PubMed] [Google Scholar]
Associated Data
This section collects any data citations, data availability statements, or supplementary materials included in this article.
Supplementary Materials
Data Availability Statement
All data sets collected and analyzed during this study are available within the manuscript and in the Supporting Information.