

Abstract
Sphingomonas sp. strain RB2256 is a representative of the dominant class of ultramicrobacteria that are present in marine oligotrophic waters. In this study we examined the rRNA copy number and ribosome content of RB2256 to identify factors that may be associated with the relatively low rate of growth exhibited by the organism. It was found that RB2256 contains a single copy of the rRNA operon, in contrast to Vibrio spp., which contain more than eight copies. The maximum number of ribosomes per cell was observed during mid-log phase; however, this maximum content was low compared to those of faster-growing, heterotrophic bacteria (approximately 8% of the maximum ribosome content of Escherichia coli with a growth rate of 1.5 h−1). The low number of ribosomes per cell appears to correlate with the low rate of growth (0.16 to 0.18 h−1) and the presence of a single copy of the rRNA operon. However, on the basis of cell volume, RB2256 appears to have a higher concentration of ribosomes than E. coli (approximately double that of E. coli with a growth rate of 1.5 h−1). Ribosome numbers reached maximum levels during mid-log-phase growth but decreased rapidly to 10% of maximum during late log phase through 7 days of starvation. The cells in late log phase and at the onset of starvation displayed an immediate response to a sudden addition of excess glucose (3 mM). This result demonstrates that a ribosome content 10% of maximum is sufficient to allow cells to immediately respond to nutrient upshift and achieve maximum rates of growth. These data indicate that the bulk of the ribosome pool is not required for protein synthesis and that ribosomes are not the limiting factor contributing to a low rate of growth. Our findings show that the regulation of ribosome content, the number of ribosomes per cell, and growth rate responses in RB2256 are fundamentally different from those characteristics in fast-growing heterotrophs like E. coli and that they may be characteristics typical of oligotrophic ultramicrobacteria.
Sphingomonas sp. strain RB2256 was isolated from Resurrection Bay, Alaska (5, 31). When it was originally isolated, it was able to grow only in seawater medium that contained less than 1 mg of dissolved organic carbon (DOC) per liter (31). The growing cells were ultramicro (<0.1 μm3) in size and grew relatively slowly (μ = <0.2 h−1). In contrast, significantly lower numbers (<1%) of larger, faster-growing cells were able to be immediately cultured in rich media and on plates. In this regard, RB2256 behaved like an obligate oligotroph by growing like a K strategist (grows slowly by using low concentrations of nutrients), while the faster-growing cells behaved like eutrophs by growing like r strategists (which grow in bursts and produce resting-stage cells) (reviewed in reference 35). Upon storage at 5°C, RB2256 cells developed the ability to form colonies on plates and grew in rich media, a procedure that was reproducible for related species from the North Sea (31, 32). The term “facultatively oligotrophic” has been used to describe the ability of an obligate oligotroph to grow on rich media (34). By the definitions of Hirsch et al. (16), RB2256 also fulfills the criteria for being a “model oligotroph” by possessing high-affinity uptake systems, the ability to simultaneously take up mixed substrates (33), and a mechanism for avoiding predation, i.e., its ultramicro size (9, 13, 35).
Although the defining characteristics of an oligotroph are the subject of debate (23, 34), we operationally define RB2256 as an oligotrophic ultramicrobacterium due to the growth properties it exhibited when it was isolated (e.g., it was unable to grow in rich media) and the physiological (e.g., the ability to grow in media containing <1 mg of DOC/liter) and morphological (e.g., the retention of a constant ultramicro size of <1 μm3 irrespective of whether it is growing or starving) characteristics that it possesses (9). These characteristics differ in many ways from those of eutrophic marine bacteria, typified by Vibrio spp. For example, Vibrio angustum S14 undergoes reductive cell division when it is grown in progressively nutrient-limited media or starved (27) and is markedly less stress resistant than RB2256 (18, 25, 28).
RB2256 cells have the ability to immediately reach maximum rates of growth without a lag after the addition of excess glucose to glucose-limited chemostat cultures or in acetate or alanine batch cultures (9). The immediate response of RB2256 cells to nutrient upshift suggests that the ribosome content is not limiting, that the ribosome content is not down-regulated during slow growth, and/or that the remaining ribosomal pool is sufficient for immediately achieving maximum rates of growth.
A distinguishing feature of RB2256 is its constant rate of growth (0.13 to 0.16 h−1), regardless of the glucose concentration (800 to 0.8 mg of DOC/liter) in the medium (9). Bacteria such as V. angustum S14 with high rates of growth (2.2 doublings/h) (27) are known to contain 8 to 11 copies of the rRNA operon (39) and >35,000 ribosomes/cell (10). In contrast, the bioluminescent symbiont from the Caribbean flashlight fish, Kryptophanaron alfredi, has a low rate of growth (one doubling every 8 to 23 h) and a single copy of the rRNA operon (39). The relatively low rate of growth of RB2256 may also be correlated with its rRNA operon copy number and ribosome content.
In order to discern the relationship between growth rate characteristics of RB2256 and ribosome levels, in this study we examined the rRNA operon copy numbers and ribosome contents of cells growing throughout the growth phase and of cells during periods of starvation of up to 7 days. The results of these experiments provide important insights into the unique physiology of this oligotrophic ultramicrobacterium.
MATERIALS AND METHODS
Source of the isolate.
Sphingomonas sp. strain RB2256 was isolated from Resurrection Bay, Alaska, by an extinction dilution method at a dilution of 10−6 (5, 31). Following growth in filtered autoclaved seawater (ASW) and synthetic seawater medium (MPM[31]) at 10°C, static cultures were stored in the dark for 6 months at 5°C. After this procedure, colonies formed when the strain was plated onto ZoBell and MPM solid medium. At the collection site the bacterioplankton populations were 0.2 × 10⁶ to 1.07 × 10⁶ cells/ml, making RB2256 a numerically important member of the population at the time of sampling. Morphologically (31) and phylogenetically (14) related species were also isolated as representatives of the dominant population from the North Sea.
Microorganisms, media, and growth conditions.
Batch cultures of RB2256 were grown at 30°C with rotary shaking (130 rpm) in two types of artificial media: ASW and VNSS (9). With ASW, 3 mM d-glucose was added as the carbon source. Growth was monitored at 610 and 433 nm, and cell density was determined by the drop plate method (10) with VNSS solid medium. Starvation experiments were performed by growing cells in ASW-glucose until glucose deprivation caused cessation of growth (this was defined as the onset of starvation). The starved cultures were then incubated for up to 7 days.
Other bacterial strains used in this study were Escherichia coli JM101, Vibrio fischeri MJ1, and Vibrio harveyi 179, which were obtained from the University of New South Wales culture collection. Mycoplasma pneumoniae M12-B16 was a gift from V. Vasinger, University of Sydney. E. coli batch cultures were grown in Luria broth at 37°C, V. fischeri and V. harveyi were grown in Luria broth with 2% NaCl at room temperature, and M. pneumoniae was grown in Leivbovitz-15 medium at 37°C.
Determination of rRNA operon copy number.
Genomic DNAs from RB2256, E. coli, V. fischeri, V. harveyi, and M. pneumoniae were prepared by a phenol-chloroform-isoamyl alcohol (25:24:1) extraction procedure (38). The control strains were chosen due to the broad range of numbers of rRNA operons known to be present in them. Prior to PCR, genomic DNA was purified with a Prep-A-Gene DNA purification kit (Bio-Rad). An approximately 500-ng sample of genomic DNA from RB2256, E. coli, V. fischeri, V. harveyi, or M. pneumoniae was digested with a range of restriction enzymes: NcoI, BclI, AatII, EcoRV, and NaeI for RB2256; NcoI and PvuII for E. coli; NcoI and EcoRI for V. fischeri; NcoI and PvuII for V. harveyi; and EcoRI for M. pneumoniae. DNA fragments were separated in 0.7% agarose gels in TAE buffer (0.4 M Tris-acetate, 1 mM EDTA [pH 8.0]) and transferred to a nylon membrane by capillary blotting. A PCR digoxigenin (DIG)-labelled probe was constructed from RB2256 genomic DNA with two universal 16S rRNA primers: R12 (ACGGCTACCTTGTTACGACT) and F1 (GAGTTTGATCCTGGCTCAG). R12 and F1 correspond to positions 1492 to 1512 and 11 to 29 in the E. coli 16S rRNA sequence, respectively. Southern hybridization and detection of DIG probes were performed with a DIG luminescence detection kit (Boehringer Mannheim) by following the supplier’s protocols.
Preparation of the ribosomal fraction.
Ribosomal fractions were prepared as described in the work of Flardh et al. (10). Cells were harvested, lysed, and fractionated by differential centrifugation, and rRNA was quantified chemically by the orcinol reaction procedure (see below). Chemicals and glassware used in this experiment were treated with 0.1% diethyl pyrocarbonate. Cultures (200 ml) of RB2256 were harvested at exponential phase, at the onset of starvation, and after carbon starvation for a range of times up to 7 days. The cells were pelleted at 25°C by centrifugation at 10,000 × g (Sorvall GSA rotor) for 10 min and stored at −70°C. The pellets were thawed and resuspended in 1 ml of buffer A (10 mM Tris-HCl [pH 7.5], 1 mM EDTA, 6 mM 2-β-mercaptoethanol, 1.25 mM dithiothreitol). Lysozyme (300 μg/ml) and 1 ml of buffer B (10 mM Tris-HCl [pH 7.5], 20 mM magnesium acetate, 60 mM KCl, 6 mM 2-β-mercaptoethanol, 1.25 mM dithiothreitol) were added thereafter. The lysate was incubated on ice for 15 min, and 80 μl of 10% Triton X-100 was added. The lysate was kept on ice for another 15 min, followed by the addition of 6 ml of buffer C (10 mM Tris-HCl [pH 7.5], 10.5 mM magnesium acetate, 0.5 mM EDTA, 30 mM KCl, 6 mM 2-β-mercaptoethanol, 1.25 mM dithiothreitol) with 20 μl of DNase I (10 U per ml; Boehringer Mannheim) and incubation at 37°C for 20 min. After the cells were cooled on ice, cell debris was pelleted by centrifugation at 7,000 × g (Sorvall SM24 rotor) at 4°C for 10 min. The supernatants were centrifuged twice at 30,000 × g (Sorvall SA600 rotor) at 4°C for 30 min. The ribosomal particles in the resulting supernatant were pelleted by centrifugation at 150,000 × g at 4°C for 1 h in a Beckman ultracentrifuge (SW41 Ti rotor). The resulting crude ribosomal pellets were resuspended in 600 μl of buffer C and stored at −70°C.
Chemical determination of ribosome content.
Determination of rRNA content was performed by the orcinol reaction procedure (8), with Saccharomyces cerevisiae RNA (Boehringer Mannheim; 0.1 mg/ml in 50 mM NaOH) as an RNA standard, as described by Flardh et al. (10). Trichloroacetic acid (final concentration, 10%) was added to thawed samples to precipitate ribosomal particles. The resulting precipitates were pelleted in a microcentrifuge at 12,000 rpm at 4°C for 20 min, and the pellets were subsequently resuspended in 1 ml of 50 mM NaOH. All the samples were kept on ice until they were used in the colorimetry assay. For the colorimetry assay, reagent B was prepared by adding 5 ml of reagent A [2.7% (wt/vol) Fe(NH4)2(SO4)2 and 4% (wt/vol) orcinol] to 85 ml of concentrated HCl and 10 ml of diethyl pyrocarbonate-treated Milli-Q water. Three milliliters of reagent B was added to 1 ml of sample in a test tube, and suspensions were vortexed briefly. Each tube was covered with a marble and immediately placed in boiling water for 20 min. Samples were allowed to cool to room temperature, and the optical density at 670 nm (OD670) of each sample was determined with a Beckman DU 640 spectrophotometer. The amount of rRNA in each sample was calculated from a standard curve with yeast RNA. The efficiency of lysis was determined as the percentage of RNA that remained in the lysate after unlysed cells had been removed and was found to be essentially the same for all cells regardless of growth or starvation phase. The amount of rRNA per cell (femtograms per cell) was then calculated from the viable-cell count for each sample. The number of ribosomes per cell was calculated by multiplying the cellular amount (grams per cell) by Avogadro’s number (6.02 × 10²³ mol−1) and dividing by the molecular weight of a ribosome (1.539 × 10⁶) (24). Ribosome concentration per cell volume (ribosomes per cubic micrometer) was calculated as the number of ribosomes per cell divided by the cell volume (RB2256, 0.05 μm3; E. coli, 1.1 μm3).
Nutrient upshift experiments.
ASW-glucose is a defined medium containing 3 mM glucose and enables cultures to reach >109 cells/ml. VNSS medium is a complex medium also containing 3 mM glucose. The half-saturation constant for glucose uptake in RB2256 is 40 to 75 μM (33), and 3 mM glucose was the concentration chosen for glucose excess (9). For upshift experiments, RB2256 cultures were grown in ASW-glucose (3 mM) at 30°C, sampled at late log phase; at onset of starvation; and after 1, 2, 4, and 7 days of starvation and diluted 1:5 into fresh ASW-glucose or VNSS medium. Nutrient-upshifted cultures were incubated at 30°C, and growth was monitored at 433 nm for the next 6 h. OD was monitored every 10 min for the first 2 h to determine the initial response, and every hour thereafter.
RESULTS
rRNA operon copy number.
In complex artificial seawater basal medium (VNSS), RB2256 exhibits a growth rate of 0.13 to 0.16 h−1 at 25°C over a 104-fold range of medium richness (800 to 0.8 mg of DOC/liter) (9). This result indicates that while RB2256 is capable of growing as fast under oligotrophic conditions (<1 mg of DOC/liter) as it does under eutrophic conditions (800 mg of DOC/liter), its growth rate is comparatively low compared to those of heterotrophic marine bacteria, such as the well-studied V. angustum S14, which has a growth rate of 2.2 h−1 on VNSS (27). We rationalized that the low maximum rate of growth of RB2256 may correlate with a low number of copies of the rRNA operon.
rRNA operon copy number was determined by Southern hybridization with a 16S ribosomal DNA probe hybridized to restriction enzyme digests of genomic DNAs from RB2256 and control strains: E. coli, V. fischeri, V. harveyi, and M. pneumoniae (Fig. 1). For all control strains, the number of bands present was consistent with the number of rRNA operons known to be present in those organisms (Table 1). For example, E. coli possesses seven rRNA operons (19) and six or seven bands were detected, and M. pneumoniae possesses one to two rRNA operons (1) and two bands were detected. The digests for RB2256 showed one or two bands depending on the restriction enzyme used, suggesting that RB2256 has one or two copies of the rRNA operon.
FIG. 1.
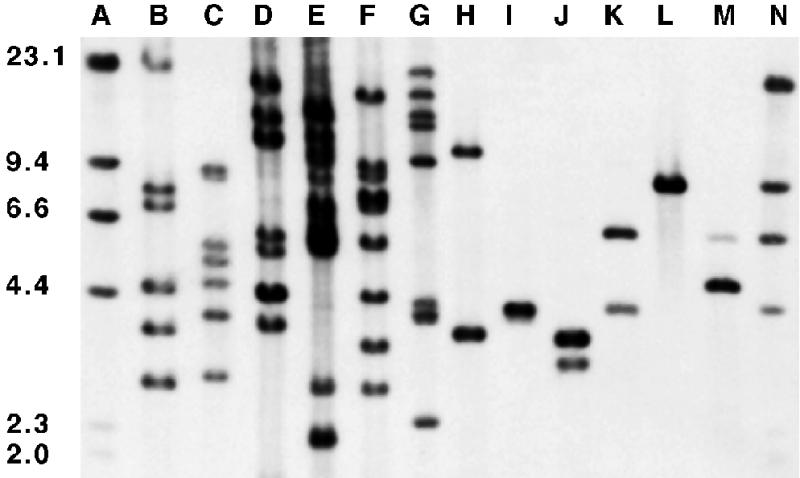
rRNA operon copy numbers as determined by Southern hybridization. Lambda phage DNA size markers (lanes A and N) and genomic DNAs from E. coli (lanes B and C), V. fischeri (lanes D and E), V. harveyi (lanes F and G), M. pneumoniae (lane H), and RB2256 (lanes I to M) were cut with the restriction enzymes NcoI (lanes B, D, F, and M), PvuII (lanes C and G), EcoRI (lane H), BclI (lane J), AatII (lane K), EcoRV (lane L), and NaeI (lane I). Molecular weight markers (in thousands) are noted at the left.
TABLE 1.
Numbers of hybridizing bands and rRNA operon contents for E. coli, V. fischeri, V. harveyi, M. pneumoniae, and RB2256
| Organism | No. of bands detected | No. of copies of rRNA operon |
|---|---|---|
| Escherichia coli | 6–7 | 7a |
| Vibrio fischeri | 7–9 | 9–11b |
| Vibrio harveyi | 7–9 | 8–11b |
| Mycoplasma pneumoniae | 2 | 1–2c |
| RB2256 | 1–2 | 1d |
To determine the exact number of rRNA operons in RB2256, we determined if each restriction enzyme used for the genomic DNA digests also had a restriction site in the 16S rRNA gene sequence (GenBank accession no. Z73631 [31, 35]). This analysis confirmed that the restriction enzymes that gave two bands in the blot shown in Fig. 1 (BclI, AatII, and NcoI) had recognition sequences within the region PCR amplified for probe synthesis but that those that gave a single band in the blot shown in Fig. 1 (NaeI and EcoRV) were absent in the 16S rRNA sequence. From these observations it is proposed that the rRNA copy number of RB2256 is 1.
Number of ribosomes per cell.
The presence of a single copy of the rRNA operon correlates with the low maximum rate of growth observed for RB2256; however, it was necessary to assess what effect the low copy number had on the number of ribosomes per cell before a clear relationship between growth rate and ribosome content could be established. To examine the regulation of ribosome synthesis, we determined the numbers of ribosomes per cell in cells growing from log phase to 7 days of carbon starvation.
The number of ribosomes per cell increased during log growth, reaching a maximum of 2,000 ribosomes per cell in mid-log phase (Fig. 2). Between mid-log and late log to stationary phase, the ribosome content decreased rapidly until it reached a minimal level of about 200 ribosomes per cell. This level of 200 ribosomes per cell remained constant from late log phase through 7 days of starvation. These data showed that the number of ribosomes per cell was regulated throughout the growth phase and that once ribosome levels fell to 10% of maximum around late log phase and the onset of starvation, the level remained constant for at least 7 days of starvation.
FIG. 2.

Ribosome contents for RB2256 cells throughout the growth phase until 7 days of starvation. Viability (□) was determined on VNSS solid medium, and the numbers of ribosomes per cell (○) were calculated from the RNA contents by the orcinol method. The data are the averages of results from five experiments. Maximum standard deviations were 40%.
Response to excess glucose.
To examine what effect the growth phase-dependent ribosome content and low constant number of ribosomes during stationary phase had on the ability of cells to respond to sudden nutrient excess, we challenged the cells with excess glucose. The pattern of response of cells to glucose upshift varied depending on whether ASW-glucose (Fig. 3A) or VNSS (Fig. 3B) was used. In ASW-glucose the response curves for cells from late log phase, at onset of starvation, and after 1 day of starvation were similar, whereas cells starved for 2 to 7 days exhibited reduced rates of growth during the 6 h following the upshift. In contrast, in VNSS medium the response curves for cells from late log phase to 7 days of starvation were similar.
FIG. 3.

Growth response of RB2256 following glucose upshift. Cell growth (OD433) was measured for cells grown after dilution to 1:5 in ASW-glucose (A) or VNSS (B) during late log phase (□); at the onset of starvation (▴); and after 1 day (○), 2 days (■), 4 days (▵), and 7 days (•) of starvation. The experiment was performed four times, and the values shown are representative of a typical experiment.
To quantitatively assess immediate growth responses, growth rates were calculated for the periods 0 to 2 h and 2 to 6 h following the upshift in each of the media and relative rates were calculated from the maximum rates of growth for log-phase cultures (Table 2). When cultures in late log phase or at the onset of starvation were subjected to excess glucose in ASW-glucose, growth immediately resumed at a rate comparable to maximum rates (relative rate = 1 for the period 0 to 2 h) (Table 2). Furthermore, both late-log-phase cells and cells from the onset of starvation maintained high rates of growth over the first 6 h (relative rate = 0.9 to 1 for the period 2 to 6 h). After 24 h of starvation, the response of the cells was almost as rapid with initial (0 to 2 h) and prolonged (2 to 6 h) rates of growth near maximal (relative rate = 0.8 to 0.9). After prolonged starvation (2 to 7 days), the ability of cells to respond to glucose upshift was diminished, with relative rates of growth decreasing from 0.4 to 0.5 at 2 days to 0.2 to 0.3 at 7 days of starvation. Even though growth responses decreased with increasing periods of starvation, a lag before growth resumed was not observed.
TABLE 2.
Relative rates of growth of RB2256 cells at late log phase to 7 days of starvation following nutrient upshift into ASW-glucose or VNSS
| Stage of growth | Relative rate of growth during indicated period after nutrient upshift toa:
|
|||
|---|---|---|---|---|
| ASW-glucose (3 mM)
|
VNSS
|
|||
| 0–2 h | 2–6 h | 0–2 h | 2–6 h | |
| Late log phase | 1 | 1 | 0.8 | 1 |
| Onset of starvation | 1 | 0.9 | 0.5 | 1 |
| 1 day of starvation | 0.8 | 0.9 | 0.6 | 1 |
| 2 days of starvation | 0.5 | 0.4 | 0.6 | 1 |
| 4 days of starvation | 0.4 | 0.4 | 0.5 | 1 |
| 7 days of starvation | 0.3 | 0.2 | 0.4 | 0.9 |
a Relative rates of growth were calculated by dividing the growth rates observed following nutrient upshift (from 0 to 2 and 2 to 6 h after the upshift) by the maximum growth rates observed during log-phase growth. The data are the averages of results for four experiments. The maximum standard deviation was 25%.
For the experiments with upshift into VNSS medium, relative rates of growth for all periods examined showed an initial period of slower growth during the first 2 h (0.4 to 0.8), with maximum rates of growth being achieved thereafter (2 to 6 h). As for experiments with ASW-glucose, lag phases were not observed for any of the cultures examined.
Final cell densities reached >1 × 10⁹ cells/ml for all cultures after 24 to 48 h, and when cells were inoculated (1/100) into fresh 3 mM glucose-ASW, typical growth curves and maximum rates of growth were observed (data not shown).
DISCUSSION
rRNA operon copy number.
Bacteria known to possess low numbers of rRNA copies are bacteria that are involved in symbiosis or parasitism such as the marine bioluminescent symbiont from K. alfredi (39), mycoplasmas, and mycobacteria (1, 37). The low rates of growth of mycoplasmas (37) and the K. alfredi symbiont (39) correlate with their low rRNA operon copy numbers, and data presented here support this relationship. Furthermore, the finding that RB2256, a free-living bacterium, contains one rRNA operon is an important step in understanding its physiology as it contrasts with eutrophic marine bacteria, which generally contain 8 to 11 copies (39).
Insight into whether all of the rRNA operons in an organism are necessary for maintaining growth rates can be gained from the experiments of Condon et al. (7) where they used strains with one or two of the seven rRNA operons deleted. These strains could grow at near optimal rates of growth in rich media; however, when they were subjected to a nutrient upshift or temperature increase, the time taken to adjust to the new environment increased with the number of rRNA operons removed (7). In contrast, increasing the rRNA operon content above levels normally found in E. coli (with multicopy plasmids) leads to an excess of ribosomes and a metabolic drain on cells, resulting in a decreased rate of growth (36). The effect of increased rRNA operons was particularly detrimental at lower rates of growth. These data on rRNA operon copy numbers imply that multiple rRNA operons may provide advantages for rapidly growing cells responding to environmental changes, while potentially being a burden to cells growing at low rates of growth in stable, oligotrophic environments.
Ribosome numbers.
With E. coli, glucose-limited chemostat-grown cells and batch-grown cells exhibit a lag phase when responding to nutrient upshift, during which time the number of ribosomes per cell increases to accommodate the growth rate demand (15, 17). Even if the lag phase is minimal, several hours pass before the growth rate reaches maximum levels (20). In glucose-limited chemostat cultures or acetate or alanine batch cultures RB2256 displays an immediate response to nutrient addition without exhibiting a lag phase (9). This finding suggests that RB2256 does not need to increase its capacity for growth by increasing ribosome synthesis; otherwise, a lag phase would be expected. These earlier studies suggested that RB2256 may maintain a constant level of ribosome synthesis and may not be capable of altering cellular ribosome levels by regulating synthesis. Our present study, however, indicated that this is not the case, as the number of ribosomes per cell is highly regulated throughout the growth phase (Fig. 2). There is a sharp increase in ribosome content that reaches a maximum in mid-log phase, followed by an equally sharp decrease to basal levels around late-log phase and the onset of starvation.
To identify the number of ribosomes per cell that are required for the immediate resumption of maximum rates of growth following nutrient upshift, we examined the growth rate responses of cells in late log phase to 7 days of starvation following the addition of excess glucose (Fig. 3; Table 2). When transferred into ASW-glucose, cells from late log phase and the onset of starvation exhibited immediate increases in rates of growth. This result indicates that 10% of the maximum ribosome content (200 ribosomes per cell) is sufficient to allow maximum rates of growth and that the number of ribosomes per cell is not directly linked to the ability to respond to the sudden availability of nutrients; in effect, the protein synthesis capacity appears to exceed the cellular requirement for growth.
When cells were transferred to ASW-glucose after 2 to 7 days of starvation, growth rates did not immediately return to maximum rates even after 6 h. ASW-glucose medium is a defined minimal medium that provides glucose as a carbon source, vitamins, and minerals; however, for cell growth, all remaining components (e.g., amino acids and fatty acids) need to be synthesized by the cell. It is likely that during starvation, any stored reserves of carbohydrates and proteins are consumed. After carbon addition to starved cells, time is required to synthesize amino acids necessary for protein synthesis (11). The stringent control regulates protein synthesis during amino acid deprivation by repressing protein synthesis until sufficient concentrations of amino acids are available to support growth (6). It is possible that the inability of starved RB2256 cells to achieve maximum rates of growth when they are shifted into ASW-glucose is caused by a stringent response. In support of this possibility, when cells starved for up to 7 days were transferred to complex medium (Table 2), maximum rates of growth were achieved after a short period of slower growth (less than 2 h). This result indicates that if available nutrients can be imported rather than biosynthesized, the cells are poised to immediately use the components and commence growth at maximum rates.
In V. angustum S14, the pattern of response to glucose upshift in minimal versus rich medium (11) is similar to that of RB2256, with the exception that a growth lag occurs when RB2256 cells are transferred into glucose minimal medium. In RB2256, even though growth rates were reduced after 1 day of starvation (Table 2), no lag phase was observed before the resumption of growth, in comparison to a 4- or 8-h lag for S14 cells starved for 1 or 2 days, respectively, which indicates that the stringent control mechanisms in RB2256 and S14 are different.
In RB2256, the regulation of ribosome content during growth and stationary phases is not the same as in other gram-negative heterotrophs such as E. coli, Vibrio sp., and Pseudomonas putida. In E. coli growing at a rate of one doubling per h, the number of ribosomes per cell is 13,500 during log phase (4) and decreases to 4,100 during late log phase, 3,500 at the onset of starvation, and 25 after 24 h of starvation (26). In minimal marine medium, V. angustum S14 grows at a generation time of 75 min (10). Following glucose starvation, the number of ribosomes per cell decreases from 20,000 to 35,000 at the onset of starvation to 16,000 at 24 h and 8,000 at 4 days. A similar, if not more rapid, decrease in ribosome content following starvation was observed for Vibrio alginolyticus and Vibrio furnissii (21). In P. putida the ribosome content decreased to approximately 50% within 2 h of starvation but declined slowly thereafter, reaching 22% after 30 days of starvation (12). Clearly, RB2256 has adopted a different strategy. The ribosome content decreases from mid-log to late log phase, and by the time that starvation has occurred, the ribosome content has reached a steady-state level that is maintained until at least 7 days of starvation.
This different pattern in regulation may be reflected in the type of environment (oligotrophic) in which RB2256 grows and the physiology it has therefore evolved. As RB2256 is capable of growth under oligotrophic conditions, in the marine environment it rarely encounters starvation conditions. In contrast, eutrophic marine bacteria can encounter long periods of starvation (23). During starvation, Vibrio spp. (S14 and ANT-300) undergo cell miniaturization, with a concomitant decrease in the number of ribosomes (10); however, the concentration of ribosomes in the miniature cells may approximate those of newly starved cells. RB2256 on the other hand, retains a relatively constant cell volume independently of whether it is under growth or starvation conditions (30, 32). This is consistent with RB2256 maintaining constant levels of ribosomes throughout the 7 days of starvation.
Ribosome concentration and growth-limiting factors.
The low ribosome content in RB2256 correlates well with the presence of a single copy of the rRNA operon and a low maximum rate of growth (0.16 to 0.18 h−1); however, on the basis of cell volume, RB2256 has a concentration similar to that of a fast-growing E. coli strain (Table 3). During mid-log phase, at a growth rate of 0.18 h−1, the cellular concentration is 40,000 ribosomes per μm3, which is similar to the concentration in E. coli at a growth rate (2.0 h−1) more than 10 times the growth rate of RB2256. Furthermore, when E. coli is growing at 0.6 h−1 (greater than three times that of RB2256), it contains 6,200 ribosomes per μm3, a concentration of ribosomes over fivefold less than that in RB2256.
TABLE 3.
Comparisons of growth rates, ribosome contents per cell, and ribosome concentrations per cubic micrometer for RB2256, E. coli, and R. prowazekii
| Organism | Stage of growth | Growth rate (h−1) | No. of ribosomes/ cell | No. of ribosomes/ μm3 |
|---|---|---|---|---|
| RB2256 | Mid-log phase (maxi-mum content) | 0.16 | 2,000 | 40,000 |
| Onset of starvation (10% of maximum content) | 0 | 200 | 4,000 | |
| Escherichia colia | Mid-log phase | 0.6 | 6,800 | 6,200 |
| 1.0 | 13,500 | 12,300 | ||
| 1.5 | 26,300 | 23,900 | ||
| 2.0 | 45,100 | 41,000 | ||
| 2.5 | 72,000 | 65,500 | ||
| Rickettsia prowazekiib | 0.07 | 1,500 | 17,000 |
A number of possibilities to explain these observations exist. The ribosomes in RB2256 may possess a slower processivity than those in laboratory strains of E. coli, similar to that found in natural isolates of E. coli (22). This slower processivity may be a characteristic not only of the ribosomes themselves but also of auxiliary proteins such as translation initiation and elongation factors, which in effect would reduce the translational capacity of the cell. RB2256 possesses high-efficiency transport systems (33), which suggests that transport systems do not have a role in growth limitation, and clearly, even in rich medium RB2256 grows no faster than in a mineral salts solution (9).
An apparent excess of ribosomes in ultramicrobacteria (cell volume = 0.09 μm3) has also been observed in the parasite Rickettsia prowazekii (29). The rickettsiae have a generation time of about 10 h (μ = 0.07 cell h−1) when growing in the cytoplasms of their eucaryotic hosts. Their low rate of growth correlates well with a low number of ribosomes (1,500 per cell); however, the cellular concentration is 17,000 per μm3 (Table 3) (30). Similarities and differences between R. prowazekii and RB2256 include the fact that they both grow slowly, have small genome sizes, and are ultramicrobacteria; however, while RB2256 is naturally found under oligotrophic conditions, R. prowazekii is found in a nutrient-rich cytoplasm. It is possible that slowly growing heterotrophs have evolved ribosomes with reduced efficiencies in comparison to those of heterotrophs adapted to a faster pace of existence. In general, parasites such as Rickettsia, Chlamydia spp., Borrelia spp., and mycoplasmas all have small genomes and are ultramicrobacteria, which leads to the suggestion that the smaller biomass of the individual bacterium provides for a greater number of progeny from a defined substrate pool (2, 3). In the marine environment, RB2256 also has the advantage of being oligotrophic, thus enabling it to proliferate in environments that preclude competition from eutrophs.
ACKNOWLEDGMENTS
We thank Mitsuru Eguchi and Jan Gottschal for valuable discussions. Thanks also go to Matthias Dorsch for providing primers for PCR.
This work was supported by an Australian Research Council grant.
REFERENCES
- 1.Amikam D, Glaser G, Razin S. Mycoplasmas (Mollicutes) have a low number of rRNA genes. J Bacteriol. 1984;158:376–378. doi: 10.1128/jb.158.1.376-378.1984. [DOI] [PMC free article] [PubMed] [Google Scholar]
- 2.Andersson S G E, Kurland C G. Genomic evolution drives the evolution of the translation system. Biochem Cell Biol. 1995;73:775–787. doi: 10.1139/o95-086. [DOI] [PubMed] [Google Scholar]
- 3.Andersson S G E, Zommorodipur A, Winkler H H, Kurland C G. Unusual organization of the rRNA genes in Rickettsia prowazekii. J Bacteriol. 1995;177:4171–4175. doi: 10.1128/jb.177.14.4171-4175.1995. [DOI] [PMC free article] [PubMed] [Google Scholar]
- 4.Bremer H, Dennis P P. Modulation of chemical composition and other parameters of the cell by growth rate. In: Neidhardt F C, Curtiss III R, Ingraham J L, Lin E C C, Low K B, Magasanik B, Reznikoff W S, Riley M, Schaechter M, Umbarger H E, editors. Escherichia coli and Salmonella: cellular and molecular biology. 2nd ed. Vol. 2. Washington, D.C: ASM Press; 1996. pp. 1553–1569. [Google Scholar]
- 5.Button D K, Schut F, Quang P, Martin R, Robertson B R. Viability and isolation of marine bacteria by dilution culture: theory, procedures, and initial results. Appl Environ Microbiol. 1993;59:881–891. doi: 10.1128/aem.59.3.881-891.1993. [DOI] [PMC free article] [PubMed] [Google Scholar]
- 6.Cashel M, Gentry D R, Hernandez V J, Vinella D. The stringent response. In: Neidhardt F C, Curtiss III R, Ingraham J L, Lin E C C, Low K B, Magasanik B, Reznikoff W S, Riley M, Schaechter M, Umbarger H E, editors. Escherichia coli and Salmonella: cellular and molecular biology. 2nd ed. Vol. 1. Washington, D.C: ASM Press; 1996. pp. 1456–1496. [Google Scholar]
- 7.Condon C, Liveris D, Squires C, Schwartz I, Squires C L. rRNA operon multiplicity in Escherichia coli and the physiological implications of rrn inactivation. J Bacteriol. 1995;177:4152–4156. doi: 10.1128/jb.177.14.4152-4156.1995. [DOI] [PMC free article] [PubMed] [Google Scholar]
- 8.Cooper T G. The tools of biochemistry. New York, N.Y: John Wiley & Sons; 1977. [Google Scholar]
- 9.Eguchi M, Nishikawa T, MacDonald K, Cavicchioli R, Gottschal J C, Kjelleberg S. Responses to stress and nutrient availability by the marine ultramicrobacterium Sphingomonas sp. strain RB2256. Appl Environ Microbiol. 1996;62:1287–1294. doi: 10.1128/aem.62.4.1287-1294.1996. [DOI] [PMC free article] [PubMed] [Google Scholar]
- 10.Flardh K, Cohen P S, Kjelleberg S. Ribosomes exist in large excess over the apparent demand for protein synthesis during carbon starvation in marine Vibrio sp. strain CCUG 15956. J Bacteriol. 1992;174:6780–6788. doi: 10.1128/jb.174.21.6780-6788.1992. [DOI] [PMC free article] [PubMed] [Google Scholar]
- 11.Flardh K, Kjelleberg S. Glucose upshift of carbon-starved marine Vibrio sp. strain S14 causes amino acid starvation and induction of the stringent response. J Bacteriol. 1994;176:5897–5903. doi: 10.1128/jb.176.19.5897-5903.1994. [DOI] [PMC free article] [PubMed] [Google Scholar]
- 12.Givskov M, Eberl L, Moller S, Poulsen L K, Molin S. Responses to nutrient starvation in Pseudomonas putida KT 2442: analysis of general cross-protection, cell shape, and macromolecular content. J Bacteriol. 1994;176:7–14. doi: 10.1128/jb.176.1.7-14.1994. [DOI] [PMC free article] [PubMed] [Google Scholar]
- 13.Gonzales J M, Sherr E B, Sherr B F. Differential feeding by marine flagellates on growing versus starving, and on motile versus nonmotile, bacterial prey. Mar Ecol Prog Ser. 1993;102:257–267. [Google Scholar]
- 14.Gottschal, J. C. Unpublished data.
- 15.Harvey R J. Metabolic regulation in glucose-limited chemostat cultures of Escherichia coli. J Bacteriol. 1970;104:698–706. doi: 10.1128/jb.104.2.698-706.1970. [DOI] [PMC free article] [PubMed] [Google Scholar]
- 16.Hirsch P, Bernhard M, Cohen S S, Ensign J C, Jannasch H W, Koch A L, Marshall K C, Poindexter J S, Rittenberg S C, Smith D C, Veldkamp H. Life under conditions of low nutrient concentrations. In: Shilo M, editor. Strategies of microbial life in extreme environments. Weinheim, Germany: Verlag Chemie; 1979. pp. 357–372. [Google Scholar]
- 17.Jacobson A, Gillespie D. Metabolic events occurring during recovery from prolonged glucose starvation in Escherichia coli. J Bacteriol. 1968;95:1030–1039. doi: 10.1128/jb.95.3.1030-1039.1968. [DOI] [PMC free article] [PubMed] [Google Scholar]
- 18.Jouper-Jaan A, Goodman A E, Kjelleberg S. Bacteria starved for prolonged periods develop increased protection against lethal temperatures. FEMS Microbiol Rev. 1992;101:229–236. [Google Scholar]
- 19.Kiss A, Sain B, Ventianer P. The number of rRNA genes in Escherichia coli. FEBS Lett. 1977;79:77–79. doi: 10.1016/0014-5793(77)80354-2. [DOI] [PubMed] [Google Scholar]
- 20.Koch A L. Microbial growth in low concentrations of nutrients. In: Shilo M, editor. Strategies of microbial life in extreme environments. Weinheim, Germany: Verlag Chemie; 1979. pp. 261–279. [Google Scholar]
- 21.Kramer J G, Singleton F L. Variations in rRNA content of marine Vibrio spp. during starvation-survival and recovery. Appl Environ Microbiol. 1992;58:201–207. doi: 10.1128/aem.58.1.201-207.1992. [DOI] [PMC free article] [PubMed] [Google Scholar]
- 22.Mikkola R, Kurland C G. Is there a unique ribosome phenotype for naturally occurring Escherichia coli? Biochimie. 1991;73:1061–1066. doi: 10.1016/0300-9084(91)90148-t. [DOI] [PubMed] [Google Scholar]
- 23.Morita R Y. Bacteria in oligotrophic environments: starvation-survival lifestyle. New York, N.Y: Chapman & Hall; 1997. [Google Scholar]
- 24.Neidhardt F C, Ingraham J L, Schaechter M. Physiology of the bacterial cell: a molecular approach. Sunderland, Mass: Sinauer Associates, Inc.; 1990. [Google Scholar]
- 25.Nelson D R, Sadlowski Y, Eguchi M, Kjelleberg S. The starvation-stress response of Vibrio (Listonella) anguillarum. Microbiology. 1997;143:2305–2312. doi: 10.1099/00221287-143-7-2305. [DOI] [PubMed] [Google Scholar]
- 26.Nillson M, Bulow L, Wahlund K. Use of flow field-flow fractination for the rapid quantitation of ribosome and ribosomal subunits in Escherichia coli at different protein production conditions. Biotechnol Bioeng. 1997;54:461–467. doi: 10.1002/(SICI)1097-0290(19970605)54:5<461::AID-BIT6>3.0.CO;2-C. [DOI] [PubMed] [Google Scholar]
- 27.Nystrom T, Kjelleberg S. Role of protein synthesis in the cell division and starvation induced resistance to autolysis of a marine Vibrio during the initial phase of starvation. J Gen Microbiol. 1989;135:1599–1606. [Google Scholar]
- 28.Nystrom T, Olsson R M, Kjelleberg S. Survival, stress resistance, and alterations in protein expression in the marine Vibrio sp. strain S14 during starvation for different individual nutrients. Appl Environ Microbiol. 1992;58:55–65. doi: 10.1128/aem.58.1.55-65.1992. [DOI] [PMC free article] [PubMed] [Google Scholar]
- 29.Pang H, Winkler W W. The concentrations of stable RNA and ribosomes in Rickettsia prowazekii. Mol Microbiol. 1994;12:115–120. doi: 10.1111/j.1365-2958.1994.tb01000.x. [DOI] [PubMed] [Google Scholar]
- 30.Schut F. Ph.D. thesis. Groningen, The Netherlands: University of Groningen; 1993. [Google Scholar]
- 31.Schut F, de Vries E J, Gottschal J C, Robertson B R, Harder W, Prins R A, Button D K. Isolation of typical marine bacteria by dilution culture: growth, maintenance, and characteristics of isolates under laboratory conditions. Appl Environ Microbiol. 1993;59:2150–2160. doi: 10.1128/aem.59.7.2150-2160.1993. [DOI] [PMC free article] [PubMed] [Google Scholar]
- 32.Schut F, Gottschal J C, Prins R A. Isolation and characterisation of the marine ultramicrobacterium Sphingomonas sp. strain RB2256. FEMS Microbiol Rev. 1997;20:363–369. [Google Scholar]
- 33.Schut F, Jansen M, Pedro Gomes T M, Gottschal J C, Harder W, Prins R A. Substrate uptake and utilization by a marine ultramicrobacterium. Microbiology. 1995;141:351–361. doi: 10.1099/13500872-141-2-351. [DOI] [PubMed] [Google Scholar]
- 34.Schut F, Prins R A, Gottschal J C. Oligotrophy and pelagic marine bacteria: facts and fiction. Aquat Microb Ecol. 1997;12:177–202. [Google Scholar]
- 35.Simek K, Chrzanowski H. Direct and indirect evidence of size-selective grazing on pelagic bacteria by freshwater nanoflagellates. Appl Environ Microbiol. 1992;58:3715–3720. doi: 10.1128/aem.58.11.3715-3720.1992. [DOI] [PMC free article] [PubMed] [Google Scholar]
- 36.Stevenson B S, Schmidt T M. Growth rate-dependent accumulation of RNA from plasmid-borne rRNA operons in Escherichia coli. J Bacteriol. 1998;180:1970–1972. doi: 10.1128/jb.180.7.1970-1972.1998. [DOI] [PMC free article] [PubMed] [Google Scholar]
- 37.Suzuki Y, Mori T, Miyata Y, Yamada T. The number of ribosomal RNA genes in Mycobacterium lepraemurium. FEMS Microbiol Lett. 1987;44:73–76. [Google Scholar]
- 38.Wilson K. Preparation of genomic DNA from bacteria. In: Ausubel F M, Brent R, Kingston R E, Moore D D, Seidman J G, Smith J A, Struhl K, editors. Current protocols in molecular biology. Vol. 1. New York, N.Y: John Wiley and Sons, Inc.; 1994. pp. 2.4.1–2.4.5. [Google Scholar]
- 39.Wolfe C J, Haygood M G. Bioluminescent symbionts of the Caribbean flashlight fish (Kryptophanaron alfredi) have a single rRNA operon. Mol Mar Biol Biotechnol. 1993;2:189–197. [PubMed] [Google Scholar]