

Abstract
Aims
Fabry disease (FD) is a multisystemic lysosomal storage disorder caused by a defect in the alpha-galactosidase A gene that manifests as a phenocopy of hypertrophic cardiomyopathy. We assessed the echocardiographic 3D left ventricular (LV) strain of patients with FD in relation to heart failure severity using natriuretic peptides, the presence of a cardiovascular magnetic resonance (CMR) late gadolinium enhancement scar, and long-term prognosis.
Methods and results
3D echocardiography was feasible in 75/99 patients with FD [aged 47 ± 14 years, 44% males, LV ejection fraction (EF) 65 ± 6% and 51% with hypertrophy or concentric remodelling of the LV]. Long-term prognosis (death, heart failure decompensation, or cardiovascular hospitalization) was assessed over a median follow-up of 3.1 years. A stronger correlation was observed for N-terminal pro-brain natriuretic peptide levels with 3D LV global longitudinal strain (GLS, r = −0.49, P < 0.0001) than with 3D LV global circumferential strain (GCS, r = −0.38, P < 0.001) or 3D LVEF (r = −0.25, P = 0.036). Individuals with posterolateral scar on CMR had lower posterolateral 3D circumferential strain (CS; P = 0.009). 3D LV-GLS was associated with long-term prognosis [adjusted hazard ratio 0.85 (confidence interval 0.75–0.95), P = 0.004], while 3D LV-GCS and 3D LVEF were not (P = 0.284 and P = 0.324).
Conclusion
3D LV-GLS is associated with both heart failure severity measured by natriuretic peptide levels and long-term prognosis. Decreased posterolateral 3D CS reflects typical posterolateral scarring in FD. Where feasible, 3D-strain echocardiography can be used for a comprehensive mechanical assessment of the LV in patients with FD.
Keywords: Fabry disease, myocardial strain, 3D echocardiography, heart failure, cardiovascular magnetic resonance
Graphical Abstract
Graphical Abstract.

CMR, cardiovascular magnetic resonance; CS, circumferential strain; CV, cardiovascular; GLS, global longitudinal strain; LV, left ventricle.
See the editorial comment for this article ‘Echocardiography in Fabry disease: how many dimensions do we need?', by J.-U Voigt, https://doi.org/10.1093/ehjci/jead164.
Introduction
Fabry disease (FD, OMIM 301500) is a multisystemic X-linked genetic disease caused by a defect in the gene coding for the lysosomal enzyme alpha-galactosidase.1,2 Cardiac, renal, and central nervous system involvement are the major life-threatening complications. Cardiac involvement is common and morphologically manifests as concentric remodelling or hypertrophy of the left ventricle (LV), with replacement fibrosis usually located in the posterolateral wall.3,4 While LV systolic dysfunction and ventricular arrhythmias can develop at later stages, the majority of patients with FD have preserved LV ejection fraction (EF).5,6 Clinically, heart failure is a common syndrome.6,7
3D echocardiography is a unique technique that allows a full-volume acquisition of the beating heart using dedicated matrix ultrasound probes.8 Moreover, 3D myocardial strain can be analysed from these acquisitions, potentially overcoming the out-of-plane loss of speckles associated with 2D speckle-tracking strain analyses and providing true 3D deformation analysis.9,10 It has been validated by sonomicrometry, its usefulness was confirmed by clinical surrogate parameters, and it is feasible using commercially available platforms.11–13
While 2D analysis of myocardial deformation and its clinical impact on FD have been evaluated before, no data on echocardiographic 3D LV deformation have been published previously. Accordingly, our aim was to assess the feasibility of 3D echocardiographic LV strain, its relation to heart failure severity, and its impact on the long-term prognosis of patients with FD.
Methods
Study design
Current analysis is a pre-specified substudy of a systematic evaluation project for patients with genetically confirmed FD managed at the National Referral Centre for FD of the General University Hospital in Prague. This cohort has been described previously.6 Briefly, between 2016 and 2020, all patients ≥18 years with genetically proved disease were offered a diagnostic hospitalization programme including a complex assessment of FD phenotype. Informed written consent was obtained from all patients and included an agreement with hospitalization, diagnostic procedures, and analysis of anonymized clinical data for scientific purposes. The research was approved by the Ethics Committee of the General Faculty Hospital. The investigation conforms to the principles outlined in the Declaration of Helsinki.
Clinical and laboratory characteristics
Baseline characteristics including clinical assessment, echocardiography, and laboratory investigations were acquired during the index diagnostic hospitalization. The overall severity of FD manifestations was quantified using the Mainz Severity Score Index.14
Laboratory values were analysed in the clinical laboratory of the General University Hospital in Prague. In September 2017, the clinical laboratory at our hospital moved from brain natriuretic peptide (BNP) to N-terminal pro-BNP (NTproBNP) evaluation (Elecsys®; Roche Diagnostics, Basel, Switzerland). We used a validated conversion formula to calculate NTproBNP from the older BNP values for the correlation analysis.15 The estimated glomerular filtration rate (eGFR) for this conversion was calculated using the Cockroft–Gault formula, as recommended.16 For other analyses, the Chronic Kidney Disease Epidemiology Collaboration formula was used.17
2D echocardiography
Transthoracic echocardiography was acquired using the Vivid E9 and E95 machines (GE Healthcare, Chicago, IL, USA). All routine measurements were performed according to the guidelines of the American Society of Echocardiography.18 2D global longitudinal strain (GLS) was measured from the three apical windows using the GE EchoPAC v204 software.
3D echocardiography
3D full-volume data were acquired with a 3D matrix-array transducer using four to six consecutive cardiac cycles from the apical view to achieve a frame rate of ≥20 frames/s. Special care was taken to include all myocardial segments; for this, a live 12-plane image view was used.
The EchoPAC v204 workstation software’s AutoLVQ feature was utilized to perform a 3D analysis of LVEF, volumes, and speckle-tracking 3D strain. Appropriate endocardial and epicardial borders in systole and diastole were semiautomatically selected. From this, the software automatically generated strain tracking in 17 myocardial segments. The tracking was then visually reviewed for adequacy. Segments that did not track were excluded. If more than three segments could not be analysed, the whole study was excluded; otherwise, strain was calculated based on the average of the analysable segments. Four modalities of deformation were derived. Longitudinal and circumferential strain (LS and CS) describe shortening in the long axis of the ventricle and along its circumference. Area strain (AS) was defined as a change in area of mid-myocardial strain, and radial strain (RS) was derived based on the assumption of constant volume.19 The first author (J.M.) performed the 3D acquisition and analyses, J.M. and B.C. performed the interobserver analysis.
Cardiovascular magnetic resonance
If possible, subjects underwent electrocardiogram-gated cardiovascular magnetic resonance (CMR) at a 1.5-T system (Philips Gyroscan Intera T15) using a standardized protocol including late gadolinium enhancement (LGE) imaging that was analysed in this study. Images were acquired during end-expiratory breath hold. LGE images covering the LV in multiple short- and long-axis views were obtained between 1 and 15 min after an intravenous bolus of 0.2 mmol/kg gadoterate meglumine (Dotarem; Guerbet, France) with segmented inversion recovery fast gradient echo sequences (TE [echo time] 1.19 ms, TR [repetition time] 3.7 ms, flip angle 15°, matrix 209 × 164, FOV [field of view] 310 mm). All images were analysed using commercially available software (Extended MR Work Space 2.6.3.4; Philips).
Clinical follow-up and long-term prognosis
Follow-up was conducted at regular 6-month intervals and every 2 weeks for patients treated with enzyme replacement therapy at our centre. Long-term prognosis was assessed using a composite endpoint of all-cause death, heart failure decompensation (hospitalization for heart failure or emergency visit necessitating intravenous diuretic treatment), and hospitalizations due to cardiovascular reasons, including hospitalizations for arrythmias, hospitalizations because of chest pain or dyspnoea progression, or vascular causes (stroke, peripheral arterial disease, or pulmonary embolism). Investigator blinded to echocardiographic results evaluated the clinical events.
Statistical analysis
Categorical variables were represented using percentages and continuous variables using means ± standard deviation or median (25th and 75th percentiles). Differences in variables were compared with the t-test, Mann–Whitney U test or χ2 test, as appropriate. NTproBNP was log-transformed to achieve normal distribution. The Pearson correlation coefficient was used to determine the relationship between numerical variables. For NYHA class, Spearman rank correlation was used. Linear regression models were used to evaluate predictors of NTproBNP. Logistic regression model was used to evaluate the presence of LGE on CMR. Cox proportional hazards model was used for assessing long-term prognosis. In multivariate modelling, we adjusted for age, gender, and renal function. Dichotomized analysis using the median value was done with the Kaplan–Meier method and the log-rank test. Intra- and interobserver intraclass correlation coefficients and the standard error of measurement were calculated. R software version 4.1.2 (The R Foundation for Statistical Computing, Vienna, Austria) was used. A value of P < 0.05 was considered statistically significant.
Results
Population and 2D echocardiography
Out of 99 patients with 3D echocardiographic acquisition, 75 (76%) patients had adequate image quality that allowed analysis in at least 14/17 segments of the volume data set. Basic characteristics of the study population according to gender are shown in Table 1. Male patients had both overall more severe organ involvement as well as more pronounced LV morphology alterations. LV-EF was preserved in almost all patients.
Table 1.
Baseline and 2D echocardiographic data
| Variable | Total (n = 75) | Female (n = 42, 56%) | Male (n = 33, 44%) | P-value |
|---|---|---|---|---|
| Age | 47 ± 14 | 46 ± 15 | 48 ± 11 | 0.41 |
| Systolic BP (mmHg) | 130 ± 18 | 124 ± 17 | 137 ± 16 | 0.002 |
| Diastolic BP (mmHg) | 80 ± 11 | 79 ± 11 | 83 ± 12 | 0.1 |
| Heart rate (/s) | 73 ± 12 | 75 ± 11 | 71 ± 13 | 0.23 |
| BMI (kg/m2) | 25 (23, 28) | 25 (22, 28) | 26 (24, 28) | 0.69 |
| MSSI total | 16 (7, 27) | 10 (5, 18) | 26 (15, 35) | <0.001 |
| Years from FD diagnosis | 4 (1, 12) | 5 (0.25, 12) | 3 (1, 12) | 0.97 |
| Heart failure medication | ||||
| ACEi/AT1 blocker | 33% (25) | 24% (10) | 45% (15) | 0.048 |
| Beta-blockers | 25% (19) | 7% (3) | 48% (16) | <0.001 |
| Spironolactone | 1% (1) | 2% (1) | 0% (0) | 0.37 |
| Loop diuretic | 7% (5) | 2% (1) | 12% (4) | 0.09 |
| NTproBNP (ng/L) | 101 (49, 277) | 79 (44, 192) | 143 (50, 385) | 0.008 |
| NYHA class | 0.23 | |||
| I | 63% (47) | 69% (29) | 55% (18) | |
| II | 29% (22) | 26% (11) | 33% (11) | |
| III | 7% (5) | 2% (1) | 12% (4) | |
| IV | 1% (1) | 2% (1) | 0% (0) | |
| LV mass, BSA indexed (g/m2) | 94 (70, 142) | 72 (62, 94) | 140 (105, 155) | <0.001 |
| LV geometry | 0.0015 | |||
| Concentric hypertrophy | 37% (28) | 24% (10) | 55% (18) | |
| Concentric remodelling | 12% (9) | 7% (3) | 18% (6) | |
| Eccentric hypertrophy | 1% (1) | 0% (0) | 3% (1) | |
| Normal | 49% (37) | 69% (29) | 24% (8) | |
| Ejection fraction (%) | 65 ± 6 | 64 ± 6 | 66 ± 7 | 0.27 |
| Ejection fraction < 50%, % (n) | 3% (2) | 0% (0) | 6% (2) | 0.11 |
| GLS (%) | 18 ± 4 | 20 ± 4 | 15 ± 4 | <0.001 |
| GLS < 17%, % (n) | 43% (32) | 24% (10) | 67% (22) | <0.001 |
| LA volume, BSA indexed (mL/m2) | 32 (26,37) | 29 (24, 34) | 35 (28, 44) | 0.011 |
| E/e′ | 8.6 (6.9, 12.0) | 7.8 (6.0, 9.0) | 9.8 (8.2, 14.0) | <0.001 |
| Diastolic function classification (n = 66) | 0.24 | |||
| Normal | 33% (22) | 42% (17) | 19% (5) | |
| Grade I | 56% (37) | 50% (20) | 65% (17) | |
| Grade II | 8% (5) | 5% (2) | 12% (3) | |
| Grade III | 3% (2) | 3% (1) | 4% (1) | |
ACEi, angiotensin converting enzyme inhibitors; AT1, angiotensin receptor 1; BMI, body mass index; BP, blood pressure; BSA, body surface area; FD, Fabry disease; GLS, global longitudinal strain; LA, left atrium; LV, left ventricle; MSSI, Mainz severity score index.
3D echocardiography
3D echocardiographic data are presented in Table 2. Overall, 92% (1168/1275) 3D echocardiographic LV segments were analysable using myocardial strain. Females had significantly lower 3D LV volumes and 3D LV mass. 3D LV-GLS, global area strain (3D LV-GAS), and radial strain (3D LV-GRS) were all significantly higher in females (P < 0.001 for all), while 3D global circumferential strain (3D LV-GCS) was not significantly different (P = 0.25). There were significant correlations of LV volumes, mass, GLS, and EF between 2D and 3D echocardiography (P < 0.001 for all, see Supplementary data online, Table S1). Moreover, a significant correlation was noted between all the 3D strains and LV mass (P < 0.01 for all, Supplementary data online, Table S2). Furthermore, significant correlation was observed between NYHA class and 3D LV-GLS (Spearman’s rho = −0.317, P = 0.005) but not with 3D LV-GCS (P = 0.221, Supplementary data online, Table S3).
Table 2.
Baseline 3D echocardiographic data
| Variable (3D) | Female | Male | P-value |
|---|---|---|---|
| LV end-diastolic volume (mL) | 72 (66, 86) | 106 (91, 120) | <0.001 |
| LV end-systolic volume (mL) | 27 (24, 35) | 43 (29, 48) | <0.001 |
| LV ejection fraction (%) | 62 ± 5.9 | 62 ± 6.8 | 0.78 |
| LV mass (end-diastolic, g) | 172 (153, 203) | 280 (233, 320) | <0.001 |
| LV mass (end-systolic, g) | 150 (134, 172) | 245 (217, 290) | <0.001 |
| Global longitudinal strain (%) | 17 ± 4 | 12 ± 4 | <0.001 |
| Global circumferential strain (%) | 17 ± 4 | 16 ± 4 | 0.25 |
| Global area strain (%) | 29 ± 5 | 24 ± 6 | <0.001 |
| Global radial strain (%) | 47 (39, 51) | 37 (30, 46) | <0.001 |
LV, left ventricle.
Correlation between 3D echocardiography and NTproBNP
Out of 73 patients with NTproBNP value, the strongest correlations with NTproBNP were observed for 3D LV-GAS, 3-LV-GLS, and 3D LV-GRS strain (r = −0.52, P < 0.0001; r = −0.49, P < 0.0001; and r = −0.47, P < 0.0001, respectively), as shown in Figure 1. Weaker correlation was noted with 3D LV-GCS (r = −0.38, P = 0.0008). A weak correlation was observed with 3D LV-EF (r = −0.25, P = 0.036) and no correlation with 2D LV-EF (r = 0.11, P = 0.35). In multivariable linear models, all 3D LV strains but not EF remained significantly associated with NTproBNP after correcting for age, gender, and eGFR (Table 3), with 3D LV-GLS having the strongest association. No significant effect of gender on predictive value of strains was observed (P for interaction >0.5 for all).
Figure 1.

The correlation between NTproBNP, 3D LV strain, and EF. Correlation of 3D global strains is shown in the upper four scatterplots. Correlation for EF is shown in the lower two plots, with no significant correlation observed for 2D EF and borderline correlation for 3D EF.
Table 3.
Linear models for prediction of NTproBNP
| Variable (3D LV) | Unadjusted | Adjusted | ||||
|---|---|---|---|---|---|---|
| β | 95% CI | P-value | β | 95% CI | P-value | |
| Longitudinal straina | −0.16 | (−0.23, −0.10) | <0.0001 | −0.11 | (−0.18, −0.04) | 0.0020 |
| Circumferential straina | −0.16 | (−0.25, −0.07) | 0.0008 | −0.08 | (−0.15, −0.01) | 0.0350 |
| Area straina | −0.14 | (−0.19, −0.08) | <0.0001 | −0.08 | (−0.13, −0.03) | 0.0022 |
| Radial straina | −0.05 | (−0.08, −0.03) | <0.0001 | −0.03 | (−0.05, −0.01) | 0.0050 |
| Ejection fraction | −0.06 | (−0.11, −0.005) | 0.0362 | −0.02 | (−0.06, 0.03) | 0.4329 |
CI, confidence interval; LV, left ventricle.
aAll strain modalities are global strain.
CMR fibrosis
In 53 patients, CMR for scar was performed within 6 months of index hospitalization. Overall, patients with LGE had significantly higher LV mass (P < 0.001) and lower 3D LV-GLS, 3D LV-GAS, and 3D LV-GRS (P < 0.05 for all), but only a non-significant trend was observed in 3D LV-GCS (P = 0.069). 3D LV-GLS and 3D LV-GAS remained significantly associated with LGE scar after correcting for age, gender, and renal function [odds ratio, OR 0.54 (0.33–0.88); P = 0.012 and OR 0.78 (0.62–0.97); P = 0.025].
When considering LV posterolateral fibrosis and localized strain averaged over the four segments of basal and mid posterior and lateral walls, patients with posterolateral fibrosis had significantly lower localized 3D CS compared with the other regions (P = 0.009, Figure 2). There were numerical trends for AS and RS that did not reach statistical significance. 3D LS was lower overall in both scarred and non-scarred segments.
Figure 2.
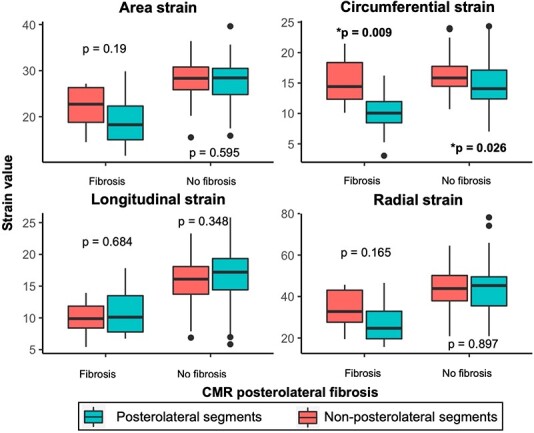
Local strain in posterolateral segments and CMR scar. Average local strain value of the four posterolateral segments and non-posterolateral segments is compared. Patients are grouped by the presence of posterolateral scarring on CMR. Tendency towards lower local strains in scarred posterolateral segments is noted for area and radial strain, and this difference is significant for circumferential strain. Longitudinal strain is diffusely decreased in all segments in patients with CMR posterolateral scar.
Long-term prognosis
Overall, there were 3 deaths, 7 heart failure decompensations, and 22 cardiovascular hospitalizations in the cohort over a median follow-up of 3.1 years. Out of the cardiovascular hospitalizations, 14 were for chest pain or dyspnoea progression (2 patients with acute coronary syndrome, 1 with coronary artery disease treated with angioplasty, 1 with coronary artery disease treated by surgical revascularization, 5 with dynamic LV outflow tract obstruction treated with alcohol septal ablation, and 5 due to chest pain/dyspnoea progression not clearly identified as heart failure decompensation), 5 patients were hospitalized because of arrhythmias (3 pacemakers for bradyarrhythmia, 1 atrial fibrillation with electrical cardioversion, 1 implantable cardioverter defibrillator due to ventricular arrhythmias), 2 patients had stroke, and 1 had pulmonary embolism. Three patients with heart failure decompensation had cardiovascular hospitalizations before. One patient who died had heart failure hospitalization before and one had cardiovascular hospitalization before. One patient was lost to follow-up.
In univariate analysis, all four types of 3D LV myocardial strain were associated with long-term prognosis (Table 4). In multivariable analysis, 3D LV-GCS was not associated with prognosis (P = 0.284) while 3D LV-GLS remained the most strongly associated (P = 0.004). Gender had no significant effect on predictive value of any of the strains (P for interaction >0.5 for all).
Table 4.
Predictors of long-term prognosis using Cox model analysis
| Variable (3D LV) | Unadjusted | Adjusted | ||||
|---|---|---|---|---|---|---|
| HR | 95% CI | P-value | HR | 95% CI | P-value | |
| Longitudinal straina | 0.79 | (0.72, 0.87) | <0.0001 | 0.85 | (0.75,0.95) | 0.004 |
| Circumferential straina | 0.87 | (0.77, 0.98) | 0.018 | 0.94 | (0.85,1.10) | 0.284 |
| Area straina | 0.87 | (0.82, 0.93) | <0.0001 | 0.93 | (0.86,1.00) | 0.04 |
| Radial straina | 0.93 | (0.90, 0.97) | 0.0001 | 0.96 | (0.93,1.00) | 0.038 |
| Ejection fraction | 1.03 | (0.96, 1.10) | 0.424 | 1.03 | (0.97,1.1) | 0.324 |
CI, confidence interval; HR, hazard ratio; LV, left ventricle.
aGlobal strain.
Using dichotomization by median values, 3D LV-GCS and 3D LV-EF were not associated with prognosis, while 3D LV-GLS, 3D LV-GAS, and 3D LV-GRS had significant association, with association for 3D LV-GLS being the strongest (Figure 3).
Figure 3.

Long-term prognosis (survival without HF decompensation or CV hospitalization). On the left side of the image, Kaplan–Meier plot of 3D GLS, which showed the highest statistical difference, is shown. On the right side of the image, results for 3D global area, radial and circumferential strains along with EF, are shown. No significant survival difference was noted for 3D GCS and 3D EF. Population was divided by the median strain and EF values, with curves showing survival of patients with values below the median compared to survival of patients with values above the median. *The last follow-up of patients in the below median longitudinal strain arm was 4.99 years. HF, heart failure; CV, cardiovascular; EF, ejection fraction.
Reproducibility
Inter- and intraobserver variabilities were assessed on a random sample of 20 patients and are shown in Table 5.
Table 5.
Inter- and intraobserver variabilities
| Variable (3D LV) | Intraobserver | Interobserver | ||
|---|---|---|---|---|
| ICC (95%CI) | SEM | ICC (95%CI) | SEM | |
| Longitudinal strain | 0.96 (0.93–0.99) | 0.77 | 0.97 (0.92–0.98) | 0.74 |
| Circumferential strain | 0.84 (0.68–0.92) | 1.27 | 0.84 (0.68–0.92) | 1.27 |
| Area strain | 0.94 (0.88–0.97) | 1.22 | 0.94 (0.87–0.97) | 1.36 |
| Radial strain | 0.93 (0.85–0.97) | 2.78 | 0.93 (0.86–0.97) | 2.83 |
CI, confidence interval; ICC, intraclass correlation coefficient; LV, left ventricle; SEM, standard error of measurement.
Discussion
To our knowledge, this is the first study showing 3D echocardiographic analysis with myocardial LV strain in patients with FD. We have shown in our data that (i) 3D transthoracic echocardiography with strain analysis is feasible in most patients with FD; (ii) 3D LV-GLS correlates strongly with NTproBNP levels, even adjusting for age, gender, and renal function, while 3D LV-GCS does not; (iii) 3D LV-GLS predicts the long-term prognosis of patients with FD, mainly cardiovascular hospitalizations; and (iv) decreased regional 3D CS at LV posterolateral segments reflects the presence of typical FD-related myocardial scar depicted by LGE.
Comparison of 3D to 2D strain patterns in FD
The role of 2D-derived speckle-tracking imaging in FD has been shown previously. Shanks et al. analysed 16 patients with FD, 9 of them with LV hypertrophy. They have demonstrated that patients with FD have lower 2D GLS compared with healthy controls, but did not observe any difference in 2D GCS.20
We have shown that 3D LV-GLS correlates negatively with LV hypertrophy, while only weak correlation was observed for 3D LV-GCS. This can explain why Shanks et al. have found no difference between 2D GCS in healthy controls and patients with FD. Moreover, their 2D GCS analysis was limited to only six LV segments in mid-level short axis, while our 3D data allow the analysis of 3D LV-GCS using all segments. Our observations are consistent with those reported in hypertrophic cardiomyopathy patients. Using 3D echocardiography, Voilliot et al. have shown a significant decrease in 3D LV-GLS in hypertrophic cardiomyopathy patients compared with controls. On the other hand, no difference in 3D LV-GCS was noted between control group and hypertrophic cardiomyopathy patients.21 The same pattern observed in our patients probably reflects the fact that increased LV mass in FD is also dominantly caused by true hypertrophy of the LV myocardium as opposed to sphingolipid accumulation.5
Spinelli et al.22 have demonstrated that patients with FD show early deterioration in 2D RS even at a pre-hypertrophic stage and have found significant associations of GLS with LV hypertrophy. However, no significant association was observed between LV hypertrophy and 2D GCS or GRS. In our data set, we have shown a similar association of 3D LV-GLS with LV hypertrophy but have also shown a correlation with 3D LV-GAS and, albeit weaker, with 3D LV-GCS and 3D LV-GRS. This might again show an advantage of full-volume 3D acquisition in comparison with the approach of Spinelli et al., who have used an average of basal and apical segments from 2D data set. A different method of RS based on volume conservation that is used in our 3D analysis might have also affected the results.19 More recently, Lu et al.23 and Esposito et al.24 have shown that 2D GLS is impaired in patients with FD with or without LV hypertrophy.
Posterolateral LV scar and strain
Previous studies in FD have shown that myocardial deformation is lower in posterolateral segments with an LGE-detected scar.25 In our patients with LGE posterolateral scar, 3D LS was perhaps not surprisingly low in all segments, scarred as well as non-scarred, due to intrinsic myocardial disease in the majority of patients that had posterolateral LGE. However, in posterolateral segments with LV scarring, not only local 3D LS, but also local 3D CS was significantly decreased, while being relatively more preserved in non-scarred segments. This is similar to an observation reported in patients with ischaemic cardiomyopathy, where LGE-based localized scar presence was shown to have a stronger association with 3D local CS when compared with 3D local LS.26
Heart failure severity
Others have shown that in patients with FD, 2D GLS was associated with NYHA class; however, they did not report on the association with GCS.27 We have shown similar results for heart failure severity with 3D LV-GLS not only for NYHA class, but also using the more objective NTproBNP values. A similarly strong association with NTproBNP was also observed for the 3D-unique 3D LV-GAS. Furthermore, a significant, but weaker correlation was shown for 3D LV-GCS and 3D LV-GRS.
Long-term prognosis
In a general inpatient population, 3D LV-GLS has been established as a strong predictor of prognosis and possibly better than 2D GLS in patients with LV-EF 30–50%.28,29 However, its prognostic value in FD has not been proved before. Zada et al.30 have shown in 43 patients that local basal 2D GLS can be associated with major adverse cardiac events in patients with FD in the long term. We have shown a similar result using the conceptually simpler 3D LV-GLS without any specific segment selection. Our conclusions regarding 3D GLS are also supported by Spinelli et al., who have shown a prognostic value of 2D GLS in predicting long-term prognosis in patients with FD in a retrospective setting as well as by our own work in a larger set using 2D GLS.6,22
Limitations
The main limitation of 3D echocardiography is the limited feasibility of acquisitions. An adequate apical window that allows visualization of the whole LV is difficult to achieve. Furthermore, gated acquisitions over four to six heart cycles were needed, leading to possible stitching artefacts.8 In our data set, 76% patients had adequate image quality to perform 3D echo analysis and only 92% of their segments were analysable. This is a little lower than feasibilities reported in some other studies.11 However, feasibility of 3D GLS in European patients is reported to be 81%, which is comparable with our data.10 Intra- and interobserver variabilities were good to excellent and comparable with previous publications using the same software platform.11
Another limitation is the direct comparison of segments from 3D echocardiography to localized magnetic resonance imaging scar. Only 53 of our patients had CMR studies within 6 months of index hospitalization. Furthermore, to obtain stable measurements, we have used an average over the four posterolateral segments, where the scar is localized in FD. Average over specific regions has been shown to be feasible using territorial-based 3D strains in patients with coronary artery disease, and in our case, it illustrates the difference in the behaviour of GCS and GLS in scarred posterolateral segments.31
A significant limitation is also the low number of clinical events, which limits the statistical power of our analyses, as well as the heterogeneity of the population. Also, due to the high correlation between 2D and 3D GLS, we could not show any difference or superiority of 3D GLS. However, this is primarily a hypothesis-generating study that should be verified in a larger, preferentially multicentric, setting.
Conclusion
Transthoracic 3D echocardiography with strain analysis is feasible for most patients with FD. 3D LV-GLS correlates strongly with NTproBNP levels and predicts the long-term prognosis of patients with FD. 3D LV-GCS is only weakly associated with NTproBNP levels and not with adjusted long-term prognosis; however, decreased local 3D CS reflects the presence of LV posterolateral scarring on CMR. 3D echocardiography might be used for a comprehensive mechanical assessment of LV in patients with FD, but technological advancements in image acquisition and analysis are needed.
Supplementary data
Supplementary data are available at European Heart Journal - Cardiovascular Imaging online.
Supplementary Material
Acknowledgements
The authors thank Veronika Dostálová, Blanka Sedláčková, Radka Trčková, Renata Valentová, Markéta Křečková, Jitka Vlčková, and all other personnel at our hospital involved in the programme for their efforts in providing high-quality care.
Contributor Information
Josef Marek, 2nd Department of Medicine – Department of Cardiovascular Medicine, First Faculty of Medicine, Charles University and General University Hospital, U nemocnice 2, Prague 2, 128 02, Czech Republic.
Barbora Chocholová, 2nd Department of Medicine – Department of Cardiovascular Medicine, First Faculty of Medicine, Charles University and General University Hospital, U nemocnice 2, Prague 2, 128 02, Czech Republic.
Daniel Rob, 2nd Department of Medicine – Department of Cardiovascular Medicine, First Faculty of Medicine, Charles University and General University Hospital, U nemocnice 2, Prague 2, 128 02, Czech Republic.
Tomáš Paleček, 2nd Department of Medicine – Department of Cardiovascular Medicine, First Faculty of Medicine, Charles University and General University Hospital, U nemocnice 2, Prague 2, 128 02, Czech Republic.
Martin Mašek, Radiology Department, First Faculty of Medicine, Charles University and General University Hospital, Prague, Czech Republic.
Gabriela Dostálová, 2nd Department of Medicine – Department of Cardiovascular Medicine, First Faculty of Medicine, Charles University and General University Hospital, U nemocnice 2, Prague 2, 128 02, Czech Republic.
Aleš Linhart, 2nd Department of Medicine – Department of Cardiovascular Medicine, First Faculty of Medicine, Charles University and General University Hospital, U nemocnice 2, Prague 2, 128 02, Czech Republic.
Funding
This study was supported by MH CZ-DRO-VFN64165, VFN: General University Hospital in Prague and the Charles University Research programme ‘Cooperatio—Cardiovascular Science’.
Data availability
The data underlying this article will be shared on reasonable request to the corresponding author.
References
- 1. Ortiz A, Germain DP, Desnick RJ, Politei J, Mauer M, Burlina A et al. Fabry disease revisited: management and treatment recommendations for adult patients. Mol Genet Metab 2018;123:416–27. [DOI] [PubMed] [Google Scholar]
- 2. Desnick RJ, Brady R, Barranger J, Collins AJ, Germain DP, Goldman M et al. Fabry disease, an under-recognized multisystemic disorder: expert recommendations for diagnosis, management, and enzyme replacement therapy. Ann Intern Med 2003;138:338–46. [DOI] [PubMed] [Google Scholar]
- 3. Pieroni M, Moon JC, Arbustini E, Barriales-Villa R, Camporeale A, Vujkovac AC et al. Cardiac involvement in Fabry disease: JACC review topic of the week. J Am Coll Cardiol 2021;77:922–36. [DOI] [PubMed] [Google Scholar]
- 4. Linhart A, Lubanda JC, Palecek T, Bultas J, Karetová D, Ledvinová J et al. Cardiac manifestations in Fabry disease. J Inherit Metab Dis 2001;24(Suppl. 2):75–83; discussion 65. [DOI] [PubMed] [Google Scholar]
- 5. Perry R, Shah R, Saiedi M, Patil S, Ganesan A, Linhart A et al. The role of cardiac imaging in the diagnosis and management of Anderson-Fabry disease. JACC Cardiovasc Imaging 2019;12:1230–42. [DOI] [PubMed] [Google Scholar]
- 6. Rob D, Marek J, Dostalova G, Linhart A. Heart failure in Fabry disease revisited: application of current heart failure guidelines and recommendations. ESC Heart Fail 2022;9:4043–52. [DOI] [PMC free article] [PubMed] [Google Scholar]
- 7. Linhart A, Germain DP, Olivotto I, Akhtar MM, Anastasakis A, Hughes D et al. An expert consensus document on the management of cardiovascular manifestations of Fabry disease. Eur J Heart Fail 2020;22:1076–96. [DOI] [PubMed] [Google Scholar]
- 8. Lang RM, Badano LP, Tsang W, Adams DH, Agricola E, Buck T et al. EAE/ASE recommendations for image acquisition and display using three-dimensional echocardiography. Eur Heart J Cardiovasc Imaging 2012;13:1–46. [DOI] [PubMed] [Google Scholar]
- 9. Muraru D, Niero A, Rodriguez-Zanella H, Cherata D, Badano L. Three-dimensional speckle-tracking echocardiography: benefits and limitations of integrating myocardial mechanics with three-dimensional imaging. Cardiovasc Diagn Ther 2018;8:101–17. [DOI] [PMC free article] [PubMed] [Google Scholar]
- 10. Nabeshima Y, Seo Y, Takeuchi M. A review of current trends in three-dimensional analysis of left ventricular myocardial strain. Cardiovasc Ultrasound 2020;18:23. [DOI] [PMC free article] [PubMed] [Google Scholar]
- 11. Luis SA, Yamada A, Khandheria BK, Speranza V, Benjamin A, Ischenko M et al. Use of three-dimensional speckle-tracking echocardiography for quantitative assessment of global left ventricular function: a comparative study to three-dimensional echocardiography. J Am Soc Echocardiogr 2014;27:285–91. [DOI] [PubMed] [Google Scholar]
- 12. Kleijn SA, Brouwer WP, Aly MFA, Rüssel IK, de Roest GJ, Beek AM et al. Comparison between three-dimensional speckle-tracking echocardiography and cardiac magnetic resonance imaging for quantification of left ventricular volumes and function. Eur Heart J Cardiovasc Imaging 2012;13:834–9. [DOI] [PubMed] [Google Scholar]
- 13. Seo Y, Ishizu T, Enomoto Y, Sugimori H, Yamamoto M, Machino T et al. Validation of 3-dimensional speckle tracking imaging to quantify regional myocardial deformation. Circ Cardiovasc Imaging 2009;2:451–9. [DOI] [PubMed] [Google Scholar]
- 14. Beck M. The Mainz Severity Score Index (MSSI): development and validation of a system for scoring the signs and symptoms of Fabry disease. Acta Paediatr Suppl 2006;95:43–6. [DOI] [PubMed] [Google Scholar]
- 15. Kasahara S, Sakata Y, Nochioka K, Miura M, Abe R, Sato M et al. Conversion formula from B-type natriuretic peptide to N-terminal proBNP values in patients with cardiovascular diseases. Int J Cardiol 2019;280:184–9. [DOI] [PubMed] [Google Scholar]
- 16. Cockcroft DW, Gault MH. Prediction of creatinine clearance from serum creatinine. Nephron 1976;16:31–41. [DOI] [PubMed] [Google Scholar]
- 17. Levey AS, Stevens LA, Schmid CH, Zhang YL, Castro AF, Feldman HI et al. A new equation to estimate glomerular filtration rate. Ann Intern Med 2009;150:604–12. [DOI] [PMC free article] [PubMed] [Google Scholar]
- 18. Lang RM, Badano LP, Mor-Avi V, Afilalo J, Armstrong A, Ernande L et al. Recommendations for cardiac chamber quantification by echocardiography in adults: an update from the American Society of Echocardiography and the European Association of Cardiovascular Imaging. Eur Heart J Cardiovasc Imaging 2015;16:233–70. [DOI] [PubMed] [Google Scholar]
- 19. Galderisi M, Esposito R, Schiano-Lomoriello V, Santoro A, Ippolito R, Schiattarella P et al. Correlates of global area strain in native hypertensive patients: a three-dimensional speckle-tracking echocardiography study. Eur Heart J Cardiovasc Imaging 2012;13:730–8. [DOI] [PubMed] [Google Scholar]
- 20. Shanks M, Thompson RB, Paterson ID, Putko B, Khan A, Chan A et al. Systolic and diastolic function assessment in Fabry disease patients using speckle-tracking imaging and comparison with conventional echocardiographic measurements. J Am Soc Echocardiogr 2013;26:1407–14. [DOI] [PubMed] [Google Scholar]
- 21. Voilliot D, Huttin O, Hammache N, Filippetti L, Vaugrenard T, Aliot E et al. Impact of global and segmental hypertrophy on two-dimensional strain derived from three-dimensional echocardiography in hypertrophic cardiomyopathy: comparison with healthy subjects. J Am Soc Echocardiogr 2015;28:1093–102. [DOI] [PubMed] [Google Scholar]
- 22. Spinelli L, Giugliano G, Imbriaco M, Esposito G, Nappi C, Riccio E et al. Left ventricular radial strain impairment precedes hypertrophy in Anderson-Fabry disease. Int J Cardiovasc Imaging 2020;36:1465–76. [DOI] [PubMed] [Google Scholar]
- 23. Lu D-Y, Huang W-M, Wang W-T, Hung S-C, Sung S-H, Chen C-H et al. Reduced global longitudinal strain as a marker for early detection of Fabry cardiomyopathy. Eur Heart J Cardiovasc Imaging 2022;23:487–95. [DOI] [PubMed] [Google Scholar]
- 24. Esposito R, Galderisi M, Santoro C, Imbriaco M, Riccio E, Maria Pellegrino A et al. Prominent longitudinal strain reduction of left ventricular basal segments in treatment-naïve Anderson-Fabry disease patients. Eur Heart J Cardiovasc Imaging 2019;20:438–45. [DOI] [PubMed] [Google Scholar]
- 25. Krämer J, Niemann M, Liu D, Hu K, Machann W, Beer M et al. Two-dimensional speckle tracking as a non-invasive tool for identification of myocardial fibrosis in Fabry disease. Eur Heart J 2013;34:1587–96. [DOI] [PubMed] [Google Scholar]
- 26. Thorstensen A, Dalen H, Hala P, Kiss G, D’hooge J, Torp H et al. Three-dimensional echocardiography in the evaluation of global and regional function in patients with recent myocardial infarction: a comparison with magnetic resonance imaging. Echocardiography 2013;30:682–92. [DOI] [PubMed] [Google Scholar]
- 27. Morris DA, Blaschke D, Canaan-Kühl S, Krebs A, Knobloch G, Walter TC et al. Global cardiac alterations detected by speckle-tracking echocardiography in Fabry disease: left ventricular, right ventricular, and left atrial dysfunction are common and linked to worse symptomatic status. Int J Cardiovasc Imaging 2015;31:301–13. [DOI] [PubMed] [Google Scholar]
- 28. Medvedofsky D, Maffessanti F, Weinert L, Tehrani DM, Narang A, Addetia K et al. 2D and 3D echocardiography-derived indices of left ventricular function and shape: relationship with mortality. JACC Cardiovasc Imaging 2018;11:1569–79. [DOI] [PMC free article] [PubMed] [Google Scholar]
- 29. Medvedofsky D, Lang RM, Weinert L, Tehrani DM, Narang A, Mor-Avi V. 3D echocardiographic global longitudinal strain can identify patients with mildly-to-moderately reduced ejection fraction at higher cardiovascular risk. Int J Cardiovasc Imaging 2019;35:1573–9. [DOI] [PubMed] [Google Scholar]
- 30. Zada M, Lo Q, Boyd AC, Bradley S, Devine K, Denaro CP et al. Basal segmental longitudinal strain: a marker of subclinical myocardial involvement in Anderson-Fabry disease. J Am Soc Echocardiogr 2021;34:405–413.e2. [DOI] [PubMed] [Google Scholar]
- 31. de Knegt MC, Fuchs A, Weeke P, Møgelvang R, Hassager C, Kofoed KF. Optimisation of coronary vascular territorial 3D echocardiographic strain imaging using computed tomography: a feasibility study using image fusion. Int J Cardiovasc Imaging 2016;32:1715–23. [DOI] [PubMed] [Google Scholar]
Associated Data
This section collects any data citations, data availability statements, or supplementary materials included in this article.
Supplementary Materials
Data Availability Statement
The data underlying this article will be shared on reasonable request to the corresponding author.