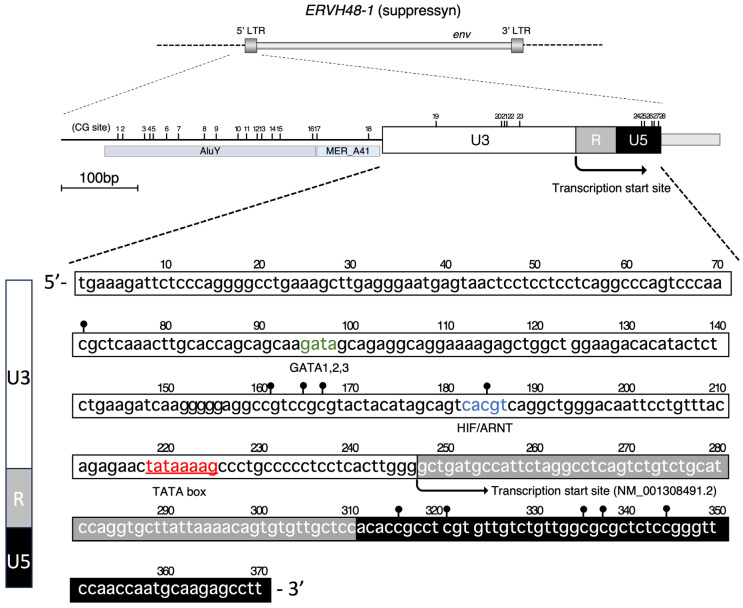
Figure 1.
Schematic diagram of the suppressyn promoter region. The top panel shows the genome structure encoding suppressyn (ERVH48-1), and the middle panel shows an enlarged schematic of the 5′ LTR (long terminal repeat) and 5′ flanking regions. Lollipops indicate predicted CpG methylation sites. The lower panel shows the 5′ LTR sequence, with white outlining the U3, grey outlining the R, and black outlining the U5 regions. Arrows indicate the transcription start point of the NM001308491.2 transcript. Red lettering indicates TATA sequences, blue indicates predicted binding sequences for the HIF/ARNT complex, and green indicates predicted binding sequences for GATA transcription family members.

