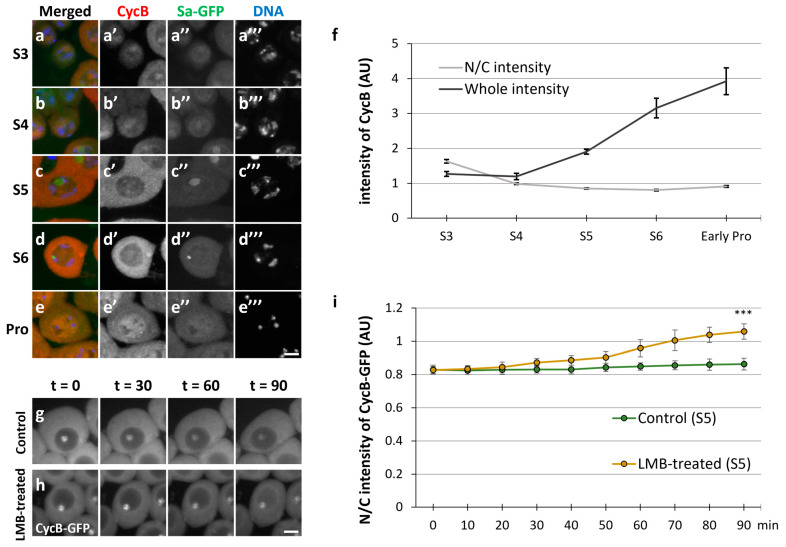
Figure 1.
Nuclear–cytoplasmic shuttling of cyclin B in spermatocytes during the growth phase. (a–e) Anti-Cyclin B (CycB) immunostaining of spermatocytes with anti-cyclin B (CycB) antibody from the growth phase (S3–S6 in (a–d)) to the onset of meiosis (prophase I (Pro) in (e)). Images show CycB immunofluorescence (red in (a–e), white in (a’–e’)), Sa-GFP fluorescence for visualizing the nucleolus (green in (a–e), white in (a’’–e’’)), and DNA staining with 4′,6-diamidino-2-phenylindole (DAPI) (blue in (a–e), white in (a’’’–e’’’)). Scale bar: 10 μm. (f) Quantification of CycB immunofluorescence intensity in whole spermatocytes (black line) and nuclei relative to that in the cytoplasm of spermatocytes (gray line) at each stage represented in (a–e). Intensities of the immunofluorescence in spermatocytes at the S3 to ProI phases were individually measured in whole cell regions, the cytoplasm, and the nucleus. The mean intensity value in the whole region was calculated at each stage, displayed on the y-axis (arbitrary unit: AU), and drawn with a black line. The ratio of the intensity in the cytoplasm to that in the nucleus (N/C intensity) was displayed by a gray line. Data represent means ± 95% confidence intervals (CIs) (>16 cells). (g,h) Time-lapse observation of CycB in the growth phase (S5) of living spermatocytes expressing CycB–GFP and treated with leptomycin B (LMB) (h) and that of untreated cells (g). Ninety images were captured every minute. Four selected images of a live spermatocyte are presented. Scale bar: 10 μm. (i) Comparative quantification of nuclear GFP fluorescence intensity relative to cytoplasmic intensity in LMB-treated (orange line) and untreated (green line) spermatocytes expressing CycB–GFP. The intensities of CycB-GFP in the whole regions of the cells at the time indicated by t = 0 to 90 min were measured. The ratio of the intensity in the cytoplasm to that in the nucleus (N/C intensity) was displayed on the y-axis (with a green line (control cells at S5) and an orange line (the cells treated with LMB)). Data represent means ± 95% CIs (11 untreated and 8 LMB-treated spermatocytes). Significance was tested between control cells and LMB-treated cells at the last time point (t = 90). *** p < 0.001 (Mann–Whitney test).

