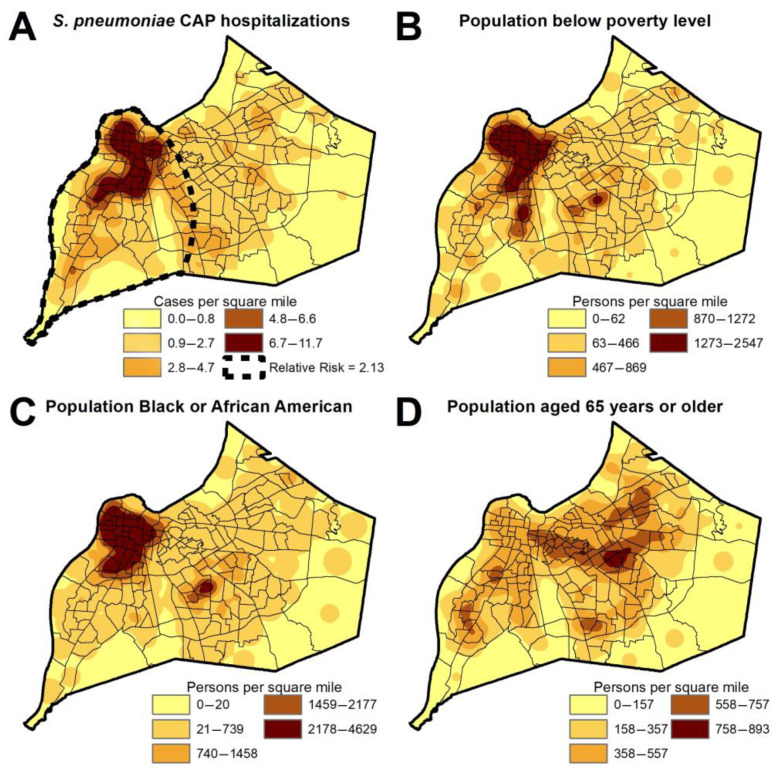
Figure 4.
Heat maps of the city of Louisville for patients hospitalized with S. pneumoniae CAP (A), population living in poverty (B), population that identifies as Black or African American race (C), and population that is aged 65 years or older (D). The area of relative risk for hospitalization with S. pneumoniae CAP in the west part of the city is depicted by the dotted line in map (A).

