

Abstract
Runx factors are essential for lineage specification of various hematopoietic cells, including T lymphocytes. However, they regulate context-specific genes and occupy distinct genomic regions in different cell types. Here, we show that dynamic Runx binding shifts in murine early T cell development are mostly not restricted by local chromatin state but regulated by Runx dosage and functional partners. Runx co-factors compete to recruit a limited pool of Runx factors in early T-progenitors, and a modest increase in Runx protein availability at pre-commitment stages causes premature Runx occupancy at post-commitment binding sites. This increased Runx factor availability results in striking T-lineage developmental acceleration by selectively activating T-identity and innate lymphoid cell programs. These programs are collectively regulated by Runx together with other, Runx-induced transcription factors that co-occupy Runx target genes and propagate gene network changes.
Introduction
Runx family transcription factors (Runx1, Runx2, Runx3, and their cofactor CBFβ) are important for T cell development from the earliest steps in the lineage, playing partially redundant roles1–5. However, they are also vital for the establishment of hematopoietic stem cells in early embryos6 and for generation of B cells and megakaryocytes throughout life7–11, quite different programs. Runx target motifs are consistently highly enriched around open chromatin sites and lineage-specific transcription factor (TF) binding sites in multiple hematopoietic lineages1,12–19, suggesting a common contribution to active enhancers generally. However, Runx factors regulate different target genes to mediate distinct stage-specific functions, by switching the genomic sites they occupy at different stages of early T cell development1. Thus, key questions are how Runx factors guide their contributions to distinct cell programs, whether by intrinsic DNA-binding sequence specificity, epigenetic constraints, or interactions with other partner factors.
Notch signaling and other microenvironmental cues within the thymus convert multipotent progenitor cells to T cells. They traverse a series of CD4−CD8− double negative (DN) pro-T stages (DN1-4), then CD4+CD8+ double-positive (DP) stage, before becoming mature CD4 or CD8 single-positive (SP) T cells. These stages are distinguished by changes in chromatin states and changes in expression of a discrete set of regulatory factors20–23. Pro-T cells in the c-Kit+ DN1 (or “ETP”) and DN2a stages (“Phase 1”) still resemble hematopoietic stem and progenitor cells (HSPC) in regulatory gene expression and chromatin state and can still produce non-T lineage cells. T-lineage commitment normally occurs in transition from DN2a to DN2b stages with up-regulation of T cell identity genes (“Phase 2”), and this post-commitment stage extends till successful assembly of T cell receptor β (TCRβ) in DN3 stage. Runx factors are crucial for progression through both Phases1. Although Runx1 and Runx3 act differently in other contexts24, they appear functionally redundant in pro-T cells1. However, they both bind to different genomic sites and regulate different target genes from Phase 1 to Phase 2.
Here, we evaluated the chromatin constraints on Runx action across the Phase 1 and Phase 2 stages of T cell development and tested the hypothesis that Runx binding site shifts depend on competition between Phase 1 and Phase 2 partners for a limiting amount of Runx protein. We found that at modest excess, when no longer titrated by Phase 1 partners, Runx factors directed a distinctive accelerated form of early T and innate-like cell development, relieving the need to repress most Phase 1 regulators before T-lineage regulatory genes could be upregulated. Both direct (binding site-mediated) and indirect mechanisms propagated through a Runx-dependent gene regulatory network drove this acceleration. Thus, availability of Runx factors for their target sites at each stage is a major timing controller of the deployment of the T cell specification gene regulatory network.
Results
Runx TFs repeatedly shift binding sites during T development
Stages in T cell development can be distinguished by changes in cell-surface markers plus Bcl11b expression, which marks lineage commitment25 (Fig. 1a). Runx1 and Runx3 change expression only slightly from DN1 stage to T-lineage commitment, while Runx2 levels are substantially lower, and the total numbers of Runx1 and/or Runx3 genomic occupancy sites remain constant1,22. However, Runx factors interact with different genomic regions in pre-commitment stages than in post-commitment stages1. Cell type-specific binding is seen especially at non-promoter sites, which are much better correlated with target gene regulation by Runx factors than the promoter sites1. Fig. 1b shows that in different hematopoietic lineage contexts from HSPCs to mature T cells, B lineage and megakaryocyte-precursor cells14,26–29, Runx factors preferentially occupied distinct genomic regions in each (Fig. 1b, A–F), with only ~10% of sites shared in all (Fig. 1b, G). This site infidelity of Runx factors contrasted with binding patterns in pro-T cells of PU.1, a critical Phase 1-specific TF, which showed more similar binding site choices from HSPCs to DN2b pro-T cells (Extended Data Fig. 1a). Importantly, each cluster of Runx binding regions from HSPC to mature T cells harbored a distinct set of motifs in addition to the Runx motif, in which motifs for EBF, PU.1, E2A, TCF1, GATA, and ETS factors were differentially enriched in each cluster (Extended Data Fig. 1b). The shifts were not an artifact of indirect binding via protein-protein crosslinking, which could have contributed to previous data using ChIP-seq for Runx1,30. Here, all Runx DNA binding profiles in pro-T cells were newly defined using cross-linking-independent CUT&RUN31 (C&R)(see Supplementary Note 1, Extended Data Figs. 1c–e and 2a,b for detailed comparisons). These results suggested that Runx factors changed binding sites during T cell development to interact with distinct regions potentially occupied by different TF partners.
Figure 1. Runx TFs readily shift DNA binding site choice at different stages of T cell development largely independent of chromatin state changes.

a, Schematic diagram shows different stages of T cell development. Hematopoietic stem and progenitor cells (HSPC), double negative (DN), double positive (DP), single positive (SP), and regulatory T cells (Treg). Representative flow cytometry plots (right) show cKit, CD25, and Bcl11b expression patterns in distinct DN populations. Note: “DN1” throughout this report refers only to cKithigh DN1, also known as Early T Progenitor (ETP) cells. Flow cytometry data were obtained from artificial thymic organoid (ATO) culture on day 9. b, Runx1 and Runx3 occupancy patterns in non-promoter regions of indicated cell populations are shown as peak-centered heatmaps. Runx binding profiles in DN1 and DN3 were detected by C&R from 2 independent experiments (merged data shown), and others were reported using ChIP-seq14,26–29. MK, Maturing megakaryocytes. Numbers indicate the percent of group among total Runx binding sites. c, Diagram illustrates the key marker gene expression patterns in early T cell development with associated levels of Runx1+Runx3 protein (left). Different groups of non-promoter Runx binding sites in early T-development are defined (right). d, Runx1 and Runx3 occupancy patterns in Phase 1 and Phase 2 cells are shown together with ATAC and H3K4me2 profiles22,23. Stage-specific Runx binding groups were determined by C&R using DN1 (cKithi CD25−) cells obtained from in vitro OP9-Dll1 culture and thymic DN3 (cKitlow CD44low CD25+) cells. e, Representative UCSC genome browser tracks for Runx C&R (independent replicates), and published ATAC-seq, and ChIP-seq data for H3K4me2, H3K27me3, CTCF, and SMC3 are shown22,23,34. Chromatin states computed by ChromHMM are displayed as a colormap at the bottom. P1, P2: Phase 1, Phase 2. Representative Phase 1-preferential Runx binding sites (near Hhex, left) and Phase 2-preferential sites (near Ets1, right) are displayed. The regions of interest are highlighted with shade. f, g, Motif analysis was conducted within continually open chromatin sites possessing different developmental patterns of Runx binding. f, Runx motif frequency within a peak (left, histograms) and the best Runx motif quality (position weight matrix score) within each peak (right, violin plots) are shown. The dotted horizontal line on the violin plot indicates threshold motif quality to score as possessing a Runx motif. Thin vertical black lines mark minima to maxima values and thick vertical black boxes show 25th to 75th percentiles range. Red bars with white circles indicate median values. Two sample Kolmogorov-Smirnov (KS) tests, comparing each to Group 3 motif scores: *** P = 6.924e-41 for Group 1, P = 8.18e-68 for Group 2, P = 1.18e-320 for Promoter. n of Group 1 peaks = 3,549, n of Group 2 peaks = 5,459, n of Group 3 peaks = 9,682, n of Promoter peaks = 10,698. g, Motif frequencies of PU.1, E2A, and ETS factors in each Runx binding site Group are displayed.
Runx factors do not follow local chromatin accessibility
Runx binding shifts could be caused by chromatin state changes at large or local scales, or by individual-site interaction with partner factors. To test whether Runx TFs were constrained or redirected by large-scale chromatin remodeling during commitment, the non-promoter Runx binding sites were categorized into three groups: Phase 1-preferential binding sites (Group 1), Phase 2-preferential binding sites (Group 2), and stably occupied sites (Group 3) (Fig. 1c). We analyzed how Runx binding was correlated with “active” (A) or “inactive” (B) large-scale nucleome compartments32 by comparing the principal component 1 (PC1) values of the previously reported Hi-C correlation matrices from ETP (DN1), DN2, and DN3 cells21. Runx binding sites were preferentially enriched within the A compartment (84-92%) and were depleted from the B compartment (3-7%) in all site Groups, regardless of whether C&R or ChIP-seq was used to detect Runx binding (Extended Data Fig. 2b–e; note Ets1 flanking regions). The great majority were also scored as locally accessible as defined by assay of transposase accessible chromatin (ATAC), even the Runx binding sites in the “inactive” B compartment (Extended Data Fig. 2c). As pro-T cells developed from ETP to DN3 stages, Runx occupancy tended to follow the “active” compartments (Extended Data Fig. 2d). Among the minority of genomic regions changing compartment, those switching from active to inactive (A to B trend) included more Group 1 (4.75%) than Group 2 Runx sites (1.32%), whereas compartments becoming active (B to A trend) included more Group 2 sites (4.56%) than Group 1 (2.35%)(Extended Data Fig. 2d). Multiple Group 2 sites appeared with a B to A compartment flip in the extended flanking region of Bcl11b (Extended Data Fig. 2e). However, most Runx site shifts occurred within A compartments.
To examine more local changes around Runx sites, we coded individual chromatin states across the genome from pre-commitment to post-commitment stages using ChromHMM33 with published datasets for chromatin state marks in pro-T cells22,23,34(see Methods). Although Runx factors can work both as repressors and as activators35–37, Runx binding sites overall were preferentially enriched in open/active chromatin regions (states 1-3, 5-10), or in weakly accessible regions harboring H3K4me2 marks representing likely poised regions (state 13)( Extended Data Fig. 2f).
However, the developmental changes of Runx binding site choices did not strictly depend on local DNA accessibility. At genomic sites where Runx factors changed occupancy between Phase 1 and Phase 2 (Fig. 1d, Extended Data Fig. 2e, g), Runx binding often changed even when ATAC accessibility of those sites did not change. Of Group 1 (Phase 1-specific) sites, only 43.8% were open in a Phase 1-restricted way, and only 21.4% of the Group 2 (Phase 2-specific) sites were open selectively in Phase 2: many Group 1 and a majority of Group 2 sites did not change accessibility. Where Group 1 Runx occupancies disappeared near progenitor regulatory genes Hhex and Meis1 from DN1 to DN3, accessibility was reduced (Fig. 1e, Extended Data Fig. 2g). However, at Ets1 multiple sites only gained Runx occupancies from DN1 to DN3 although these sites were already accessible in DN1 (ETP) stage (Fig. 1e; zoom-out in Extended Data Fig. 2e). Furthermore, over 1/3 of Group 2 sites remained closed in both Phases (Fig. 1d). Thus, local chromatin accessibility failed to explain why Runx occupancy was delayed at Group 2 binding sites.
Co-factor motifs distinguish sites with dynamic Runx binding
Site choice shifts could alternatively be due to differences in Runx binding avidity (site affinity times site density) which could make Group 2 sites highly sensitive to changes in Runx concentration, or collaborations with different stage-specific partners1. We evaluated these options by quantitative motif analysis, focusing exclusively on Runx sites that were consistently “open” to minimize chromatin effects (Fig. 1f, g). Runx binding sites mapping to open promoter regions had negligible Runx motif frequencies and poorer Runx motif quality scores (Fig. 1f). Stably open non-promoter Runx binding regions in Groups 1, 2, and 3 had much higher Runx motif frequencies and motif quality than promoter sites, but to different degrees. Consistently occupied Group 3 sites had the highest scores. Group 1 and Group 2 sites were similar in Runx motif frequencies and motif scores, although lower than the Group 3 sites. Thus, at non-promoter sites without chromatin barriers, stage-specific redistribution of Runx factors occurred most readily between “modest” Runx motif sites without strong advantages for recruiting Runx factors via DNA recognition per se (Fig. 1f).
Consistent with previous results1, we found distinct partner motifs enriched at Runx sites in different stages (Fig. 1g, Extended Data Fig. 1b). De novo motif enrichment analysis of the open sites confirmed that the Group 1 sites were highly enriched for PU.1 (ETS subfamily) motifs whereas the Group 2 sites were highly enriched for E2A (basic helix-loop-helix, bHLH) motifs. Although C&R Runx peaks did not show the extreme enrichment of ETS motifs seen with ChIP-seq (Extended Data Fig. 1e), canonical (non-PU.1) ETS factor motifs were still enriched, and were found at similar frequencies in all classes of non-promoter sites (Fig. 1g). Thus, at sites that were stably accessible throughout Phases 1 and 2, different ensembles of TFs might recruit Runx factors stage-specifically.
Partner proteins shift Runx binding but are titratable
A central question is whether a single mechanism could cause Runx factors to shift in concert from Group 1 vs. Group 2 sites during commitment. Nearly half the pre-commitment-specific binding sites for Runx factors (Group 1 sites) are actual co-binding sites with PU.11,30. In later pro-T cells other TFs such as Bcl11b collaborate with Runx factors at different sites19. Notably, the presence of PU.1 can redirect Runx1 occupancy to PU.1 sites, while depleting Runx1 binding (“theft”) from alternative Runx sites30. If Runx factor levels are truly limited such that partners have to compete to recruit Runx to different sites, then the tipping of a balance between partners might cause concerted occupancy switches from Group 1 to Group 2 sites.
We hypothesized that if such competition occurs, it could be overridden if Runx availability were increased. We first tested this hypothesis in a PU.1 “theft” model30(Fig. 2a–b, Extended Data Fig. 3a–c). The DN3-like Scid.adh.2C2 pro-T cell line, representing a PU.1-negative Phase 2 state, was retrovirally transduced with exogenous PU.1, with or without additional exogenous Runx1 (Fig. 2a, Extended Data Fig. 3a–b). As expected30, PU.1 activated myeloid markers in the cells with or without exogenous Runx1 (Extended Data Fig. 3b) and recruited endogenous Runx1 to a set of new co-occupancy sites with PU.1, most of which had been closed before (Fig. 2b, PU.1-induced). As previously reported30, PU.1 also caused a loss of Runx1 occupancy from ~55% of the normal endogenous Runx binding sites (Fig. 2b, PU.1-depleted). However, when extra Runx1 was added (OE), although PU.1 still recruited Runx1 to the PU.1-induced sites, occupancy of the PU.1-depleted sites was fully rescued (Fig. 2b). The extra Runx1 also occupied a set of novel sites (OE new). These had high quality Runx motifs at high frequency (Extended Data Fig. 3c), but were mostly sequestered in closed chromatin in the normal Scid.adh.2C2 (Fig. 2b). These results suggest that either Runx1-PU.1 complexes or high-level Runx1 alone could gain access to normally closed chromatin, and that the ability of PU.1 to remove Runx1 from its default binding sites was based on competitive titration only when Runx1 was limiting.
Figure 2. A mild increase in Runx factor availability prevented PU.1-mediated Runx1 depletion and prematurely upregulated Bcl11b, TCF1, and GATA3 in Phase 1.
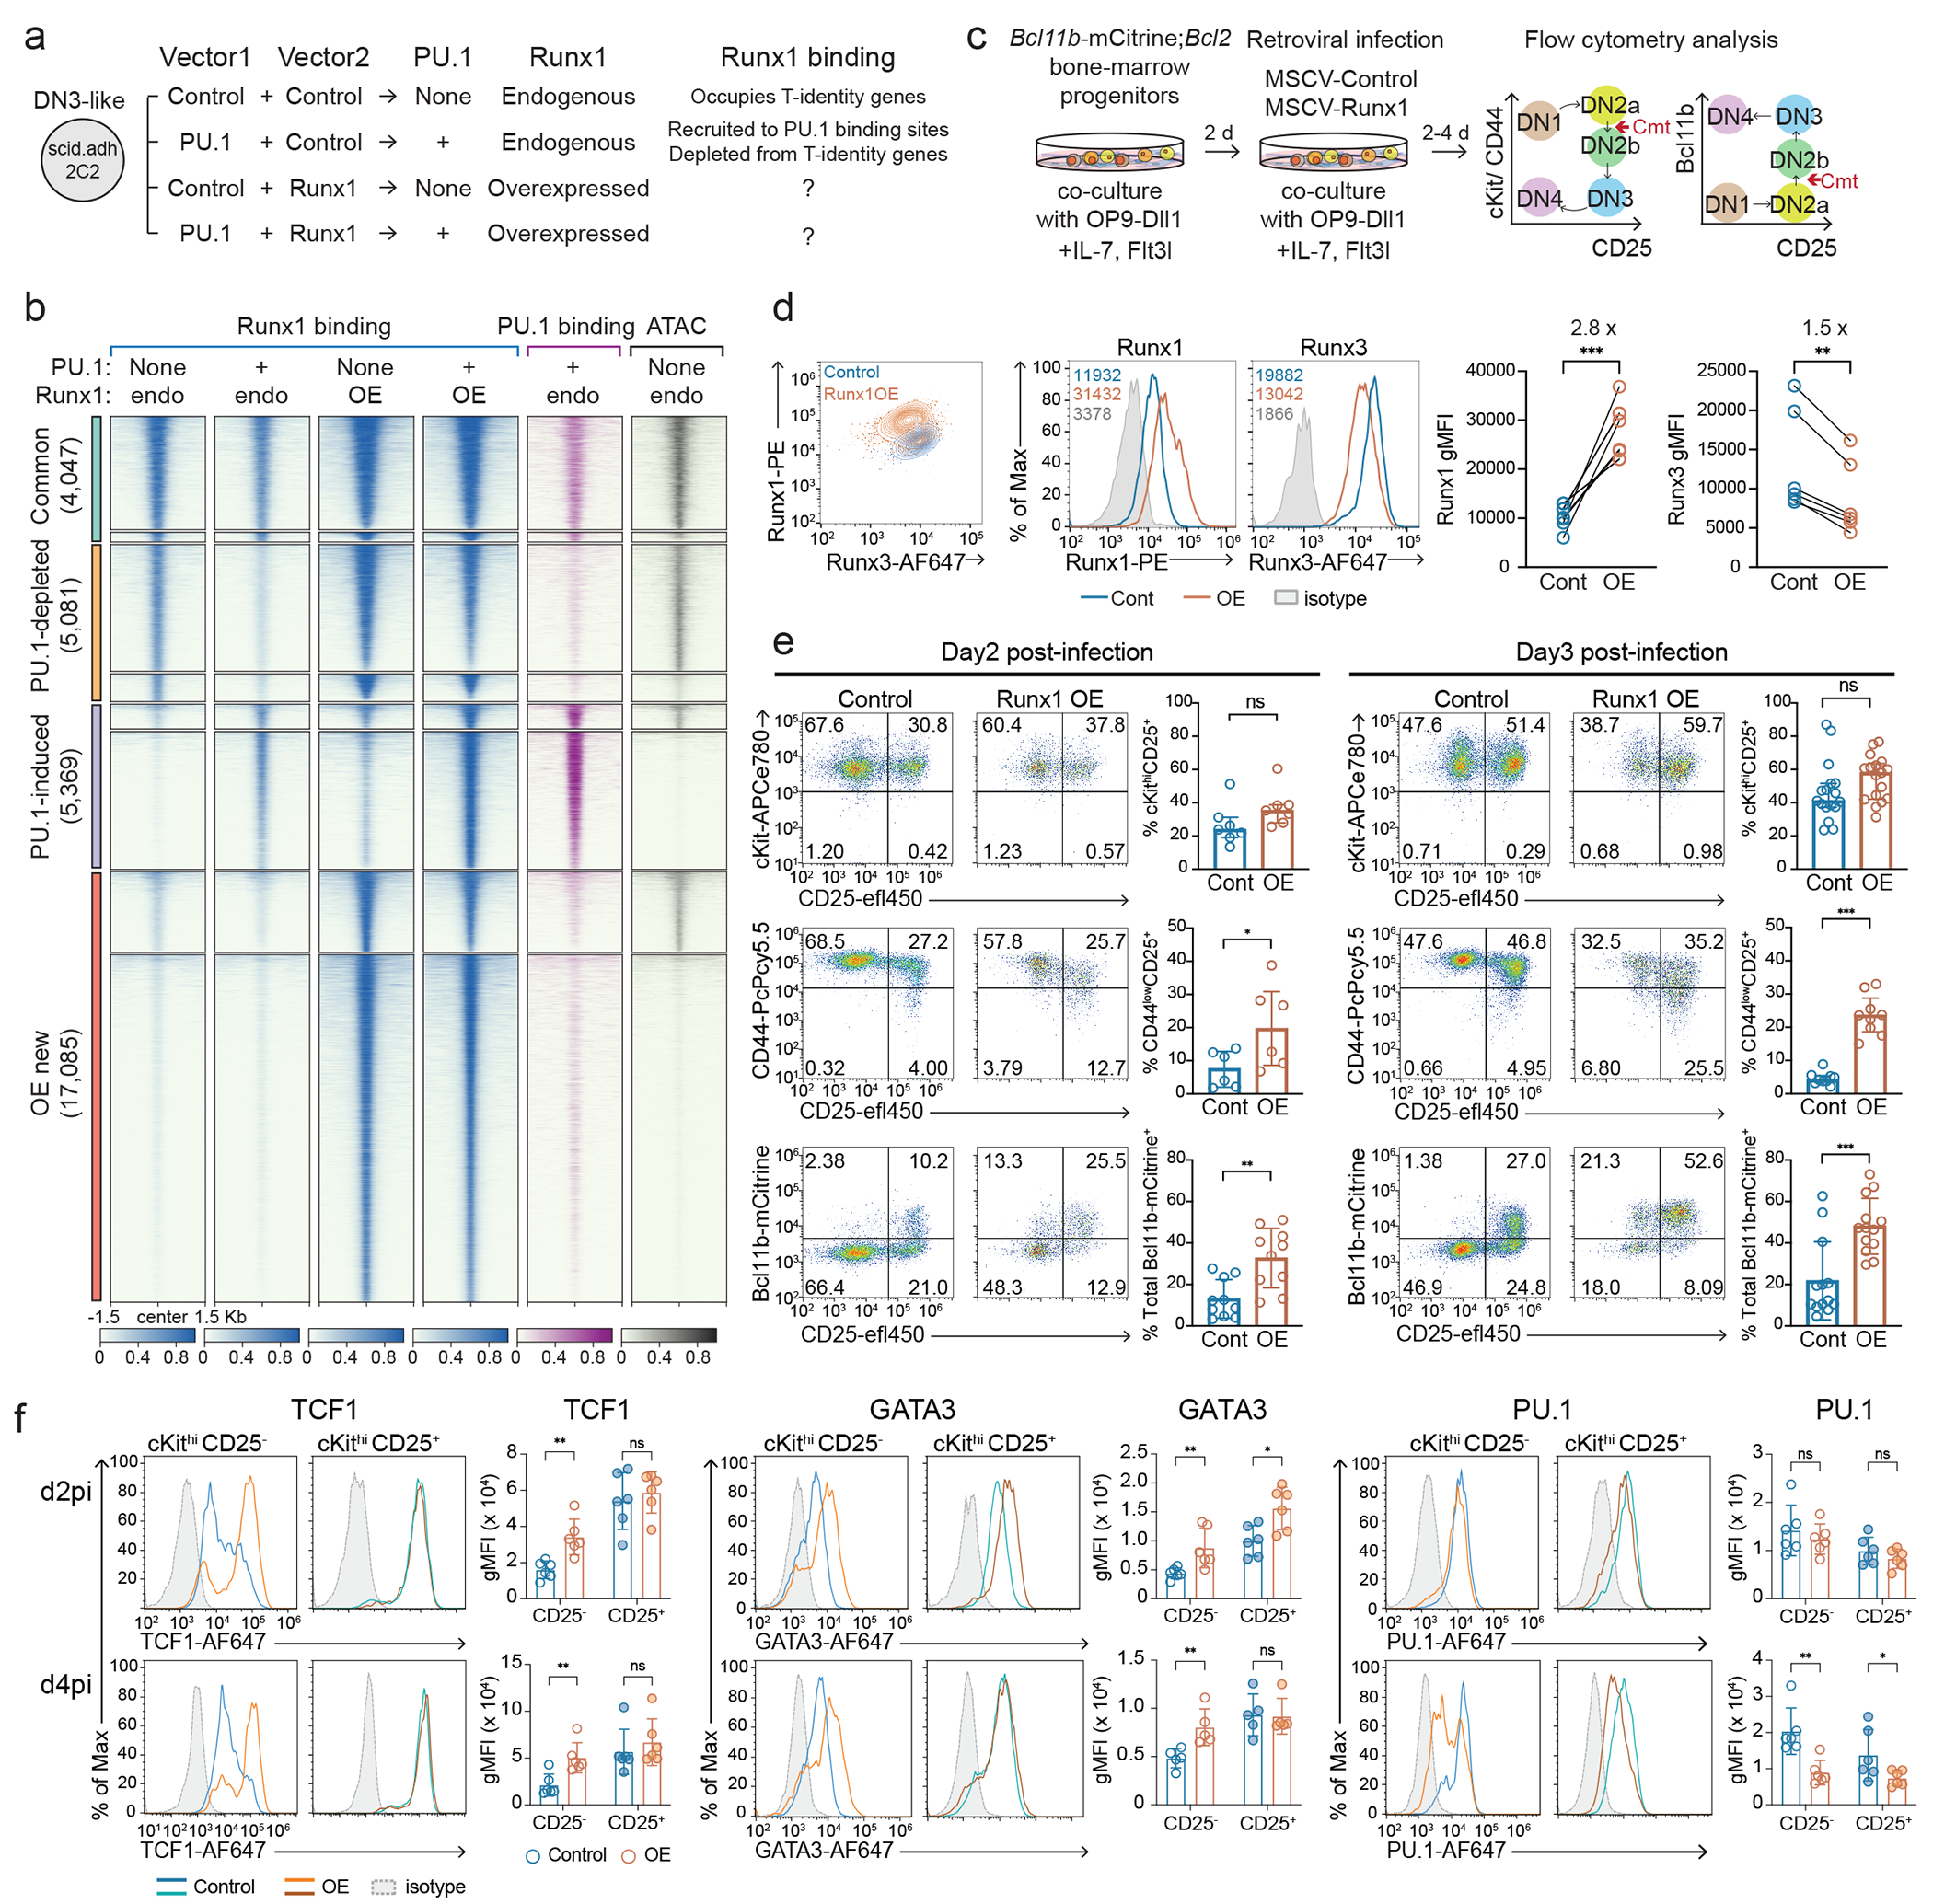
a, Experimental design to test Runx-dosage and co-factor dependent Runx redistribution in DN3-like Scid.adh.2C2 cells. b, Peak-centered heatmap illustrates Runx1 and PU.1 binding patterns in non-promoter sites under indicated conditions from 2 independent ChIP-seq experiments. c, Experimental design for testing Runx dosage effect on early T-development is displayed. d, Representative histograms show intracellular Runx1 (left histogram) and Runx3 (right histogram) protein levels detected by flow cytometry in control or Runx1-overexpression (OE) vector-transduced Phase 1 cells. Numbers indicate geometric mean fluorescence intensities (gMFI) of Runx1 or Runx3. Graph summarizes results from 6 independent experiments. Comparisons by two-sided paired t-test. *** P = 0.0002, ** P = 0.0024. e-f, Flow cytometry data show cKit, CD44, CD25, Bcl11b-mCitrine reporter levels after delivering empty control or Runx1 overexpression (OE) vectors on day 2 (e, left) or day 3 (e, right) of T cell development. Graphs summarize mean values from 7-17 independent experiments with standard deviation (error bar). Comparisons by two-sided Welch’s t-test. For CD44low CD25+, * P = 0.0463 for day 2 post-infection (d2pi); *** P < 0.001 for d3pi. For Bcl11b-mCitrine+ ** P = 0.0019 for d2pi; *** P = 0.0004 for d3pi. n of d2pi = 7 independent experiments and n of d3pi = 17 independent experiments for measuring cKit, CD44, and CD25; n of d2pi = 10 independent experiments and n of d3pi = 12 independent experiments for measuring Bcl11b. f, Histograms display protein expression levels of TCF1, GATA3, and PU.1 at day 2 and day 4 after Runx1 overexpression in Phase 1. Phase 1 (live, alternative lineage−, cKithigh) cells were separated as CD25− DN1 and CD25+ DN2 populations to compare target protein levels. Graphs display mean values from 5 (for d4pi GATA3) or 6 (for other TFs) independent experiments with standard deviations. Mann-Whitney test. For TCF1, ** P = 0.0022 for d2pi; ** P = 0.0087 for d4pi, For GATA3, ** P = 0.0087 and * P = 0.026 for d2pi; ** P = 0.0079 for d4pi, For PU.1, ** P = 0.0022 and * P = 0.0411 for d4pi, ns=not significant.
Increased Runx1 prematurely induced key T-developmental TFs
If titration of potentially competing partner factors affects Runx site choice, Runx concentration might affect the T-lineage specification program in early progenitor cells. To test this, we exploited the OP9-Delta-like ligand 1 (Dll1) in vitro differentiation system38 as in our previous studies1. Briefly, bone-marrow derived progenitor cells expressing a Bcl11b-mCitrine reporter and Bcl2 transgene were co-cultured with OP9-Dll1 cells, and exogenous Runx1 was retrovirally delivered to pro-T cells when the progenitor cells were still at DN1 stage (Fig. 2c). The Bcl2-transgene does not have effects on normal T cell development in vivo or in vitro (Supplementary Note 2). Then, we measured T-development markers (cKit, CD44, and CD25) and Bcl11b-mCitrine expression, normally a marker for T-lineage commitment (Cmt)(see Fig. 1a, 2c)25. At day 2 and day 4 after exogenous Runx1 introduction (overexpression, OE), total Runx1 protein levels were 2-3× increased relative to controls; however, Runx1 OE cells had a ~1.5× decrease in levels of Runx3, the other major Runx factor in pro-T cells, as compared to control cells (Fig. 2d, Extended Data Fig. 4a). Downregulation of Runx3 was most pronounced in the cells expressing more Runx1 (Fig. 2d, left panel). Extra Runx1 dampened mRNA expression of all Runx paralogs: endogenous Runx1 transcript (not measuring exogenous Runx1), Runx2, and Runx3 were all significantly decreased (Extended Data Fig. 4b). Hence, total Runx availability was likely ≤2× increased, and this modest degree of increase was important for the health of the cells39.
Runx1 OE strikingly accelerated Bcl11b induction 2-3 days after transduction: ~20% of control cells but ~50% of Runx1 OE DN2 cells expressed Bcl11b-mCitrine by day 3 (Fig. 2e). Furthermore, increased Runx1 levels caused premature appearance of DN3-like cells (CD44low CD25+)(Fig. 2e, middle). Among other developmentally important TFs, Runx1 OE upregulated TCF1 and GATA3 protein expression within the cKithi CD25− DN1 population at both days 2 and 4 post-infection (Fig. 2f), anticipating increases that occurred in controls only at day 4 when the cells became CD25+ (DN2a cells)(Fig. 2f). Runx1 normally represses PU.1 (encoded by Spi1) only in Phase 21,40 (DN2b, DN3 cells). PU.1 expression was not affected by Runx1 OE at day 2 post-infection, but became significantly downregulated even in the DN1 population by day 4 (Fig. 2f). All these responses to Runx1 OE were more pronounced in the cells expressing higher Runx1 protein, suggesting Runx dosage effects (Extended Data Fig. 4c–d). Hence, a mild increase in Runx factor availability in Phase 1 pro-T cells could accelerate aspects of early T cell development.
Runx perturbations change single-cell transcriptomes
Runx level effects on initiation of the T cell specification program as a whole were analyzed by single-cell RNA-seq (scRNA-seq). To identify targets affected by Runx1 OE that were also dependent on normal Runx levels in controls, we compared Runx1/Runx3 double knockout (dKO) cells1 with Runx1 OE and empty vector control cells. We delivered Runx1 OE vector or empty vector control into Bcl2-transgenic progenitor cells to test OE, or guide-RNAs (gRNAs) against Runx1 and Runx3 or control irrelevant gRNAs into Cas9;Bcl2 transgenic prethymic progenitor cells to test dKO. These samples were each co-cultured with OP9-Dll1 cells to two different timepoints (day 2 and day 4 post-infection for OE; day 3 and day 6 post-infection for dKO), then marked by unique hashtag oligos, and then all three OE, dKO, and control conditions were pooled and subjected to scRNA-seq together in the same reaction (Fig. 3a, see Methods).
Figure 3. Single-cell transcriptomes revealed that Runx-level perturbation caused cells to take different developmental paths deviated from normal trajectory.

a, Experimental schematics for single cell RNA-seq (scRNA-seq) are depicted. Each experimental condition group was marked by a different hashtag oligo (HTO) and equal numbers of cells from each were pooled for scRNA-seq. Two independent scRNA-seq experiments were performed. See Methods for details. b-d, UMAP2-3 illustrate scRNA-seq data from Runx1 OE and Runx1/Runx3 double knockout (KO) in Phase 1. b, Color intensity in UMAP displays expression levels of indicated genes, which are informative to represent different T-development stages. c, Types of Runx perturbation (control, Runx1 OE, and Runx1/Runx3 KO cells) with cells from different experimental time points are highlighted in UMAP2-3 space. d, Cells from scRNA-seq are colored by Louvain clusters. e, Area-proportional Venn diagram shows the number of Runx-activated (blue) and -inhibited genes (orange) in OE and/or KO perturbations. f, Scatter plots compare Log2 fold-changes of Runx target gene expression in Runx1 OE and Runx KO conditions at d2-d3 (left) or d4-d6 (right) after Runx perturbations were introduced. D2pi OE DEGs vs. d3pi KO DEGs Pearson correlation r = −0.48 and d3pi DEGs vs. d6pi DEGs Pearson correlation r = −0.56. n of d2pi OE DEGs = 337, n of d3pi KO DEGs = 189, n of d4pi OE DEGs = 468, and n of d6pi KO DEGs = 249. g, Histograms display the aggregated enrichment scores of indicated pathways (ETP, DN2, DN3, and Myeloid pathways) in each cell computed from curated reference gene sets by ssGSEA. Cells were grouped by types of Runx perturbation and timepoints.
In a low dimensional transcriptome representation from two independent 10X runs, the first dimensions in t-distributed stochastic neighbor embedding (tSNE1) and Uniform Manifold Approximation and Projection (UMAP1) reflected cell-cycle phases (Extended Data Fig. 5a, b, top panels) and poorly separated developmental states; thus we utilized UMAP2 and UMAP3 for data exploration. After cell-cycle regression, UMAP2 (x axes, Fig. 3b–d) approximately represented real time developmental progression for normal, control pro-T cells, while UMAP3 (y axes) reflected perturbation; note that within each population the cells progressed asynchronously. In controls, cells with low-UMAP2 values expressed DN1 signature genes (Lmo2, Spi1, Bcl11a, Cd34, Mef2c, Hhex). Genes transiently expressed during DN1 to DN2a transition (Mycn, Fgf3) were maximally expressed at UMAP2-intermediate values (Fig. 3b); while DN2a/b marker genes (Il2ra, Tcrg-C1, Gata3, Tcf7, Thy1, Cd3g) were expressed in UMAP2-intermediate and high control cells. At later timepoints, genes associated with T-lineage commitment and the DN2b stage (Bcl11b, Ly6d, Lef1, Ets1) initiated expression in highest UMAP2 control cells (Fig. 3b). Thus, for controls, UMAP2 positions could relate cell states to the normal developmental progression.
Runx1 OE and Runx1/Runx3 dKO (“Runx dKO”) split cells from the control cell clusters in opposite directions in UMAP3. Runx1 OE cells had lower UMAP3 values than the controls while Runx dKO cells veered to UMAP3-higher values (Fig. 3c), in each case directing the cells through unique clusters (Louvain clustering, Fig. 3d, Extended Data Fig. 5c). Thus Runx factors altered pathways followed by individual cells, not just distributions along the control pathway.
Runx factors regulate essential T-developmental genes
In addition to the UMAP3 separation, developmental landmark gene expression patterns shifted reciprocally in Runx1 OE and Runx dKO cells along the UMAP2 axis as compared to the control group (Fig. 3b). Consistent with faster induction of Bcl11b-mCitrine expression in absolute time, Runx1 OE cells upregulated multiple later-stage genes “prematurely” at lower UMAP2 values than controls (Bcl11b, Gata3, Tcf7, Cd3g, Tcf12, Ly6d, Lef1, Ets1). However, not all DN2-associated genes were concurrently induced (e.g., Il2ra, Tcrg-C1), nor were all critical DN1 landmark genes downregulated (e.g., not Spi1) in Runx1 OE cells. Conversely, Runx dKO caused lingering expression of DN1- and HSPC-associated genes (Lmo2, Spi1, Bcl11a, Cd34, Mef2c, Meis1) and impaired upregulation of later-stage T-lineage genes (Mycn, Fgf3, Il2ra, Tcrg-C1, Gata3, Tcf7, Thy1, Cd3g, Bcl11b, Ly6d)(Fig. 3b), as Runx dKO cells expressed genes associated with non-T cells, such as Id2, Cd81, Csf2rb, and Ifngr2 (Extended Data Fig. 5d). Thus, many developmentally regulated genes sensitively responded to perturbations of Runx levels, although the mixed phenotypes indicated that Runx dosage responses occurred within pro-T cells themselves.
We reasoned that direct Runx targets would likely be significantly affected by Runx1 OE and also reciprocally by Runx1/Runx3 dKO, and this overlap defined a core differentially expressed gene (DEG) set (Fig. 3e) that was consistent across both timepoints (Extended Data Fig. 5e). The global gene expression changes mediated by Runx dKO vs. Runx1 OE were inversely correlated at both timepoints, with the core set making significant, reciprocal responses to both gain- and loss-of Runx functions (Fig.3f and Extended Data Fig. 5f, Supplementary Tables 1, 2). Core Runx-activated genes (100 genes) were generally upregulated as normal pro-T cells advance to the DN2 and DN3 stages (e.g., Cd24a, Hes1, Patz1, Ahr, Myb, Lck, Tcf7, Ly6d, Bcl11b, Lat, Cd3d, Cd3g, and Gzma). In contrast, core genes inhibited by Runx factors (46 genes) included ETP signature and non-T genes (e.g., Mef2c, Lmo2, Cd34, Pou2f2, Csf1r, Csf2rb, Bcl11a, Id1, Ly6a, and Cd81)(Fig. 3e, f, and Extended Data Fig. 5f).
Global pathway analysis using Single-sample Gene Set Enrichment Analysis (ssGSEA)(Fig. 3g) concurred that elevated Runx activity preferentially activated genes associated with T-developmental progression, while inhibiting the genes associated with progenitor and myeloid programs.. Controls started with high ETP (DN1) and low DN2 or DN3 enrichment scores and shifted to low ETP (DN1) and high DN2 and DN3 enrichment scores from day 2 to day 6. Runx dKO cells (“KO”), at both day 3 and day 6, were more enriched for ETP signatures and slightly increased myeloid signatures, failing to activate DN2 or DN3 signatures comparably to controls. In contrast, Runx1 OE at both timepoints showed accelerated loss of associations with ETP and increases in DN2, DN3 profiles accelerated relative to controls (Fig. 3g).
Runx factors control selective gene regulatory modules
The fine structure of Runx effects on developmental progression could be measured quantitatively using pseudotime, which concurred well with the actual progression of control cells from day 2 pi to day 6 pi (Fig. 4a, b). Runx dKO caused slower progression in pseudotime as compared with control cells, while Runx1 OE markedly accelerated progression (Fig. 4b). For control cells, UMAP2 and pseudotime parameters were correlated, with a highly linear relationship (Fig. 4c left). In contrast, Runx dKO cells exhibited consistently slowed developmental (pseudotime) progression across most UMAP2 values (Fig. 4c right), whereas Runx1 OE cells accelerated development (pseudotime) especially during a specific low-UMAP2 window (UMAP2: −30 to 5)(Fig. 4c middle). This suggested a specific early-Phase 1 window of opportunity when elevated Runx1 dosage had most impact.
Figure 4. Runx levels control T-development progression rate by activating selective gene network modules.
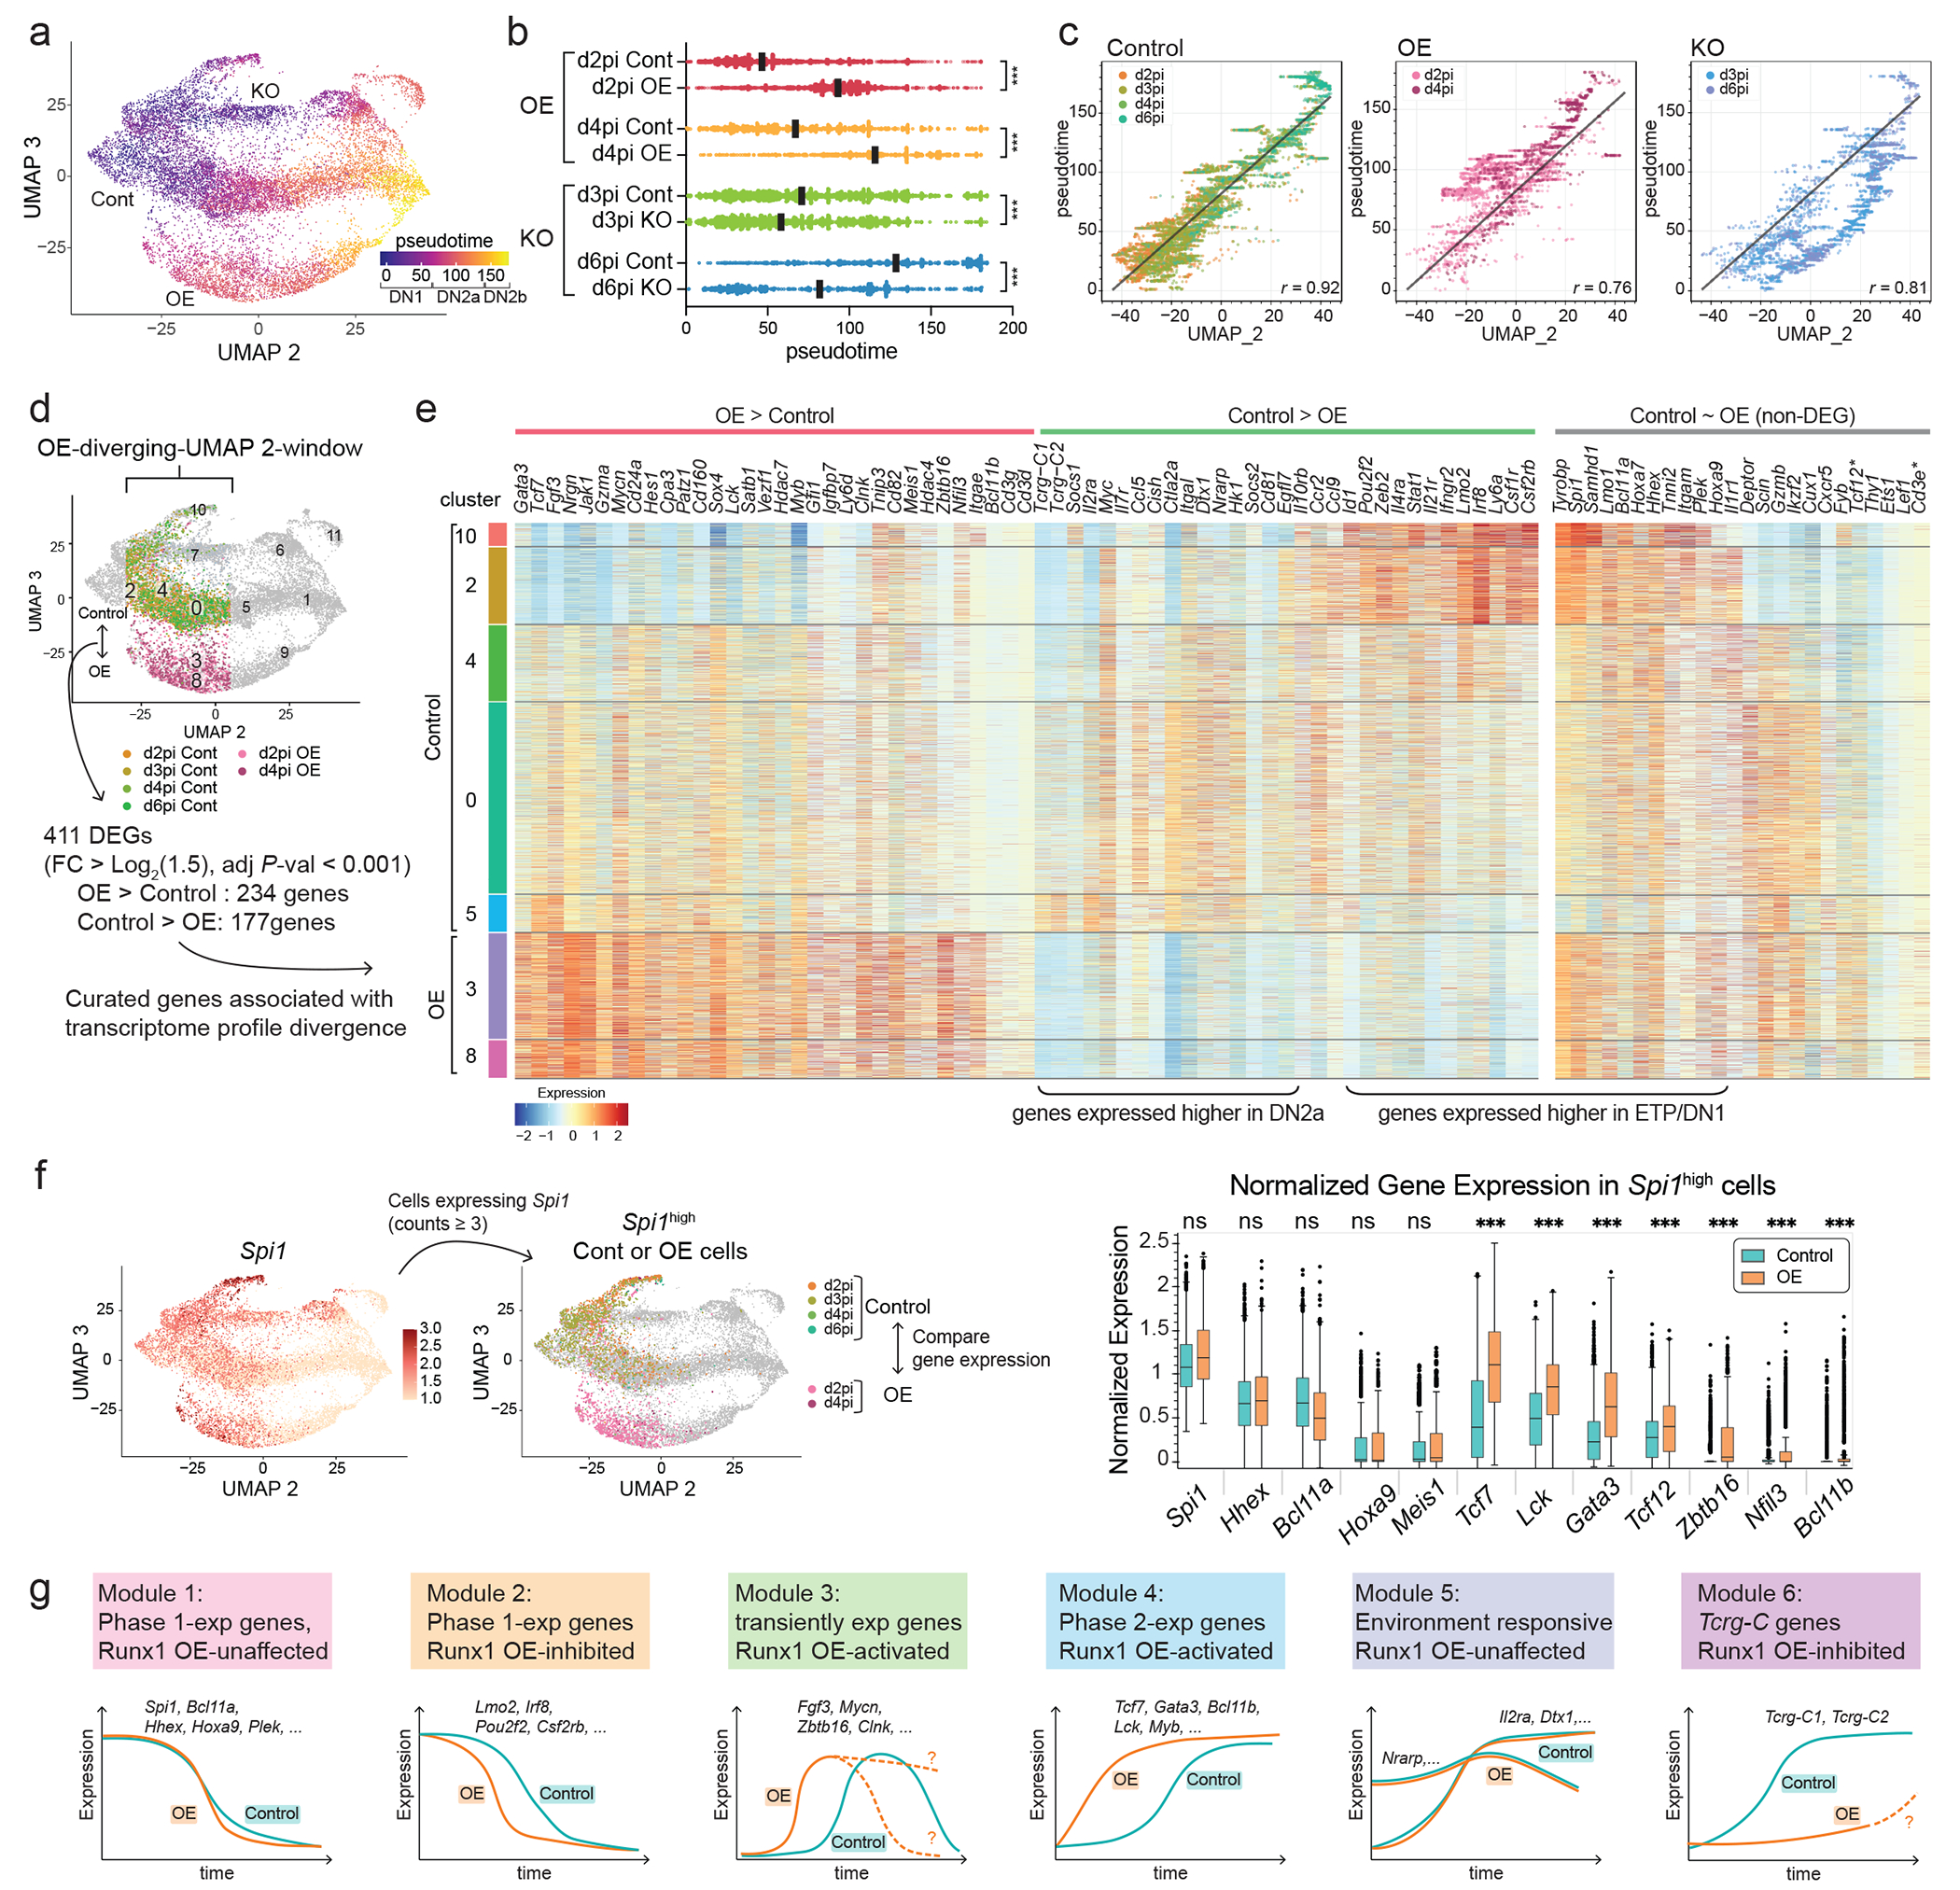
a, The pseudotime score of each cell is displayed in UMAP2-3 by color. Pseudotime score was calculated with Monocle 3 by defining the principal root node as cells expressing high levels of Flt3 and Kit and absence of Il2ra and Tcf7 transcripts. b, Pseudotime distributions of cells from indicated groups are shown with median using a black bar. Kruskal-Wallis test of multiple comparisons. *** P < 0.0001. n of d2pi Control (Cont) cells = 2,944, n of d2pi OE cells = 2,992, n of d3pi Cont cells = 2,641, n of d3pi KO cells = 2,502, n of d4pi Cont cells = 937, n of d4pi OE cells = 804, n of d6pi Cont cells= 1,004, n of d6pi KO cells = 815. c, Scatter plots compare the pseudotime score and the UMAP2 value, which approximately corresponds to the real time. Cells in control (left), OE (middle), and KO (right) groups are shown with Pearson correlation r. Black line indicates a linear regression fit calculated on control group. Spearman’s rank correlation coefficient ρ was also computed: control (ρ = 0.906, p<0.0001), OE (ρ = 0.733, p<0.0001), KO (ρ = 0.819, p<0.0001). d, Analysis strategy for differential gene expression is shown. e, Curated list of differentially expressed genes between control vs. Runx1 OE groups within −30 < UMAP2 < 5 window is displayed in heatmap (left). Genes that were developmentally dynamically regulated (defined by cluster 1 vs. cluster 2 comparison), yet not differentially expressed by Runx1 OE within −30 < UMAP2 < 5 cells, are also shown (right). *Cd3e was not scored as a DEG due to low frequency of Runx1 OE cells expressing Cd3e at this early timepoint. f, Analysis strategy to define differentially expressed genes between control vs. Runx1 OE cells among Spi1high pro-T cells (left). Normalized expression of the indicated genes in control and Runx1 OE cells are shown with statistical significance determined by Wilcox.test employing a Seurat algorithm. ***=adj P < 0.001. ns = not significant. n of Cont = 3,583, n of OE = 1,890. Center line indicates median value; box limits show upper and lower quartiles, whiskers mark minima and maxima values. Outliers are shown using dots. g, Graphical illustration of gene expression modules utilized in early T cell development.
To define the target genes involved in the Runx1 OE effect, we compared DEGs between control vs. Runx1 OE groups specifically within the stages when their pseudotime progressions diverged (Fig. 4d; −30<UMAP2<5: “OE-diverging-UMAP2-window”). The genes upregulated by Runx1 OE in this focused comparison included multiple key T-identity genes and TFs (Cd3g, Cd3d, Bcl11b, Tcf7, Lck, Gata3, Myb, Patz1, Hes1), induced much earlier and to higher levels than in controls (see Supplementary Table 3 for all 411 DEGs). However, Runx activation targets were not entirely T-lineage specific, as Runx1 OE also caused increased expression of genes associated with innate lymphoid cell (ILC) or NK programs (Zbtb16, Nfil3, Clnk, Cd160)41, which are normally transiently activated in DN1-DN2a cells but repressed during later T cell development by Bcl11b and E-proteins (Fig. 4e; see below)19,42,43.
The genes less expressed in Runx1 OE than in control samples in the same UMAP2 window were also striking. Those were enriched for cytokine-associated and Notch signaling responsive genes (Il2ra, Il7r, Il4ra, Il21r, Stat1, Socs1, Socs2, Cish, Dtx1, Nrarp, Myc), and for TCRγ-constant region genes (Tcrg-C1, Tcrg-C2), which are also positively regulated by cytokine signaling44,45. Of major Notch target genes, only Hes1 was upregulated by Runx1 OE. Whereas these other genes normally increase expression from ETP to DN2b progression along with Runx-activated targets, Runx1 OE activated T-identity and common lymphoid program genes without inducing these environmental signaling response genes. Finally, some Phase 1 genes (Lmo2, Irf8, Pou2f2) were prematurely inhibited by Runx1 OE. However, other Phase 1 genes including key TFs, Spi1, Meis1, Hoxa9, Hhex, and Bcl11a were much less affected within this early pseudotime window. A direct comparison between the cells still expressing Spi1 in OE and Controls confirmed that Runx1 OE already upregulated T-identity and ILC genes including Tcf7, Lck, Gata3, Tcf12, Zbtb16, Nfil3, and Bcl11b, even before Spi1 (PU.1) or multiple other Phase 1-signature genes were downregulated (Fig. 4f, Supplementary Table 4).
Together, these results indicated that distinct subprograms involved in normal T-cell development were not necessarily tightly linked (Fig. 4g). Runx TFs exerted selective activities to induce T-identity and ILC-specific programs from DN1 to DN2-like stages without activating cytokine/proliferation programs and before completely blocking the stem and progenitor program.
Runx1 overexpression supports NK cell potential
To determine whether increased Runx availability in pro-T cells also changed developmental potentials we assayed alternative potentials revealed by withdrawal of Notch signaling. In a competitive commitment assay, we introduced control empty vector or Runx1 OE vector, distinctively marked by mCherry or human NGFR (hNGFR) expression. Then, we sorted the same numbers (100 cells per well) of transduced DN1, Bcl11b− DN2a, and Bcl11b+ DN2a cells each from control- and Runx1 OE populations and co-cultured them with OP9 stroma for 6 days, either expressing Dll1 to assess T cell potential or without Dll1 (OP9-Control) for alternative potential (Extended Data Fig. 6a). Runx1 OE cells yielded lower overall cell recoveries and frequencies relative to controls for both Notch-dependent and -independent conditions (Extended Data Fig. 6b), potentially due to their downregulated cytokine/signaling-pathway genes and lower expression of Myc (cf. Fig. 4e, g).
Elevated Runx levels caused qualitative differences in the alternative lineage choices that cells made when they were removed from Notch signals (Extended Data Fig. 6c). In DN1 stage, the granulocyte/myeloid lineage path (Ly6G/Ly6C+) is a common alternative for control cells, but Runx1 OE disfavored this. Instead, Runx1 OE DN1 cells preferentially deviated to express an NK cell marker (NK1.1), similarly to control DN2a cells. Also, unlike control Bcl11b+ DN2 cells, Runx1 OE cells precociously expressing Bcl11b+ could still upregulate NK1.1 in the absence of Notch signaling (Extended Data Fig. 6c). Thus, moderately raised Runx levels enhanced access to NK cell-associated programs, while counteracting myeloid/granulocyte potentials.
A modest increase of Runx1 accelerates T cell development
The single cell transcriptome profile suggested that Runx levels had a significant impact on early T-developmental progression based on pseudotime, but deviations from normal patterns were noted. To determine whether Runx1 overexpression truly drove faster T cell development over a longer term, we took advantage of a three-dimensional (3D) artificial thymic organoid (ATO) system using mouse MS4-Dll4 feeder cells, which closely recapitulates thymic T cell developmental stages from DN1 to CD4- or CD8- single-positive stages46,47. We formed mixed chimeric ATOs, mixing equal numbers (1,000 input cells) of bone marrow progenitor cells transduced with control- or Runx1 OE-vectors marked with either mCherry or hNGFR (Fig. 5a), and we then compared T-developmental progression by control and OE cells within the same ATOs on day 5, 8, 10, and 15. As in OP9-based cultures, Runx1 OE progenitor cells showed only ~20% of chimerism at day 5 of culture, however, the frequencies of Runx1 OE progenitor cells then stabilized (Fig. 5b).
Figure 5. Runx1 overexpression results in overall faster T-lineage development from DN1 to DN4 stages in the mixed chimeric artificial thymic organoid.

a, Experimental schematics for mixed-chimeric artificial thymic organoid (ATO) culture are illustrated. b, Representative flow plots display expression levels of infection markers (gated on live lineage− CD45+ cells). Graphs show average frequency of control vs. Runx1 OE cells from chimeric ATOs at indicated timepoints. The graph on the left show chimerism of control vs. Runx1 OE with geometric mean with 95% confidence interval. Pairwise comparisons by Wilcoxon signed-rank test. *** P = 0.0005 for day 5 (d5), P = 0.0005 for d8, P = 0.0002 for d10, P = 0.0002 for d12, P = 0.0001 for d15. Throughout Figure 5, n of d5 = 12 ATOs, n of d8 = 12 ATOs, n of d10 = 13 ATOs, n of d12 = 13 ATOs, n of d15 = 14 ATOs. ATO cohorts from 3 independent experiments were analyzed. ATOs from different independent experiments are plotted using different symbol shapes. c-d, Expression profiles of T-development markers, cKit, CD25, Bcl11b-mCitrine were measured by flow cytometry. Representative plots were gated on indicated infection marker+ cells at indicated timepoints. Cells that turned off vector expression during culture were not included in the analysis. e, Graphs show frequencies of indicated pro-T cell populations in control- or Runx1 OE transduced cells at different time points. Wilcoxon signed-rank test. *** P = 0.0005 for d5, P = 0.0005 for d8 DN2a, P = 0.0001 for d8 DN 2b, P = 0.0005 for d8 DN3, P = 0.0002 for d10 DN2b, P = 0.0105 for d10 DN3, *** P = 0.0001 for d15. f, Bcl11b-mCitrine reporter expression levels during day5-day15 ATO cultures are shown. Numbers in histograms (left) indicate gMFI. Graphs show percent of Bcl11b-mCitrine+ cells (middle) and Bcl11b-mCitrine gMFI (right). Wilcoxon signed-rank test. For comparing percentage of Bcl11b-mCitrine+ cells, *** P = 0.0005 for d5, P = 0.0001 for d8. For Bcl11b-mCitrine gMFI comparisons, *** P = 0.0005 for d5, P = 0.0001 for d8, P = 0.0002 for d10, P = 0.0007 for d12, P = 0.0001 for d15, ns = not significant.
Although Runx1 OE yielded fewer cells than controls in the same ATOs, we observed a striking T-developmental acceleration. At day 5, about 65% of Runx1 OE cells turned on Bcl11b, progressing to DN2b and DN3 stages, and only ~10% cells remained at DN1 stage (Fig. 5c–e). In contrast, ~20% and ~50% of control cells were still at the DN1 and DN2a stages respectively. Faster development by Runx1 OE cells continued through later stages, as they progressed to DN3 stage faster (on day 8 and day 10), and reached DN4 stage earlier (on day 15) than the control group (Fig. 5c–e). Moreover, Runx1 OE not only advanced Bcl11b onset, but also increased Bcl11b expression per cell at all timepoints even beyond DN3 stage (Fig. 5f), extending previous evidence25. Thus, increased Runx1 levels in progenitor cells propelled intrinsically faster T cell development to DN4 stage, with prominent acceleration especially across the DN1 to DN2b transition.
Premature Runx1 binding in Phase 2 sites
To understand how slightly elevated Runx1 levels drove faster T-developmental progression, Runx1 binding profiles were examined in Phase 1 pro-T cells sorted (Lineage−, infection+, CD45+ cKithigh cells) 40-42 hr after Runx1 or control vector introduction (Extended Data Fig. 7a). We investigated the newly appearing Runx occupancies in Runx1 OE cells with respect to their relationship to normal sites, their Runx motif qualities, their chromatin accessibilities and compartment distributions, their co-enrichment for motifs of other putative collaborating factors, and their co-occupancies with potential partner factors (Fig. 6; Extended Data Figs. 7–8; Supplementary Note 3), and assessed their linkage to DEGs (Extended Data Fig. 9). C&R analysis showed a clear increase in the number and intensities of Runx1 occupancies across the genome in Runx1 OE cells as compared to control cells (Fig. 6a, Extended Data Fig. 7b, c). As all these cells were still mostly in Phase 1 (cKithigh DN1-DN2a) at harvest, both control and Runx1 OE cells showed Runx1 binding to Group 1 and Group 3 sites similar to unperturbed DN1 cells (Fig. 6a, DN1 Runx1 and Runx3)(Extended Data Figs. 7c, d, 8a Plek, Lmo2, Meis1). However, OE samples also showed new Runx1 occupancies at two classes of non-promoter sites. The first subset overlapped with 65% of normal Group 2 sites (Group 2a, Fig. 6a, Extended Data Fig. 7c), including sites in the Bcl11b enhancer region, Ets1, Cd3 cluster, Tcf7, Thy1, and Zbtb16 (Fig. 6b, Extended Data Fig. 8b highlights). These Group 2a sites encompassed both ATAC-accessible and -inaccessible sites (Fig. 6a) within A and B-to-A transitioning chromatin compartments (Extended Data Fig. 7d). They had higher Runx motif scores and motif densities than the Group 2 sites that failed to become bound in the Runx1 OE samples (Group 2b, Fig. 6c,d).
Figure 6. A modest increase of Runx1 concentration resulted in premature occupancy of post-commitment-preferred sites and new sites.

a, Heatmap represents Runx1 or Runx3 DNA binding patterns in non-promoter regions from indicated cells. Orange tracks were derived from experimental cells and blue tracks were obtained from unperturbed Phase 1 (in vitro DN1) and Phase 2 (thymic DN3) pro-T cells (two independent C&R experiments for each condition). Stage-dependent chromatin accessibility patterns in control or Runx1 OE cells (brown) or unperturbed normal cells (black)22 at Group 2a, Group 2b, and Group 4 sites are shown on the right with percent of total peaks in a group. b, Representative UCSC genome browser tracks display Runx binding (C&R) together with binding profiles of PU.1 (ChIP-seq), TCF1, E2A, and HEB (C&R). Published HiC PC1 values, chromatin accessibility (ATAC) profiles, and binding sites of loop forming machinery (CTCF and SMC) are also shown. Enhancer regions near Bcl11b, Ets1, and Zbtb16 are displayed. Highlights indicate Group 2a sites becoming occupied under Runx1 OE conditions. c, Runx motif frequencies in different Groups of Runx binding sites are illustrated as density plots. d, Violin plot demonstrates the best Runx motif score distribution in each Groups of Runx binding sites. Thin black lines extend from 25th to 75th percentiles, median is indicated with horizontal red line, and black bars show the minima and maxima values. The horizontal dotted line shows the threshold PWM score to be considered to harbor the Runx motif. Two sample KS test (comparing to Group 3 motif scores). P = 6.09e-59 for Group 1, P = 6.53e-10 for Group 2a, P = 1.11e-75 for Group 4 op, P = 3.45e-148 for Group 4 cl, P = 1.62e-170 for Group 2b. n of Group 1 peaks = 7,201, n of Group 2a peaks = 7,707, n of Group 2b peaks = 4,608, n of Group 3 peaks = 8,368, n of Group 4 op peaks = 8,060, n of Group 4 cl peaks = 24,184. e, Number of Runx binding sites co-occupied with PU.1 or TCF1 or E-proteins were enumerated and their percentages in each group are shown using a bar graph. f, Table summarizes different groups of Runx binding patterns affected by Runx motif quality, motif density, and the presence of co-factors.
Notably, closed chromatin per se was not a barrier to binding of Runx1. Overexpressed Runx1 also bound a second group of sites, normally unoccupied in primary pro-T cells (Group 4, Fig. 6a; cf. Fig. 2a–b). Of these, only 25% were ATAC-accessible in Phase 1 (Group 4op). Most Group 4 sites were closed normally (75%, Group 4cl) and only slightly increased in ATAC-accessibility when occupied in Runx1 OE cells (Fig. 6a). Some of the open Group 4 regions, though not the closed Group 4 regions, were normally Runx-occupied in innate lymphoid cells (Extended Data Fig. 7e,f)19,41. Note that elevated Runx1 did not gain access to low-quality sites: both Group 2a and Groups 4op, 4cl sites had similar Runx motif qualities to the Group 1 sites normally occupied in Phase 1 cells (Fig. 6d). Higher motif density appeared to enable occupancy in closed chromatin (Fig. 6c, Group 4op vs. Group 4cl).
The most striking difference between the different Runx site types was their representation of motifs for other transcription factors (Extended Data Fig.7g) and their co-occupancy with other factors (Fig. 6e, Extended Data Fig. 7h). PU.1 motifs were selectively enriched in all Phase 1-occupied binding sites as expected (Group 1 and Group 3), where PU.1 was co-bound to 45% of Group 1 sites, 57% of Group 3 sites, and 35% of Group 4op sites, but <12% of Group 2 sites and <5% of Group 4cl sites. Group 2a sites and Group 2b sites had motifs and some co-binding with TCF1 (Tcf7) and E proteins (E2A and HEB), also seen in Group 3 but not in Groups 1 or 4 (examples: Gata3, Myb, Extended Data Fig. 8c). Group 4cl sites were impoverished for cofactor motifs and notably lacked binding of any of the potential cofactors tested. Fig. 6f summarizes the distinguishing features of all the Groups of Runx sites studied here that contribute to their disparate roles in development. While all the other site Groups were enriched around functionally Runx-responsive genes, the Group 4cl sites were more highly associated with Runx non-DEGs than with Runx-responsive genes (Supplementary Table 2, Extended Data Fig. 9), indicating that most Group 4cl sites are probably functionally inert.
Cooperation of multiple TFs for Runx-driven gene regulation
Since modest Runx1 OE also activates expression of factors including TCF1 (encoded by Tcf7) and HEB (Tcf12), their co-binding at function-correlated classes of Runx sites (Groups 2a, 3) suggested that they could collaborate with Runx1 OE directly to stimulate T-lineage progression. For example, Tcf7 knockdown using short hairpin RNA (shRNA) completely inhibited the Bcl11b upregulation by Runx1 OE (Fig. 7a). To examine whether Runx factors more generally accelerate T cell development by a regulatory cascade involving other TFs, we performed gene regulatory network inference analysis using Single Cell Regulatory Network Inference and Clustering (SCENIC, Extended Data Fig. 10)48, which infers TFs changing activity based on dynamics of ensembles of their putative target genes (“regulons”). We stratified cells based on their pseudotime values and compared enriched regulon activities between control, Runx1 OE, and Runx dKO cells (Figs. 7b, Extended Data Fig.10a. b) (Supplementary Table 5).
Figure 7. Runx TFs control gene regulatory network by cooperating with other TFs.
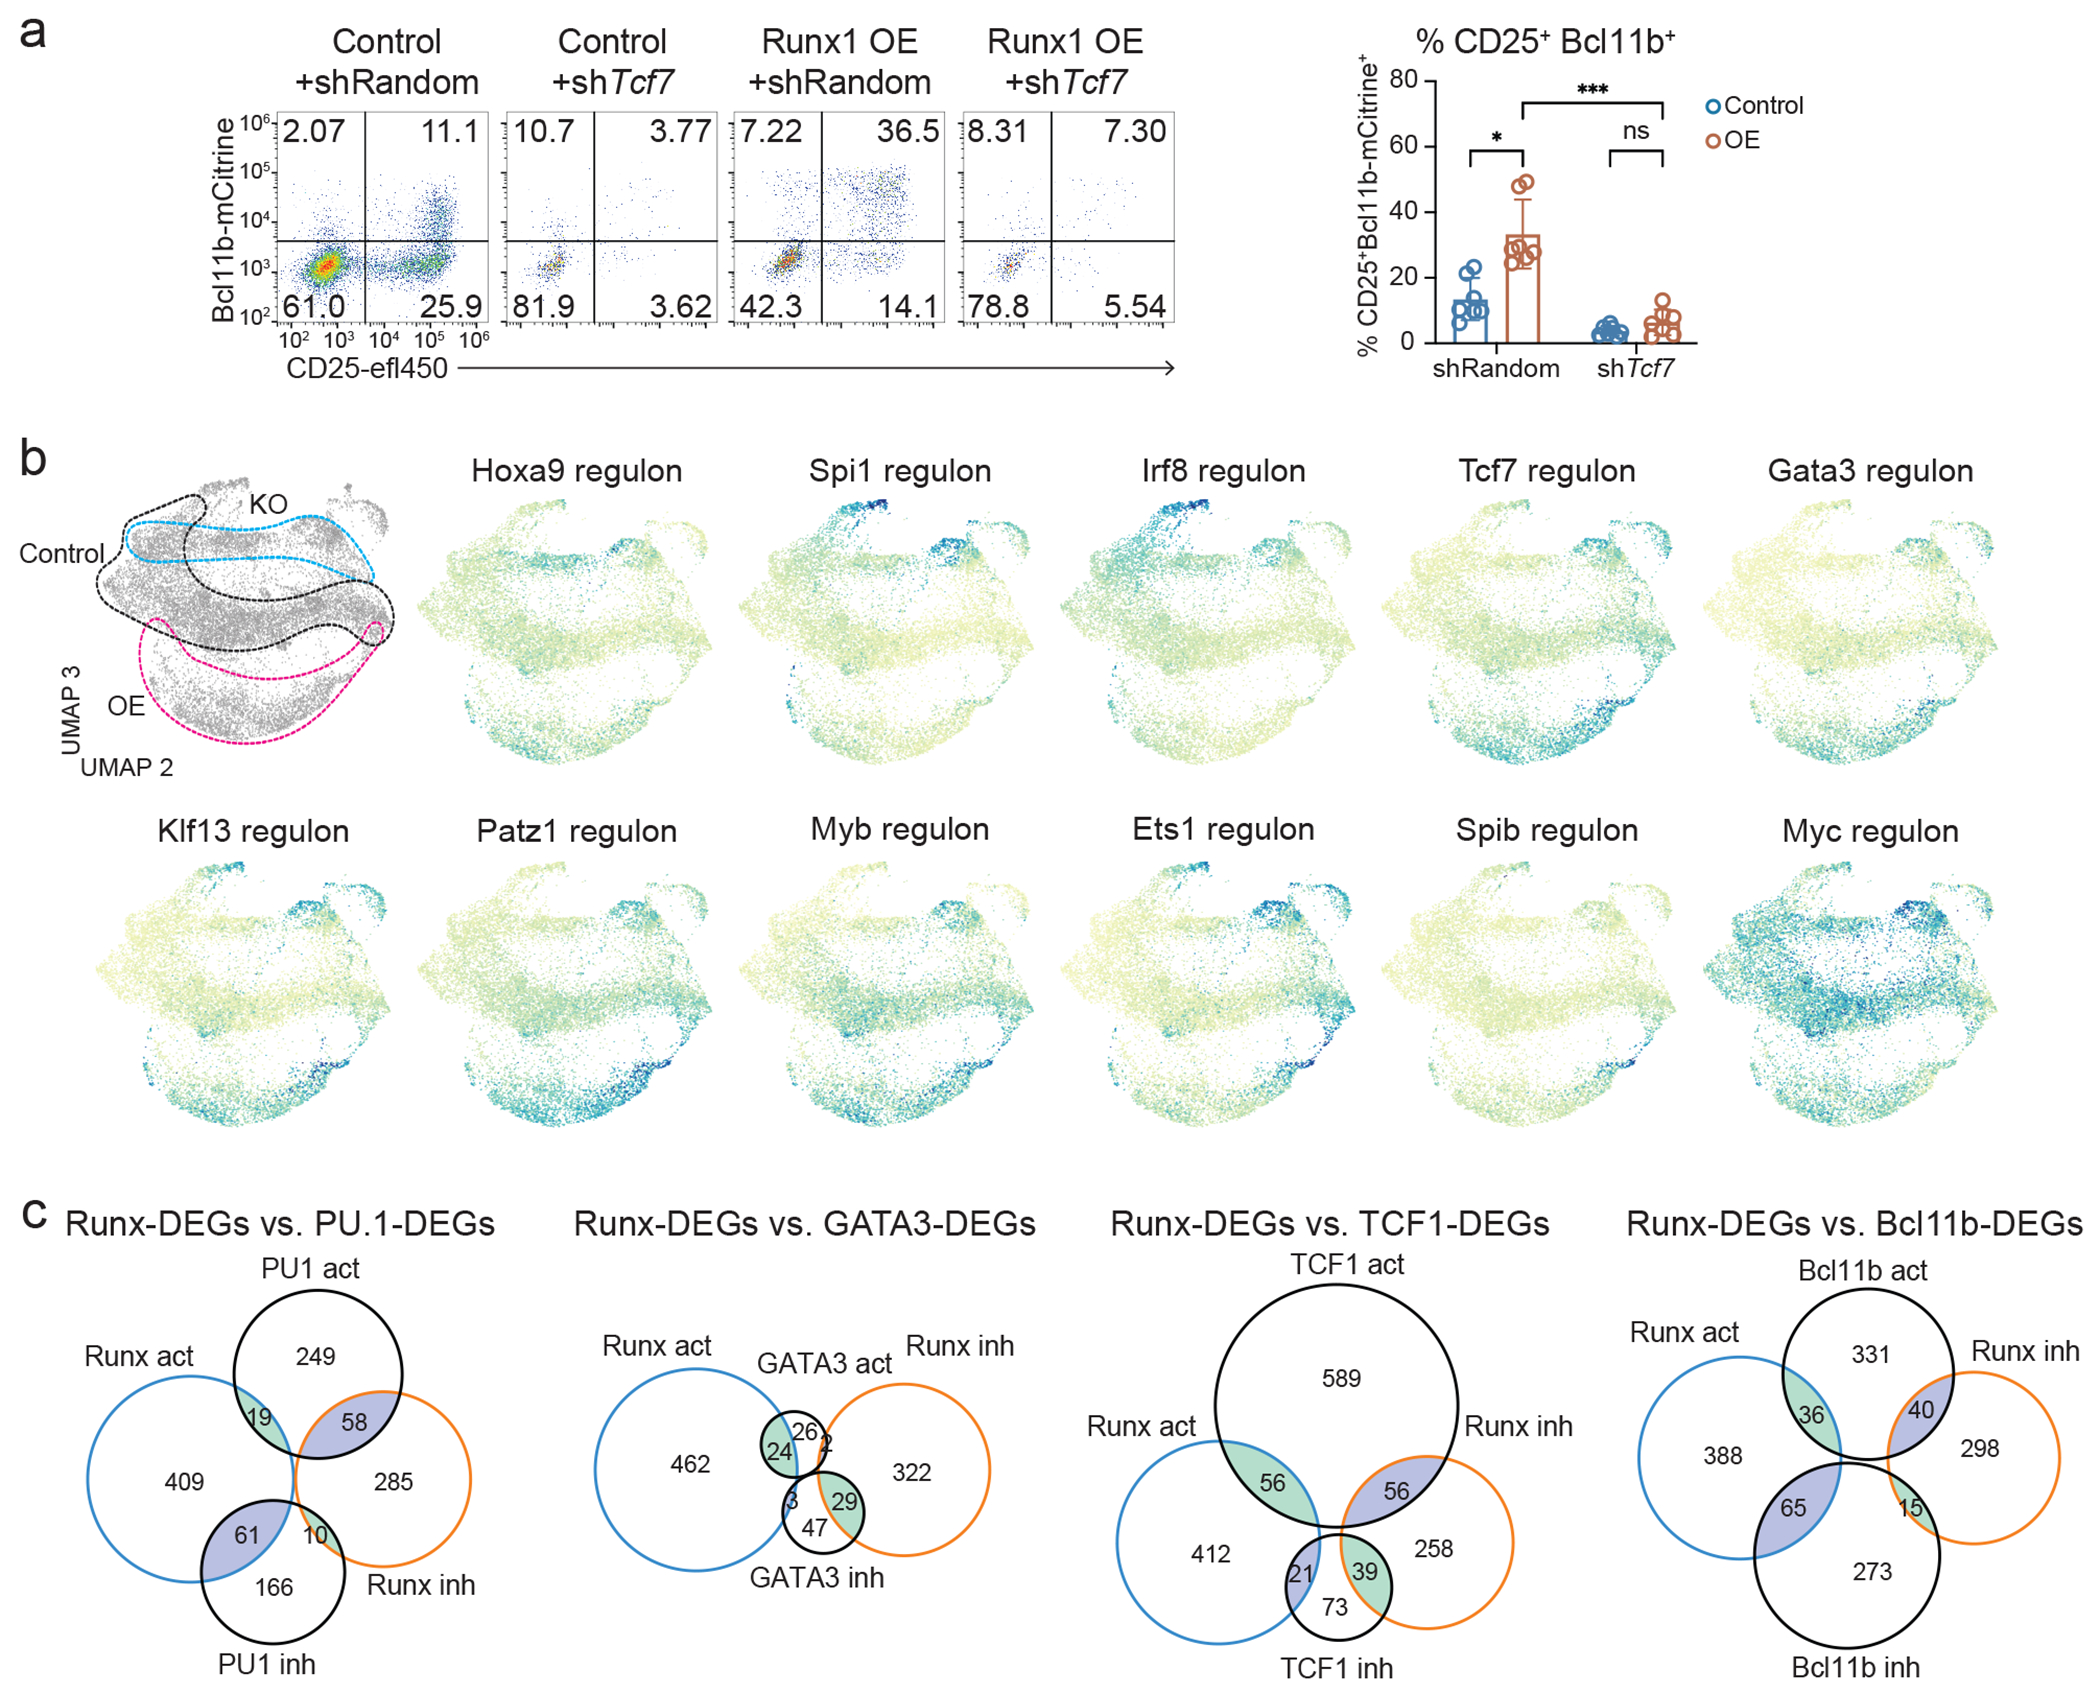
a, shRNA against Tcf7 or random control shRNA was introduced into bone-marrow progenitor cells in combination with Runx1 OE or empty control vector, then the progenitor cells were co-cultured with OP9-Dll1 for 2 days. Bar graph summarizes Bcl11b-mCitrine and CD25 expression levels measured by flow cytometry with mean and standard deviation. n=6 independent experiments, Two-way ANOVA with Šídák’s multiple comparisons. *** adj P = 0.0007, * adj P = 0.0196, ns=not significant. b, SCENIC-predicted regulon activities for indicated TFs are highlighted on the UMAP2/UMAP3 manifold. The expressed regulons scoring adjusted P < 1e-10 from at least two different pairwise comparisons using Kolmogorov–Smirnov tests were selected to visualize. c, Area-proportional Venn diagrams display overlap between functionally responsive Runx target genes with previously determined functional target genes of PU.113, GATA343, TCF143, and Bcl11b19.
Runx dKO cells showed sustained regulon activities for “Early” TFs, such as Spi1, Irf8, and Mef2c, even after they reached later pseudotime stages. Conversely, Runx1 OE cells displayed stronger regulon activities than control cells for Tcf7, Gata3, Patz1, Myb, and also for Tcf12 and Ets1 at later stages. (Fig. 7b, Extended Data Fig. 10b). Importantly, 70-80% of Runx DEGs possessed at least one additional SCENIC-predicted input as a member of a Runx-sensitive regulon, whereas 80% of Runx non-DEGs failed to overlap with any members of Runx-sensitive regulons (putative target genes)(Extended Data Fig. 10c). Furthermore, 50% of Runx-activated and -inhibited target genes were predicted to be controlled by more than three SCENIC inputs, with each target gene predicted to receive different combinatorial inputs (Extended Data Fig. 10d). Thus, Runx-dependent TF changes could significantly contribute to overall Runx impacts on target genes.
In some cases, we could assess the directions of combined regulatory effects by overlapping Runx DEGs with previously defined PU.1, TCF1, GATA3, and Bcl11b responsive gene sets (Fig. 7c; see Methods; Extended Data Fig. 10e–h, Supplementary Table 6). Runx TFs mainly opposed PU.1 actions, as they had mostly opposite effects when they affected the same genes (Fig 7c, Extended Data Fig.10e). In contrast, effects of GATA3 were strongly concordant with Runx responses of the same genes, including key genes supporting T-developmental progression (Fig. 7c, Extended Data Fig.10f). Runx factors also worked with TCF1 to support T cell identity and common lymphoid programs (Fig 7c, Extended Data Fig.10g). However, TCF1 activated genes associated with cytokine response and proliferation that were not co-activated by Runx factors, and both concordant and opposing responses were seen. Finally, Bcl11b and Runx both supported T-identity associated program genes (Fig. 7c, Extended Data Fig. 10h); however, Bcl11b specifically repressed Runx1 OE-induced innate lymphoid genes (Extended Data Fig. 10h, left), thus presumably working to terminate ILC and NK cell potential. Together, these data showed a modular structure for the gene regulatory network that pro-T cells employ, in which Runx factors work as gene network mediators to oppose stem/progenitor and myeloid programming, while fueling innate lymphoid-biased and T-identity modules.
Discussion
TF concentrations are an important parameter affecting TF DNA binding choices in metazoans49. Runx factors particularly have dose-dependent effects on hematopoietic progenitor emergence50,51 and can exert distinct developmental effects via site-binding affinities24. We show here that dosage-sensitive Runx DNA binding site choices also significantly drive T-lineage specification. Medium-quality Runx binding sites recruited Runx factors stage-specifically by interaction with collaborating factors, resulting in stage-specific target gene regulation. While co-binding with PU.1 dominated Runx binding site choices in pre-commitment stages, these patterns were sensitive to Runx availability, consistent with distinct partners competing for limited amounts of Runx factors. Thus, a modest increase in Runx levels in pre-commitment cells enabled Runx proteins to bind precociously to post-commitment-specific Phase 2 sites, even while PU.1 was still present. Our close analysis sheds light on the multiple criteria of site quality, site density, and site accessibility that determine stage- and lineage-specific site choice for Runx1.
Runx OE caused striking T-lineage developmental acceleration from DN1 at least to DN4 stage. This faster developmental progression was fueled by selective Runx activities upregulating innate-lymphoid and T-identity programs, before fully inducing environment-responsive genes or completely shutting off Phase 1-associated genes. Runx1 OE also promoted NK-like potential at the expense of myeloid potential. The co-expression of Phase 1- and Phase 2-signature genes and incoherent activation of different post-commitment regulatory program modules suggest that Runx TFs minimally contributed to proliferation and cytokine responses, but actively promoted T and innate-like cell-identity programs.
Reciprocal regulation by Runx1/Runx3 dKO and by Runx1 OE highlighted the core Runx dose-dependent target genes. These Runx regulated genes included many encoding TFs, which contributed to the transcriptional profile both by co-binding with Runx1 to subsets of Phase 2-occupied sites, and by separate gene network effects. Most Runx DEGs were predicted to be co-regulated by these Runx-target TFs, and previously defined target genes of PU.1, GATA3, TCF1, and Bcl11b overlapped substantially with Runx-regulated genes. By collaborating or opposing gene regulatory functions of other TFs, Runx proteins control selective sets of the genes shaping cell identity. Thus, Runx factors function as dose-dependent gene network drivers to orchestrate discrete transcriptome modules during early T cell development.
NATURE METHODS
Animal studies
C57BL/6J (B6), B6.Cg-Tg(BCL2)25Wehi/J (Bcl2-tg), B6.Gt(ROSA)26Sortm1.1(CAG-cas9*,−EGFP)Fezh/J (Cas9) mice were purchased from the Jackson Laboratory (#000664, #002320, #026179) and bred at the California Institute of Technology. B6.Bcl11bmCitrine/mCitrine (B6.Bcl11b-mCitrine reporter) mice were described previously25,52. Bcl2-tg or progeny of B6. Bcl11bmCitrine/mCitrine x Bcl2-tg or progeny of B6. Cas9 x Bcl2-tg mice were utilized for this study. Both male and female mice were used as sources of cells for this study. All animals were bred and maintained under specific pathogen-free conditions at the California Institute of Technology, at 21.5-24° C ambient temperature, 30-70% humidity, with lighting 13 hr on and 11 hr off, according to Institutional Animal Care and Use Committee (IACUC) regulations.
Cell Lines
The OP9-Dll1 (obtained from Dr. J. C. Zúñiga-Pflücker38) or mouse MS4-Dll4 (obtained from Dr. Gay Crooks47) stromal cell lines were utilized for in vitro cell culture to recapitulate early thymic T cell development. The stromal cell lines were maintained as described in the original references. The Scid.adh.2c2 DN3-like cell line53 was cultured in RPMI1640 with 10% fetal bovine serum, 2 mM glutamine, 100 IU/mL penicillin, 100 μg/mL streptomycin, 0.1 mM sodium pyruvate, non-essential amino acids, and 50 μM β-mercaptoethanol. The identities of these cells have been validated by their consistent performance in specialized assays and by transcriptome analyses.
In vitro OP9 co-culture
Bone marrow was obtained from the femurs and tibiae of 8-12 week-old B6. Bcl2-tg or progeny of B6. Bcl11bmCitrine/mCitrine x Bcl2-tg or progeny of B6. Cas9 x Bcl2-tg mice. Progenitor cells from the bone marrow cell suspension were enriched by depleting mature lineage+ cells expressing CD3ε (clone 145-2C11), CD19 (clone 1D3), B220 (clone RA3-6B2), NK1.1 (clone PK136), CD11b (clone M1/70). CD11c (clone N418), Ly6G/C (clone RB6-8C5), and/or Ter119 (clone TER-119) using MACS LS magnetic columns (Miltenyi Biotec). Enriched progenitor cells were co-cultured with OP9-Dll1 cells and supplemented with 10 ng/mL of IL-7 (Peprotech) and 10 ng/mL of Flt3L (Peprotech) in OP9 medium (α-MEM, 20% FBS, 2 mM glutamine, 100 IU/mL penicillin, 100 mg/mL streptomycin, and 50 μM β-ME). OP9 in vitro cultures were done under 37 °C, 7% CO2 environment.
To obtain unperturbed Phase 1 pro-T cells for CUT&RUN, bone-marrow progenitor cells were cultured with OP9-Dll1 cells for 5 days with 10 ng/mL IL-7 and Flt3L each. To measure Runx1 binding sites after retroviral infection, bone-marrow progenitor cells were cultured on OP9-Dll1 cells for 2 days and either empty control vector or Runx1 overexpression vector was introduced for 40-42 hours.
Mixed chimeric Artificial Thymic Organoid (ATO) 3D culture
Bone-marrow progenitor cells obtained as described above were incubated with 10 ng/mL IL-7, 10 ng/mL of Flt3L, and 10 ng/mL of SCF in OP9 medium overnight to launch the cells into cycle. Then progenitor cells were infected with control or Runx1 overexpressing MSCV vector expressing mCherry or human NGFR marker and incubated with 10 ng/mL IL-7, 10 ng/mL of Flt3l, and 0.1 ng/mL SCF in OP9 medium (SCF concentration was reduced to recover surface cKit expression). After 24 hours delivering retroviral vector, infection marker+ lineage (TCRβ, TCRγδ, CD19, NK1.1, CD49b, Ly6G/C, CD11b, CD11c)− Sca1+ cKit+ (LSK) cells were FACS sorted. The ATOs were formed and maintained by following the original reference47. Briefly, 1,000 of each infection marker+ LSK cells and 150,000 mouse MS4-Dll4 cells were aggregated and seated at the air-medium interface on a culture insert (Millipore Sigma) in serum-free ATO medium (DMEM-F12, 1X B27, 2 mM glutamine, 100 IU/mL penicillin, 100 μg/mL streptomycin, 30 μM Ascorbic acid) supplemented with 5 ng/mL of IL-7 and 5 ng/mL of Flt3L. The cytokine-supplemented culture medium was replaced every 3 days and IL-7 and Flt3L concentrations were dropped to 1 ng/mL (each) after day 10.
Note that there is significant variation between developmental speeds generally among different replicate organoids in the same experiment, comparable to variation between experiments. Control and Runx1 OE input cells had to be mixed before establishing them in ATO cultures so that at each timepoint, organoid by organoid, control and Runx OE cells could be compared within the same ATO.
Retroviral transduction
Mouse Runx1 full-length sequence was inserted into the murine stem cell virus (MSCV) retroviral-mCherry or MSCV-human NGFR vector (Addgene #80157, 80139) as previously described25,54. The guide-RNA (gRNA) against Runx1 or Runx3 were inserted into E42-human NGFR or E42-mTurquoise2 vector as previously described1,30. Three gRNAs were utilized to target each Runx paralog (Addgene #189799, #189800, #189801, #189802, #189803, #189804, #189805, #189806). For retroviral infection, the target cells were centrifuged at 500×g, 32°C for 2 hours with viral supernatant supplemented with 8 μg/mL polybrene. After the spinfection, viral supernatant was removed and replaced with cytokine-supplemented culture medium.
For the simultaneous double KO of Runx1 and Runx3, three guide RNA constructs for Runx1 (NGFR) were pooled, and three guides for Runx3 (CFP) were pooled. To sort KO samples for scRNA-seq, populations were gated on NGFR+CFP+ double positive cells.
Flow cytometry analysis and cell sorting
Cell surface staining was performed following Fc blocking by incubating single cell suspensions in 2.4G2 hybridoma cell supernatant. Then cells were stained with a biotin-conjugated lineage cocktail, all using 1:300 dilution: TCRβ (BioLegend, clone H57-597), TCRγδ (eBioscience, clone GL-3), CD19 (BioLegend, clone 6D5), NK1.1 (BioLegend, clone PK136), CD49b (BioLegend, HMa2), CD11b (BioLegend, clone M1/70), CD11c (BioLegend, clone N418), and Ly6G/C (BioLegend, clone RB6-8C5). Secondary surface staining was performed with fluorescently conjugated streptavidin (dilution 1:300), CD45 (eBioscience, clone 30-F11, dilution 1:1000), cKit (eBioscience, clone 2B8, dilution 1:100), CD44 (eBioscience, clone IM7, dilution 1:600), CD25 (eBioscience, clone PC61.5, dilution 1:300), and hNGFR (BioLegend, clone ME20.4, dilution 1:400). A viability dye (Life Technologies, Aqua, dilution 1:1000) or 7AAD (eBioscience, dilution 1:50) was applied to exclude dead cells.
For intracellular staining of TFs, cells were fixed with 2% paraformaldehyde for 15 min at 25 °C after surface staining. Then cells were permeabilized with the Foxp3 Permeabilization/Fixation kit (eBioscience) and stained with fluorescently conjugated antibody against Runx1 Runx1 (eBioscience, clone RXDMC, dilution 1:50), against TCF1 (CST, clone C63D9, dilution 1:500), against GATA3 (BD, clone L50-823, dilution 1:50), or against PU.1 (CST, clone 9G7, dilution 1:50), or an isotype control (BioLegend, clone RTK2758). Samples were acquired using a CytoFlex analyzer (Beckman Coulter) and data was analyzed with FlowJo v.10.8.1 (BD). Except for the lineage commitment assay (Extended Data Fig. 6), cells were gated on the live, alternative lineage marker (TCRβ, TCRγδ, CD19, NK1.1, CD49b, CD11b, CD11c, Ly6G/C)-negative infection+ CD45+ population for analysis.
For single cell RNA-seq, bone marrow progenitor cells were subjected to in vitro culture as described. On day 2, 3, 4, or 6 post infection, Phase 1 cells from each experimental condition were stained with unique hashtag-oligo (HTO) antibody (BioLegend, TotalseqA HTO1-HTO8, 2 μl per 1 million cells or 1 μl for samples <500,000 cells), then cells were sorted for Lineage− CD45+ cKithigh mCherry+ (marker for MSCV vector) or mTurquoise2+ hNGFR+ (markers for gRNA expressing vectors) population using the BD FACSAria Fusion at the California Institute of Technology Flow Cytometry Facility.
The following samples were hashtagged and combined for analysis in each scRNA-seq experiment.
Experiment 1:
day 2 post-infection MSCV control rep 1
day 2 post-infection MSCV control rep 2
day 2 post-infection MSCV Runx1 OE rep 1
day 2 post-infection MSCV Runx1 OE rep 2
day 3 post-infection gRNA control rep 1
day 3 post-infection gRNA control rep 2
day 3 post-infection gRNA Runx1/Runx3 dKO rep 1
day 3 post-infection gRNA Runx1/Runx3 dKO rep 2
Experiment 2:
day 2 post-infection MSCV control rep 3
day 4 post-infection MSCV control
day 2 post-infection MSCV Runx1 OE rep 3
day 4post-infection MSCV Runx1 OE
day 3 post-infection gRNA control rep 3
day 6 post-infection gRNA control
day 3 post-infection gRNA Runx1/Runx3 dKO rep 3
day 6 post-infection gRNA Runx1/Runx3 dKO
CUT&RUN (C&R)
C&R was performed by following original methods previously described31,55,56 with minor modifications as follows. Briefly, pro-T cells were FACS sorted and washed with wash buffer (100 mM NaCl (Sigma-Aldrich, S5150), 20 mM HEPES pH 7.3-7.5 (Gibco, 15630-080, stock pH 7.3), 0.5 mM spermidine (Sigma-Aldrich, S2501), 1X protease inhibitor (Sigma-Aldrich, 5056489001), and 0.5% BSA (Roche 03117332001)) twice. Then, 400-500K DN3 cells were bound to 20 μL of activated concanavalin-A coated beads (Bangs Laboratories, BP531) by incubating in wash buffer at 25 °C for 5-10 min. For Phase 1 pro-T cells obtained from OP9-Dll1 culture (4-5 days of culture), 180-250K cells were used and cells were bound to 10 μL of activated concanavalin-A coated beads. The bead-bound cells were incubated with anti-rabbit antibodies for Runx1 (abcam, ab23980), Runx3 (gift from Dr. Yoram Groner57), TCF1(CST 2203, CST 2206, ab30961, ab183862, note that ab183862 was later discontinued due to cross-reactivity between different members of the TCF7 family), E2A (abcam, ab228699), HEB (Proteintech 14419-1-AP) or negative control antibody (guinea pig anti-rabbit antibody, Antibodies-Online, ABIN101961). Cells were incubated in 100 μL (180-250K cells) or 200 μL (400-500K cells) of antibody buffer (0.0005-0.001% wt/vol digitonin in wash buffer with 1 mM EGTA, 1-2 μg antibody) for 2 hours at 4 °C. After antibody incubation, permeabilized cells were washed with digitonin buffer (0.0005-0.001% wt/vol digitonin (EMD Millipore, 300410) in wash buffer) and incubated with 700 ng/mL of protein A-MNase (pA-MN) in a total volume of 250 μL for 1 hour at 4 °C. The pA-MN was purified by the Caltech Protein Expression Center from E. coli expressing pA-MN (Addgene # 86973). For chromatin digestion of thymic DN3 cells, cells were incubated with 2 mM CaCl2 in 150 μl digitonin buffer at 0 °C for 30 min, and the reaction was stopped by adding 100 μL 2X stop buffer (340 mM NaCl, 20 mM EDTA, 4 mM EGTA, 100 μg/mL RNase A (Thermo Fisher Scientific, EN0531), 50 μg/mL glycogen (Sigma-Aldrich, 10930193001), 0.0005-0.001% digitonin). For chromatin digestion of Phase 1 cells, cells were washed with low-salt rinse buffer (0.5 mM spermidine, 20 mM HEPES pH 7.3-7.5, 0.0005-0.001% digitonin, 1x protease inhibitor) and incubated with 200 μL of low-salt high-Ca2+ incubation buffer (3.5 mM HEPES pH7.3-7.5, 10 mM CaCl2, 0.0005-0.001% digitonin) at 0 °C for 5 min. After digestion, incubation buffer was quickly replaced with 200 μL of 1X STOP buffer (170 mM NaCl, 20 mM EGTA, 50 μg/mL RNAse, 25 μg/mL glycogen). Digested chromatin was released by incubating at 37 °C for 15 min and centrifuged at 4 °C at 16000g for 5 min. DNA was extracted by incubating with 0.1% SDS and 20 mg/mL of Proteinase K at 50 °C for 1 hour, followed by Phenol Chloroform extraction.
PU.1 titration by Runx1 addition
ChIP-seq was performed as described previously13,19,30,41. Briefly, Scid.adh.2c2 cells were infected with pMXs-PU.1-human NGFR or pMXs-control-human NGFR vector30 in combination with MSCV-Runx1-HA-mCherry or MSCV-control-mCherry vector. At day2 post-infection, NGFR+ cells were enriched using MACS LS magnetic columns and 7x10⁶of NGFR+ Scid.adh.2c2 cells were crosslinked with 1mg/mL DSG (Thermo Scientific 20593) followed by 1% formaldehyde, as described previously13,30. The reaction was quenched by 0.125M glycine. Nuclei were isolated by incubating crosslinked cells in Nuclei Isolation buffer (50 mM Tris-pH 8.0, 60 mM KCl, 0.5% NP40) and lysed in Lysis buffer (0.5% SDS, 10 mM EDTA, 0.5 mM EGTA, 50 mM Tris-HCl (pH 8)). The lysates were sonicated on a Bioruptor (Diagenode) for 18 cycles (one cycle: 30sec max power sonication followed by 30 sec rest). Rabbit or mouse anti-HA antibody (Santa Cruz or Cell Signaling Technology) was bound to Dynabeads anti-Rabbit or anti-mouse (Invitrogen) and incubated with sonicated chromatin in 1X RIPA buffer at 4°C overnight. Different antibodies were utilized for each experiment due to antibody discontinuation issue: rabbit anti-HA antibody (Santa Cruz, sc-805) for repeat 1, mouse anti-HA antibody (Santa Cruz, sc-7392) for repeat 2, and rabbit anti-HA antibody (Cell Signaling Technology, 3724S) for repeat 3. After washes, precipitated chromatin fragments were eluted in ChIP elution buffer (20 mM Tris-HCl, pH 7.5, 5 mM EDTA 50 mM NaCl, 1% SDS, and 50 μg proteinase K) by incubating at 65°C for 14 hours. Eluted DNA was cleaned up using Zymo ChIP DNA Clean & Concentrator (Zymo Research, D5205) according to manufacturers’ protocols.
ATAC-seq
ATAC-seq was performed by following published protocols with modifications58–60. Briefly, pro-T cells were FACS sorted and washed with 1X HBSS with 10mM HEPES pH 7.3-7.5 twice. Then, cell pellets were directly resuspended in 50μL of 1X Tagment DNA (TD) buffer (25μl 2X TD buffer from Illumina, 2.5 μL Nextera Tn5 transposase, 16.5 μL 1X PBS, 5 μL Nuclease free H2O, 0.01% wt/vol digitonin) per 25,000 cells. Reaction buffer was scaled up when using a higher number of cells and ATAC-seq was conducted using 30,000 – 50,000 sorted cells. After gently mixing pellets and the reaction buffers by pipetting, transposition was performed by incubating at 37°C for 30 min on thermomixer at 800 rpm. After transposition, DNA was isolated using Zymo DNA Clean & Concentrator kit (Zymo Research, D4013).
Single cell RNA-seq
For single cell RNA-seq, pro-T cells obtained from OP9-Dll1 culture were stained with surface antibodies followed by hashtag oligo labeling with TotalSeq A (BioLegend) anti-Mouse Hashtag 1-8 (1:50, in separate samples). After FACS sorting the target cells, samples were washed with 1X HBSS supplemented with 10% FBS and 10 mM HEPES pH 7.3-7.5 and resuspended to 1x10⁶ cells/1mL concentration. Then, 16,000 cells were loaded into a 10X Chromium v3 lane, and the subsequent preparation was conducted following the instruction manual of 10X Chromium v3.
Library preparation and deep sequencing
C&R libraries were prepared using NEBNext ChIP-Seq Library Preparation Kit (NEB) by following a previously published protocol61. ChIP-seq libraries were prepared using a NEBNext ChIP-Seq Library Preparation Kit (NEB) according to the manufacturer’s protocol. For generating ATAC-seq libraries, tagmented DNA was PCR amplified (7-8 cycles) by determining the number of amplification cycle for each sample using qPCR58,59 and size-selected for 150 bp – 3000 bp range using AMPure XP beads (Beckman Coulter A63880). Single cell RNA-seq cDNA libraries were prepared using 10X Chromium 3’ capture v3 kit. The single-cell hashtag oligo library was prepared by following the BioLegend TotalseqA guide. After the library preparation, the sequencing was performed with paired-end sequencing of 50 bp (C&R, ChIP-seq, and ATAC-seq) or 150 bp (single-cell RNA-seq) using HiSeq4000 by Fulgent Genetics, Inc. (Temple City, CA) or NextSeq by the California Institute of Technology Genomics core. Libraries were sequenced to the following targeted read depths: C&R libraries, 10 million reads; ChIP-seq libraries, 30 million reads; ATAC-seq libraries, 40 million reads. Single cell RNA-seq cDNA libraries were sequenced to a targeted depth of 65,000-70,000 reads per cell and hashtag oligo libraries were sequenced for 2,000-2,500 reads per cell.
C&R, ChIP-seq, and ATAC-seq analyses
Sequenced reads from ChIP-seq and C&R libraries were mapped to the mouse reference genome GRCm38/mm10 using Bowtie2 (v3.5.1)62. PCR duplicates were removed using Samtools (v.1.9) and reproducible peak calling was performed using a HOMER (v.4.11.1)63 adaptation of the Irreproducibility Discovery Rate (IDR) tool according to ENCODE guidelines. For downstream analysis, peaks with a normalized peak score ≥ 15 (for ChIP-seq) or peak score ≥ 10 (for C&R) were considered. Publicly available ATAC-seq data (GSE100738) were downloaded as raw sequence read files and mapped onto GRCm38/mm10. After filtering out PCR duplicates and mitochondrial reads using Picard (v.3.0.0), peak calling was conducted with Genrich (v.0.6). Peaks were annotated to genomic regions using HOMER package (annotatePeaks.pl). Genes associated with C&R peaks were annotated using GREAT (v.4.0.4) with proximal: 5kb upstream, 1kb downstream, plus distal: up to 1000kb mode64. For UCSC Genome Browser visualization, bigwig files were generated from the aligned bam file using deepTools (bamCoverage --binSize 20 --normalizeUsing CPM).
Differentially occupied peak analysis was performed using a HOMER package (getDifferentialPeaks.pl) defined by fold-change greater than 2 and Poisson p-value lower than 0.001. The resulted groups were visualized as heatmaps or area proportional Venn diagrams or scatter plots. Area proportional Venn diagrams were generated using Python Matplotlib-venn tools (v.0.11.7) or R eulerr package (v. 6.1.1). Scatter plots were generated by counting tag densities from indicated tag directories. The resulting tag counts per 10 million reads (base 2 logarithmic converted) were visualized using Python holoviews (v.1.15.0) with datashader (v.0.14.2) operation.
Peak centered heat maps were created with a deepTools265 (v 3.5.1) in a 3000 bp region by computing matrix (computeMatrix reference-point --referencePoint center -b 1500 -a 1500 -R -S --skipZeros) and then visualized (plotHeatmap). In order to determine reference points for heat maps, co-occurring or unique peaks were computed using the HOMER package (mergePeaks -venn) and each cluster groups were defined by Boolean logic. Only non-promoter peaks were considered unless marked as “promoter”. Promoters were defined from −1kb to +100bp using Homer package.
Motif density, enrichment, and quality analyses
For quantitative analysis of motif frequencies, we used the HOMER package (findMotifGenome.pl) using a 200bp window and De novo results were utilized. We first examined whether the DNA sequences in each group were more or less favorable for recruiting Runx factors themselves, by analyzing the frequency of a Runx motif occurrence per peak (normalized to the peak size). The frequency of motif occurrence in regions of 2000 bp surrounding the C&R or ChIP-seq peak sites were analyzed by using a HOMER package (annotatePeaks.pl -size <#> -hist <#> -m <motif file>). The resulting histograms were visualized using Python bokeh plotting (v.2.4.3).
The motif score results throughout this paper represent the best motif quality in the peak, based on position weight matrix (PWM, referred to as a motif score). The motif score of each peak was calculated as described previously13 using a HOMER function (annotatePeaks.pl -m <motif file> -mscore).
Published data used
The publicly available data utilized for analysis are presented in Supplementary Table 7. Publicly available data were utilized by downloading raw sequence read files using SRA toolkit Fastq-dump (ver 2.10.9). Fixatives used in ChIP-seq are identified as FA, formaldehyde; DSG, disuccinimidyl glutarate.
ChromHMM for analysis of local chromatin states and long-range analysis of chromatin A/B compartments
The chromatin states of pro-T cells were inferred utilizing ChromHMM (v. 1.23)33,66 by learning models using previously published histone mark ChIP-seq data23 and CTCF, SMC3 ChIP-seq34. ChromHMM calculates the most probable state for each genomic segment based on a multivariate hidden Markov model (HMM)33,66. For our ChromHMM analysis, we utilized ATAC-seq (chromatin accessibility), H3K4me2 marks (active histone), and H3K27me3 marks (repressive histone), from DN1 cells (representing pre-commitment stage) and DN2b cells (representing post-commitment stage), along with CTCF and SMC3 (DNA loop-forming machineries) binding data from DN2 cells22,23,34. ChromHMM defined 20 different chromatin states in pro-T cells, which included Phase 1-preferential active sites (state 1-4), Phase 2-preferential active sites (state 5-7), active sites in both stages (state 8-11, 14), weakly repressed or bivalent regions (state 12, 13), and the sites that were repressed in all stages (state 15, 16) (Extended Data Fig. 2c). For computing chromatin state using ChromHMM, we followed the authors’ instructions33,66. Briefly, replicated DNA sequencing bam files were merged using Samtools, then binarized using a ChromHMM function (BinarizeBam). Using binarized bam files, the chromatin state models were calculated for the mm10 genome (LearnModel). To compare association between the computed chromatin states and different groups of Runx binding sites, previously defined Group 1, 2, 3, and promoter Runx binding sites were provided as a set of external annotation data, and the enrichment was calculated (OverlapEnrichment).
The A/B compartment analysis was performed by using previously reported HiC data21 after converting mm9 20kb-bin tracks (GSE79422) to mm9 1kb-bin tracks, and then lifting over mm9 1kb-bin tracks to mm10 1kb-bin tracks.
Single cell RNA-seq analyses
The raw reads from cDNA and hashtag oligo libraries were processed as previously described43. Briefly, cDNA libraries were aligned to the mouse reference genome GRCm38/mm10 using CellRanger3 and the hashtag oligo libraries were quantified and demultiplexed using in-house tools (hashtag_tool)43. Seurat v467 was utilized for QC and downstream analysis. For QC, singlets (cells displaying unique hashtag oligo identity) expressing at least 1300 genes (transcript > 1) were considered. Outlier cells expressing more than 6800 genes (potential doublets) and displaying high mitochondrial RNA contents ( > 1 %) were further filtered out. Two independent experiments were integrated with reciprocal principal component analysis (PCA) algorithm using the 5000 anchor features. After data integration, PC analysis was performed, and the first 30 PCs were utilized for computing tSNE and UMAP parameters. The pathway enrichment in each cell was conducted with single-sample gene set enrichment (ssGSEA) tool (v10.0.1, https://github.com/GSEA-MSigDB/ssGSEA-gpmodule). The pseudotime inference was performed using Monocle3 68,69 by defining the root principal node based on the known gene expression pattern of early thymic progenitors (Flt3>5 & Kit>1 & Lmo2 > 1 & Il2ra<0.1 & Tcf7<0.1). To determine the UMAP2 acceleration time window, first, linear regression was performed using UMAP2 values and pseudotime scores from control cells. Then, residual values (predicted pseudotime score based on linear regression fit vs. the observed pseudotime score) were calculated. UMAP2 window −30 to 5 was chosen as more than 50% of residuals of OE cells were greater than interquartile residual values of control cells. For visualization of Seurat4 and Monocle3 analysis results, ggplot2 (v. 3.3.5) and cowplot (v. 1.1.1) packages were utilized.
To infer gene regulatory network (GRN) connections using SCENIC, the integrated Seurat object was converted to loom files using SeuratDisk and SeuratData, and then pySCENIC (v.0.11.2)48,70 was employed to compute co-expression network and search for potential direct target genes. The default parameters and the standard workflows were applied. Results were visualized with matplotlib (v.3.5.3).
Differentially Expressed Gene analysis
To define differentially expressed genes (DEGs), we first excluded alternative lineage clusters (clusters 12-16) to focus on the cells on the T-developmental pathway. Differential expression tests were conducted using a Wilcoxon rank sum test (Wilcox.test) employing a Seurat tool (FindMarkers) with pseudocount = 0.1, min.pct=0.2, min.cells.group=3, min.cells.feature=3 parameters. Genes displaying absolute fold-change > 1.5, adjusted p-value<0.001 were considered as DEGs. “Expressed” non-DEGs were defined by 1) their detection via scRNA-seq and then 2) not sensitive to any of Runx perturbation (KO nor OE) at any timepoints. A gene was defined as a Runx core-DEG if it was sensitive to both Runx1 OE and Runx1/Runx3 KO perturbations showing reciprocal activation or inhibition under these two conditions. See Supplementary Tables 1 and 2 for the full lists of DEGs from this study and the comparison with previously published bulk-RNAseq results1. Note that previous bulk-RNAseq results do not fully exclude cells that represent alternative lineage clusters.
C&R defined binding and Runx functional target gene association analysis
To test whether a gain or loss of Runx binding is associated with Runx-mediated gene regulation, different groups of Runx peaks were annotated with putatively associated genes using GREAT and enrichment patterns were calculated as described previously1. Briefly, presence of any non-promoter Runx peak(s) in surrounding genomic regions of each transcript in DEG and non-DEG groups was scored. Then, the following statistics were further examined: (1) the percentage of genes in each category linked to Runx binding, (2) whether Runx binding is equally or not equally distributed between DEG vs. non-DEGs by performing Fisher’s exact test, (3) whether different classes of DEGs (activated or inhibited, scored by KO or OE or both) had preferential enrichment for a certain group of Runx binding using the z-score, which is calculated by standardized residual analysis (Extended Data Fig. 9a). We also calculated how the Runx occupancies around different expression groups of target genes may differ in their representation of particular site Groups, i.e. which kinds of binding peaks are most likely to be found around genes with different response types (activated/ inhibited DEGs, etc.). The number of peaks in a given binding category (Group) was divided by the total number of Runx peaks annotated to each gene, these tallies were aggregated for all the genes in a given response class, and the percent of each group of peaks was reported (Extended Data Fig. 9b).
Statistics
Nonparametric tests comparing two distributions were performed by two-sample Kolmogorov-Smirnov test (Figs. 1f and 6d and Extended Data Figs. 3c and 10c). Nonparametric tests comparing matched pairs were computed using Wilcoxon signed-rank test (Fig. 5b, e, f, Extended Data Fig. 6b, c). To compare the average of two groups, two-sided t-test was performed (Fig. 2d, 2e). Mann-Whitney test was performed to compare two independent variables not following the normal distribution (Fig. 2f, Extended Data Figs. 3a, 4a, d). To test the effect of two independent variables on a dependent variable, Two-way ANOVA with Šídák’s multiple comparisons was utilized (Fig. 7a, Extended Data Figs. 3b). The Kruskal–Wallis test by ranks was used to compare pseudotime progression rate (Fig. 4b). To assess linear correlation between two different parameters, Pearson correlation coefficient (Pearson’s r) was calculated (Fig. 3f, 4c, Extended Data Fig. 5e). The monotonic correlation between two parameters were tested using Spearman’s rank correlation coefficient (Fig. 4c). Linear regression analysis was conducted to find the best fit line for UMAP2 values and Pseudotime scores of Control groups (Fig. 4c). Fisher’s exact test and standardized residual analysis was conducted to evaluate association between categorical variables (Extended Data Fig. 5c, 9a). Parametric statistical tests were performed when data met the assumptions of normality. Equal variances were tested formally, and data did not meet equal variances were handled with adjustment, such as Welch’s correction. For data that does not follow the normal distribution, non-parametric tests, such as Wilcoxon signed-rank test and Kolmogorov-Smirnov test were performed.
Two-way ANOVA, two-sided t-test, the Kruskal-Wallis test, Mann-Whitney test, and Wilcoxon signed-rank tests were performed using Prism software (v.9.4.1, GraphPad). Two-sample Kolmogorov-Smirnov test, Pearson’s r calculation, and Spearman’s rank ρ calculation were performed using scipy.stats. (v.1.9.1) from Python (v.3.8.13). Linear regression analysis, Fisher’s exact test, and standardized residual analysis were performed using R (v.4.1.1). * P < 0.05; ** P < 0.01; *** P < 0.001 for t-test, Mann-Whitney test, Kruskal-Wallis test, Wilcoxon signed-rank test, two-way ANOVA, and Kolmogorov-Smirnov test. * |z-score| > 1.9599; ** |z-score| > 2.5758; *** |z-score| > 3.2905 for standardized residual analysis.
Study design:
Samples were not randomized because the same biological input sample or sample pool was split in each case to different treatments, either to generate Runx1 OE and controls or to generate Runx1, Runx3 dKO and controls. Blinding was not used because the types of genomic, transcriptomic, and flow cytometric data being collected are intrinsically quantitative while providing internal evidence for sample identity as well as sample quality. No statistical power calculation was done to select sample numbers in advance of experiments. Sample sizes were similar to or greater than those used in previous publications1,40,43,71. However, it is possible that additional effects less pronounced than those discussed here could have occurred but have missed a significance threshold.
Extended Data
Extended Data figure 1. Distinct motif enrichment patterns in dynamically shifting Runx binding sites, comparison with PU.1 site stability, and efficient detection of direct Runx binding sites by CUT&RUN.

a, Heatmap illustrates PU.1 binding profiles in immortalized HSPC, DN1, DN2a, and DN2b cells. b, Top motifs enriched in Runx binding sites from indicated regions of Figure 1b are shown. Statistical significance was computed using Homer De novo motif discovery algorithm. c, Scatter plots and Area-proportional Venn diagrams compare Runx1 and Runx3 binding sites in Phase 1 and Phase 2 pro-T cells, as measured by ChIP-seq cross-linked with DSG+FA vs. by CUT&RUN (C&R). Numbers in the Venn diagram indicate number of differential peaks compared between DSG-crosslinked ChIP-seq vs. C&R (fold enrichment > 2, Poisson enrichment P < 0.001). d, Violin plots show Runx motif quality position weight matrix (PWM) score in non-promoter Runx peaks detected similarly by ChIP-seq and C&R (purple) or preferentially detected by different technique (green; more efficiently detected by C&R, red; more efficiently detected by ChIP-seq). The horizontal dotted black line shows threshold PWM score to be recognized as a Runx motif. Thin vertical black bars mark minima and maxima values and thick vertical black lines indicate 25th to 75th percentiles range. The red lines with white circles show median values. e, Motif frequencies for Runx, bHLH, ETS, and PU.1 or TCF1 (Tcf7) factors within each peak are displayed.
Extended Data figure 2. Runx TFs predominantly interact with active large-scale chromatin compartments, yet local chromatin state is not a major barrier for stage-specific redeployment of Runx factors.

a, Percentages of ChIP-seq or C&R-detected Runx binding sites that are open or closed at a given stage is shown. Only non-promoter sites were calculated as most of the promoter sites are stably accessible. b, Bar graph displays percentages of Runx binding sites detected by ChIP-seq or C&R that are in compartment A or compartment B regions. c, Bar graph depicts the percentage of ATAC-defined open chromatin regions among Runx binding sites within compartment (comp) A, B, or N. d, Genomic regions were assigned to compartment A (active, HiC PC1 value ≥ 10), compartment B (inactive, HiC PC1 value ≤ −10), and compartment N (neutral, −10 < HiC PC1 value < 10) in 1kb-bins from DN1 (ETP), DN2, and DN3 cells (data from ref. 21). Regions stably maintaining compartment states (A-to-A or B-to-B) vs. the regions undergoing compartment flipping were categorized and their enrichments within different groups of Runx binding sites or total genomic regions were compared. Graphs in inset show expanded-scale view from Extended Data Fig.2d to record rare changes in genomic compartment reprogramming during DN1 (ETP) to DN3 progression. e, Representative UCSC genome browser tracks near Bcl11b and Ets1 regions show compartment state (represented with HiC PC1 values), DN1 and DN3 Runx occupancies, and published ATAC signals with CTCF and SMC3 ChIP-seq. f, Heatmaps represent distinct chromatin states computed using ChromHMM. The enrichments of different histone marks, ATAC, and loop-forming machineries (CTCF, SMC3) with each chromatin state are shown in purple (left). Genomic annotation for chromatin states is displayed in orange (middle). Enrichment with different groups of Runx peaks is illustrated in blue (right). Constitutively occupied Group 3 peaks and promoter peaks were enriched among constitutively active chromatin states (states 8 and 9), as expected, and Group 1 peaks (losing Runx binding from Phase 1 to Phase 2) had the highest enrichment within Phase 1-preferential active states (states 1 and 2). In contrast, the Group 2 sites newly occupied during commitment were more enriched among constantly accessible regions with weak H3K4me2 marks (state 10), even more than they were enriched for Phase 2-specific active states (states 5 and 6). Constitutively active states (states 8 and 9) were also enriched for Group 2 peaks, and Group 2 peaks were also the only group showing enrichment among sites that were largely ATAC-closed in both Phase 1 and Phase 2 (state 7). g, UCSC genome browser profile shows Runx factor binding patterns near Meis1 locus in Phase 1 and Phase 2, together with ATAC-seq and histone ChIP-seq (H3K4me2, H3K27me3, CTCF, SMC3) tracks. ChromHMM chromatin states are displayed as a colormap at the bottom.
Extended Data figure 3. Increase in Runx1 protein availability changes Runx1 binding site choices in the presence of PU.1 in DN3-like cells.
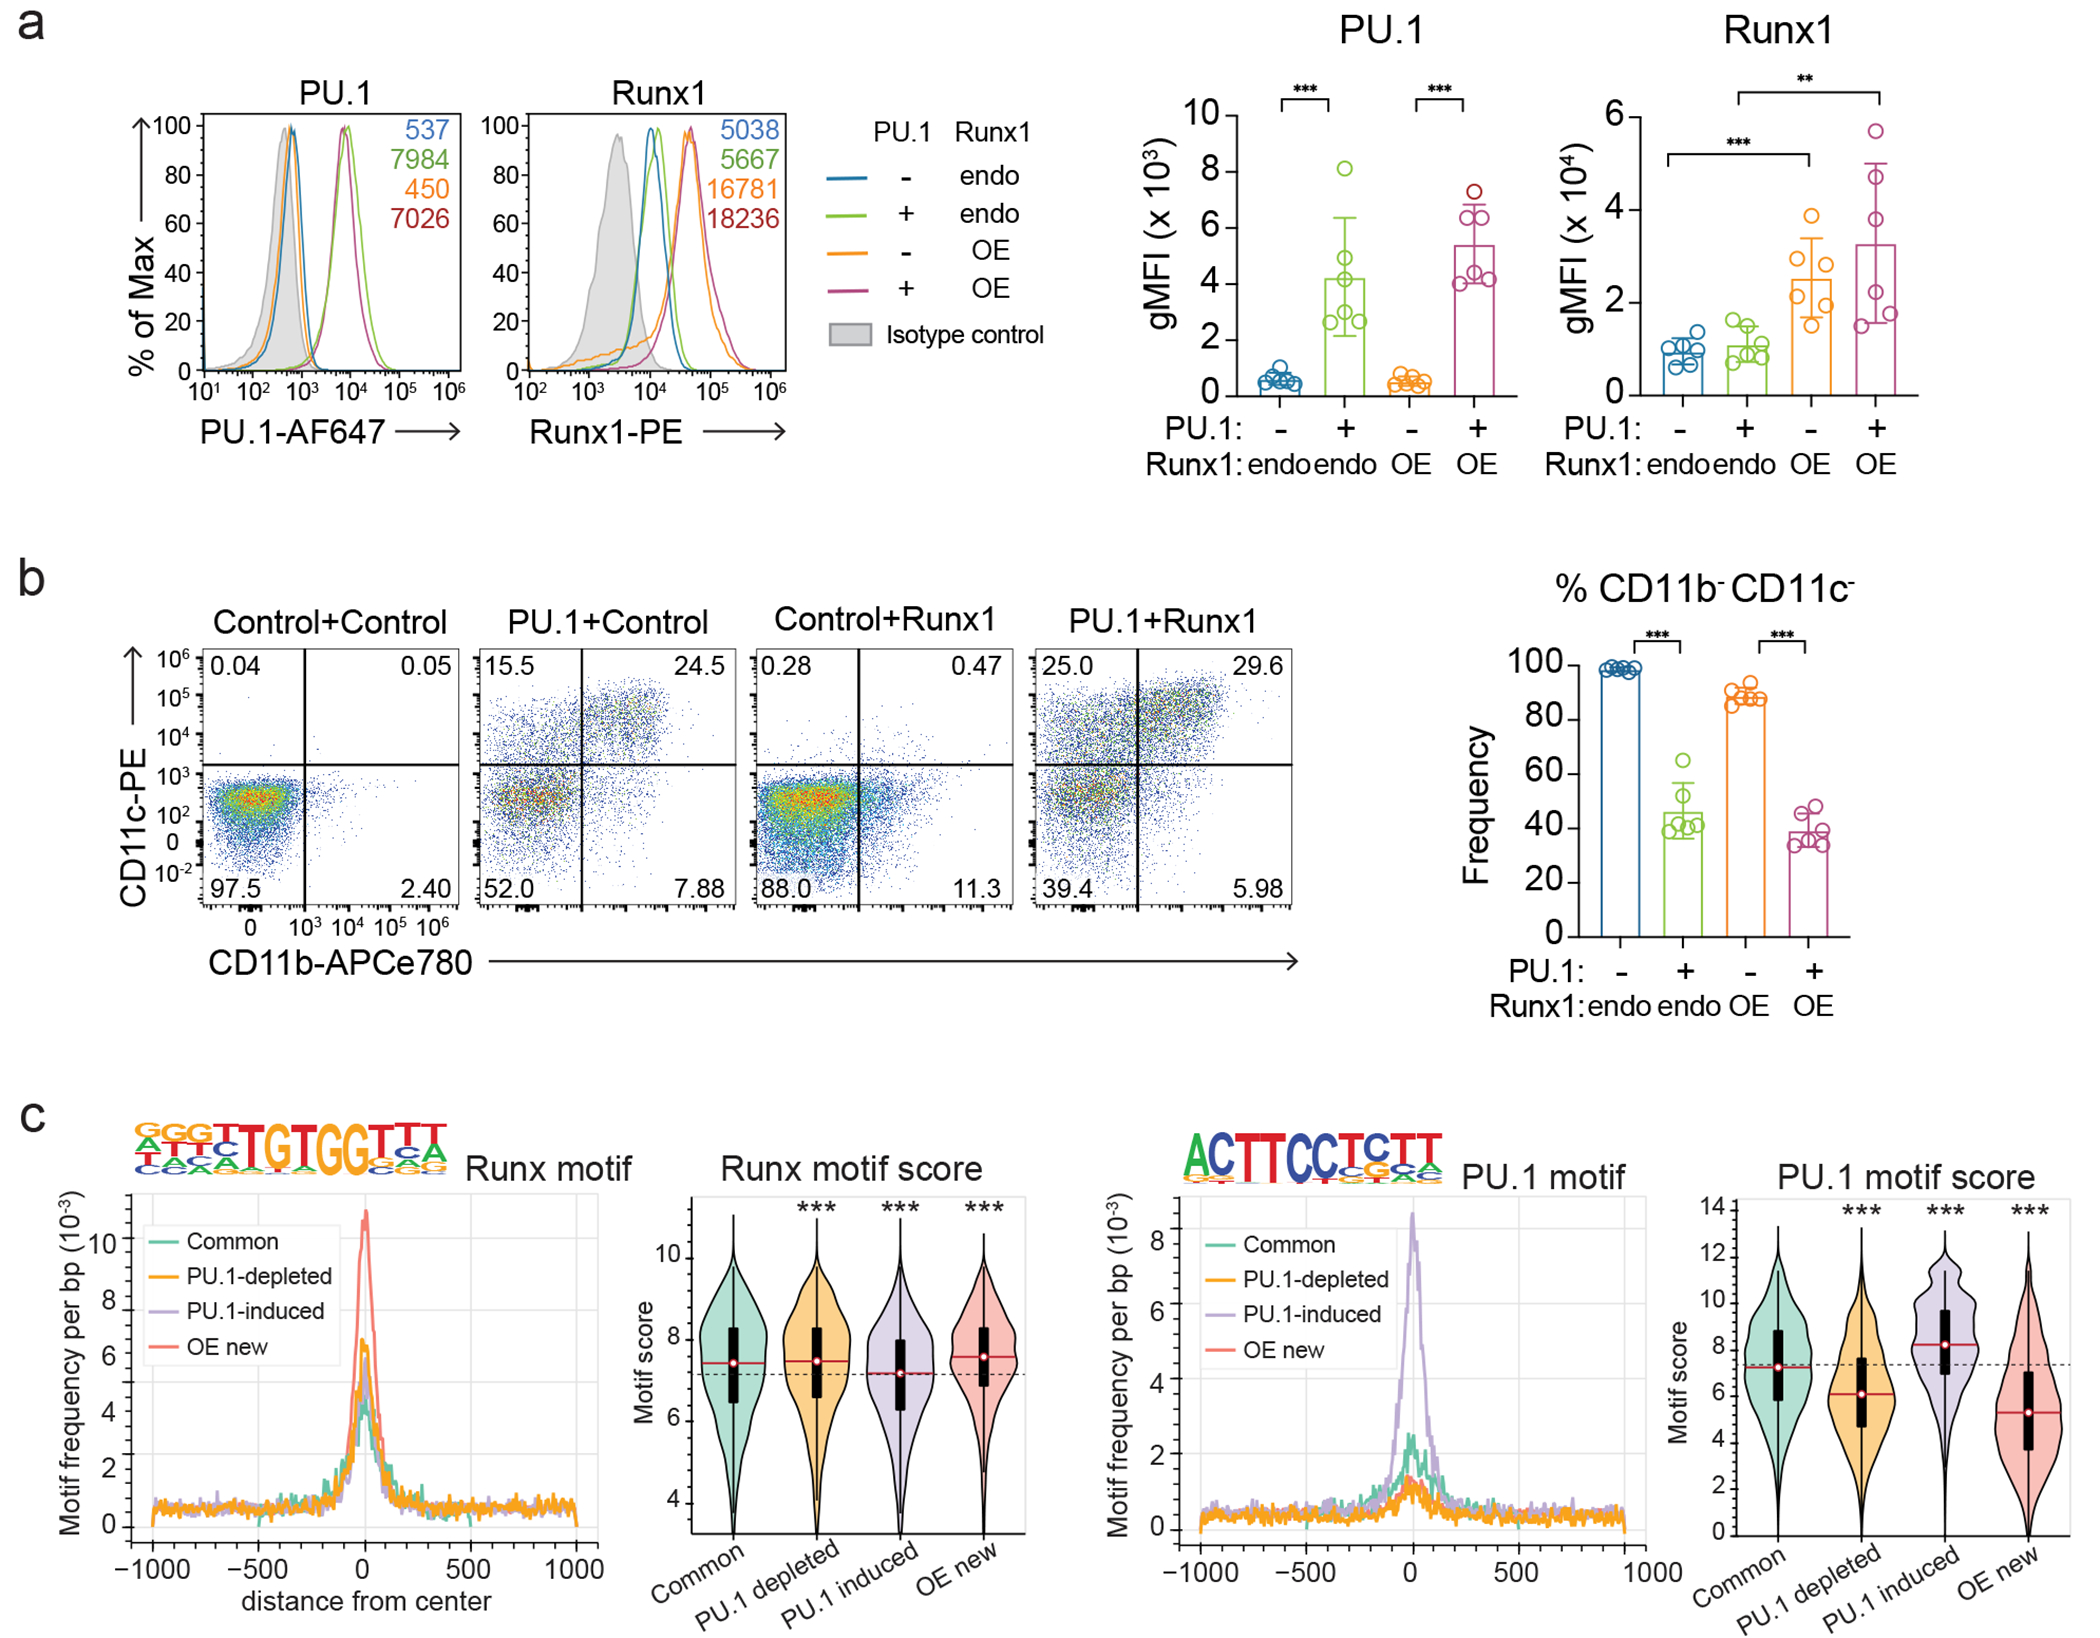
a, Histograms show protein expression levels of PU.1 and Runx1 after introducing PU.1 and/or Runx1-expressing vectors. Numbers within histograms indicate geometric mean fluorescent intensities (gMFI). Bar graphs summarize gMFIs of PU.1 and Runx1 with means and standard deviations. 6 independent experiments. Mann-Whitney test. For PU.1 gMFI comparisons, *** P = 0.0006. For Runx1 gMFI comparisons, *** P = 0.0006 and ** P = 0.007. b, Expression of non-T-lineage markers, CD11b and CD11c, were measured using flow cytometry. Bar graphs show frequencies of cells that do not express these markers. Mean and standard deviation from 6 independent experiments are displayed. Two-way ANOVA with Šídák’s multiple comparisons. *** P < 0.0001. c, Density plots display motif frequencies for Runx1 and PU.1 in each peak and violin plots illustrate the best motif qualities for Runx1 and PU.1 in a given peak. The horizontal dotted black line shows threshold PWM score to be recognized as a Runx or PU.1 motif. Thin black lines mark minima and maxima values and thick vertical black bars show 25th to 75th percentiles range. The red lines with white circles indicate median values. Two sample Kolmogorov-Smirnov (KS) tests, comparing each to motif scores of “Common” peaks defined in Fig. 2b. *** P < 0.0001. n of Common peaks = 4,047, n of PU.1-depleted peaks = 5,081, n of PU.1-induced peaks = 5,369, n of OE new peaks = 17,085.
Extended Data figure 4. Protein expression levels of developmentally important transcription factors are sensitive to Runx factor dosage in Phase 1.
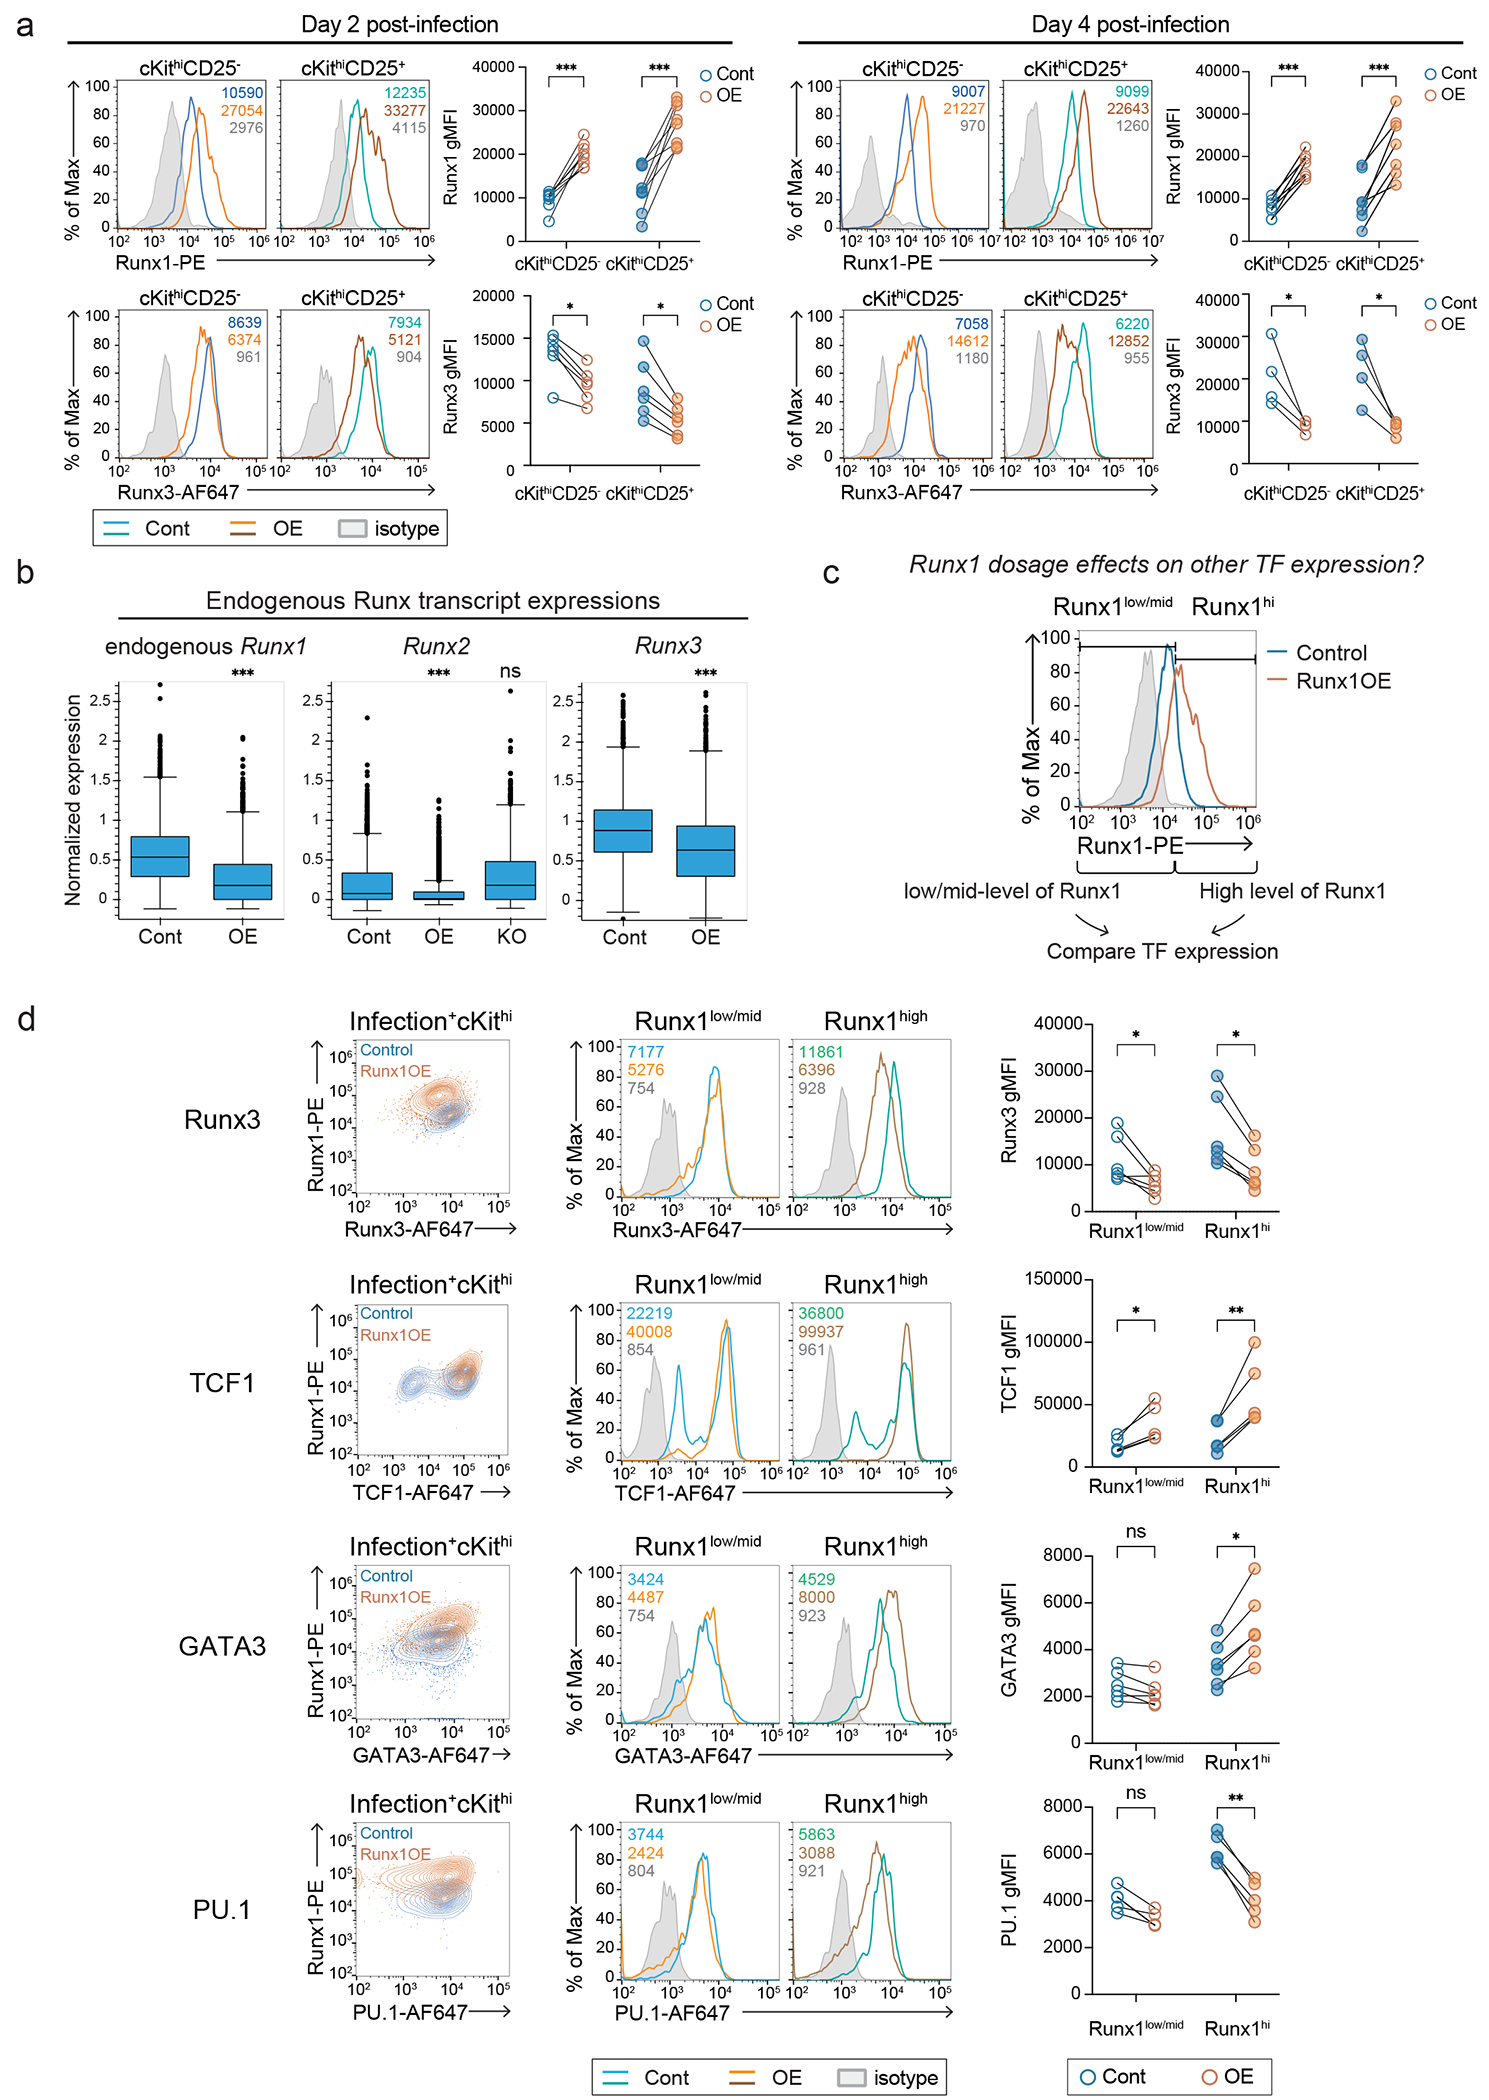
a, Representative histograms display Runx1 (top) or Runx3 (bottom) expression levels at 2 days (left) or 4 days (right) after transducing Runx1 OE or empty-control vectors. Cells were gated on live alternative lineage− infection+ cells, then separated as cKithi CD25− (DN1) and cKithi CD25+ (DN2a) populations. Graph summarizes results from 4-8 independent experiments. Mann-Whitney test. *** P = 0.0002 for Runx1 gMFI on d2pi (n = 8), *** P < 0.0006 and ** P = 0.007 for Runx1 gMFI on d4pi (n = 6). For comparing Runx3 gMFI, * P = 0.0411 for d2pi (n = 6) and * P = 0.0286 for d4pi (n = 4). b, Runx1, Runx2, and Runx3 mRNA expression levels in Runx1 OE, Runx1/Runx3 knock-out (KO), and control cells. Runx transcript levels were measured using single cell RNA-seq described in Figure 3. Differentially expressed gene statistics were calculated using a Wilcoxon test employing a Seurat algorithm. Bounds of box extends from 25th to 75th percentiles, median is indicated using horizontal line, and whiskers show the minima and maxima values. Points show outliers. c, Flow cytometry analysis strategy to test Runx1 dosage effects on regulating other TFs. Runx1 expression levels in control vs. Runx1 OE cells were compared using histogram overlay, then cells expressing low or mid-levels of Runx1 (Runx1low/mid) and cells with high levels of Runx1 (Runx1hi) were determined. d, TCF1, GATA3, and PU.1 expression levels in Runx1low/mid vs. Runx1hi cells in control and Runx1 OE cells were compared. Numbers inside the histograms are gMFI values. Graphs summarize 6 experiments. Mann-Whitney test. * P = 0.04 for Runx3, ** P = 0.0079 and * P = 0.0321 for TCF1, * P = 0.04 for GATA3, ** P = 0.0079 and * P = 0.0159 for PU.1, ns=not significant.
Extended Data figure 5. Single-cell transcriptome analyses of Runx perturbations: deviations from normal developmental clusters due to effects on core target genes responding to both gain- and loss-of-functions.

a-b, tSNE 1-2 (a) and UMAP1-2 (b) display transcriptomes of control- or Runx1 overexpressed (OE) or Runx1/Runx3 knockout (KO) cells at indicated timepoints (left). Genes associated with different stages of cell cycles are illustrated on tSNE 1-2 (right). Top panels show location of cells before cell-cycle regression and bottom panels illustrates distribution of cells after cell-cycle regression. Note that Runx1 OE tends to shift population toward G1 while KO shifts cells toward G2/M, but Runx perturbation states do not separate well on tSNE 1 or UMAP1 axis. c, Cluster distributions of indicated Runx-perturbation conditions are shown. Size of each dot represents number of cells and colormap indicates z-score from standard residual analysis followed by Fisher’s exact test. d, Expression patterns of stem or myeloid-associated genes, Cd81, Csf2b, Meis1, and Ifngr2 are displayed on UMAP2-3 axes. e, Scatter plots compare Log2 fold-changes (FC) in gene expression between Runx1 OE vs. control or Runx KO vs. control populations at different timepoints (d2 vs. d4 after introducing OE conditions, d3 vs. d5 after delivering gRNA for KO conditions). Each dot represents a different gene. D2pi OE DEGs vs. d4pi OE DEGs Pearson correlation r = 0.87 and d3pi KO DEGs vs. d6pi KO DEGs Pearson correlation r = 0.67. n of d2pi OE DEGs = 337, n of d4pi OE DEGs = 468, n of d3pi OE DEGs = 189, n of d6pi OE DEGs = 249. f, Heatmap illustrates expression profiles of the common Runx target genes sensitively responding to both Runx1 OE and Runx KO. Each cluster is sorted by developmental progression order.
Extended Data figure 6. Runx1 overexpression inhibited myeloid and granulocyte program, while supporting NK cell program even after inducing Bcl11b expression.

a, Schematics illustrate experimental design for competitive commitment assay. Empty control or Runx1 overexpression vectors expressing different markers were cultured with OP9-Dll1 to initiate T cell development. After 2 days, DN1, Bcl11b−DN2a, and Bcl11b+ DN2a cells were each sorted from each condition. The same number (100 cells) of the same stage cells from control and Runx1 OE conditions were co-cultured with Notch-signaling (OP9-Dll1) or Notch nonsignaling (OP9-Control) stromal cells for 6 days, supplemented with IL-7 and Flt3-ligand. Throughout Extended Data Fig. 6, data derived from the indicated input populations were from 2 independent experiments, totals of 8 wells for OP9-Dll1 and totals of 11 or 12 wells of each input population for OP9-Control. For OP9-Dll1, n of 4 wells were analyzed for each population in both Exp1 and Exp 2. For OP9-Control, n of 6 wells were used for DN1, Bcl11b− DN2a, Bcl11b+ DN2b (Exp1), and n of 6 wells for DN1, Bcl11b− DN2a and 5 wells for Bcl11b+ DN2b (Exp2), Data point shapes indicate independent experiments (circle for Exp1 or triangle for Exp2). b, Representative flow plots show competition outcomes between Control (x-axis) vs. Runx1 OE (y-axis) from each condition. Graphs summarize the absolute numbers and frequencies of vector-expressing control vs. Runx1 OE populations in both conditions. Runx1 OE cells were disfavored with and without Notch signaling. Wilcoxon signed-rank test. For OP9-Dll1 numbers, * P = 0.0078 for Bcl11b− DN2a and Bcl11b+ DN2a. For OP9-Control numbers, *** P = 0.0005 for DN1 and Bcl11b− DN2a, and ** P = 0.0098 for Bcl11b+ DN2a. For OP9-Dll1 frequencies, * P = 0.0078 for Bcl11b− DN2a and Bcl11b+ DN2a. For OP9-Control frequencies, *** P = 0.0005 for DN1 and Bcl11b− DN2a, and *** P = 0.001 for Bcl11b+ DN2a. ns=not significant. c, Expression of NK1.1 vs. Ly6G/Ly6C were measured by flow cytometry after culture without Notch signals. Graphs show frequencies of cells expressing Ly6G/Ly6C or NK1.1 in cells. Wilcoxon signed-rank test. *** P = 0.0005 for % Ly6G/Ly6C+cells, *** P = 0.0010 and ** P = 0.0034 for % NK1.1+ cells, ns=not significant.
Extended Data figure 7. Elevated Runx1 levels in Phase 1 resulted in additional Runx occupancies in post-commitment preferred sites and closed chromatin regions.

a, Gating strategy to sort Phase 1 cells for C&R is illustrated. Briefly, bone-marrow progenitor cells were co-cultured with OP9-Dll1 cells for 2 days, and empty control or Runx1 overexpressing vector was retrovirally introduced. After 40-42 hours (total 4 days of culture on OP9-Dll1 cells), infection+ Phase 1 cells were sorted. In this system, for most cells to reach Phase 2 normally, 8-10 days of culture are needed1,71. b, Scatter plots and Venn diagrams compare differential Runx1 occupancies at promoter (top) and non-promoter regions (bottom) when Runx1 concentration was increased. Numbers indicate differential Runx1 binding sites (fold enrichment > 2, Poisson enrichment P < 0.001). c, Runx1 C&R signal intensities from indicated cells are shown. Note increased occupancy even at Group 1 and Group 3 sites which were already bound in control Phase 1 cells. d, Bar graph represents compartment state profiles within different groups of Runx binding sites. e, Testing hypothesis that Runx1 OE accesses sites conditionally occupied in other pro-T related contexts. Area-proportional Venn diagrams show analysis strategy to identify Runx binding sites appearing specifically in Bcl11b knockout DN2b/DN3 cells (left), and ILC2-specific Runx binding sites (middle; Runx1, right; Runx3). f, Bar graph shows percentages of Group 4 peaks overlapping with indicated Runx binding site types. g, Density plots illustrate motif frequencies for PU.1, TCF1 (Tcf7), bHLH, and GATA factors in different types of Runx binding sites. h, Runx1, Runx3 (blue), PU1 (purple)23, TCF1 (red), E2A and HEB (green) binding profiles in non-promoter regions under unperturbed Phase 1 or Phase 2 conditions are shown. Runx1 binding patterns in empty vector control and Runx1 OE transduced conditions are displayed in orange tracks (left). Stage-preferential dynamic binding groups are indicated as color bars. Group 1, Phase 1-preferential; Group 2a, Phase 2-preferential and precociously occupied by OE; Group 2b, Phase 2-preferential but not occupied by OE; Group 3, Phase 1 & Phase 2 shared; Group 4op, OE-specific and open sites; Group 4cl, OE-specific and closed sites. The numbers on the right side indicate percent of each group of peaks within the same color bar. TCF1, E2A, and HEB binding sites were measured in independent replicates using C&R from thymic DN3 cells. PU.1 occupancy was previously determined using ChIP-seq23.
Extended Data figure 8. Runx factors engage functional target gene regions together with PU.1, TCF1, and E-proteins.

UCSC genome browser tracks show Runx binding patterns (orange tracks, experimental conditions; blue tracks, unperturbed pro-T cells), PU.1 in DN1 cells, TCF1 in DN3 cells, E2A and HEB in DN3 cells, and ATAC-seq signals (black) in Phase 1 (DN1) and Phase 2 (DN2b) cells. a, Regulatory regions for genes highly expressed in Phase 1 (Plek, Lmo2, and Meis1) are displayed. b-c, Regulatory regions for genes highly expressed in Phase 2 are shown. b, Light red highlights mark Group 2a sites near Cd3 clusters, Tcf7, and Thy1 occupied under conditions of Runx1 OE. c, Genomic regions near Gata3 and Myb show indicated TF binding profiles. Green highlights mark co-occupancy of Runx, PU.1, TCF1, and E-proteins.
Extended Data figure 9. Distinct associations of transcriptional regulatory function with different Groups of Runx binding sites.

a, Specific associations between different classes of Runx binding sites and Runx DEGs are tested using Fisher’s exact test. Graphs visualize the percentages of the genes associated with such peaks (height of the spike) and the number of genes possessing at least one Runx binding in DEG groups (size of hexagon). Gray bars to the left of each plot indicate the percentages of genes associated with each peak type among non-responding DEGs, and broken line uses this level as a reference for DEG enrichment. All site types except Group 4cl sites were significantly enriched among DEGs relative to non-DEGs (shown by relatively higher of spike heights compared to non-DEGs). Color map compares particular types of response to Runx perturbation as compared to other responses to perturbation, among the DEGs with a given site type. Colors depict z-scores (standardized residuals), calculated for relative enrichment of a given association within the DEG groups. For example, dark cyan indicates that genes linked to a given site Group are especially positively enriched for the indicated response type. See Methods for how the non-DEGs and the core DEGs were defined. n of non-DEGs = 9471, n of OE only activated genes = 316, n of KO only activated genes 65, n of OE&KO activated genes = 100, n of OE only inhibited genes = 166, n of KO only inhibited genes 135, n of OE&KO inhibited genes = 46. *** Z score of Group 1 = −2.53, ** Z score of Group 1 = 2.22; *Z score of Group 3 = −3.36, * Z score of Group 3 = 1.94; *** Z score of Group 2b = 3.52; *Z score of Group 2a = −4.09, * Z score of Group 2a = 1.90. * |z-score| > 1.9599; ** |z-score| > 2.5758; *** |z-score| > 3.2905.b, Association of different groups of Runx binding sites with Runx target genes are shown. Violin plots show percent of each group of Runx peaks among total number of Runx peaks in a given gene. Runx peak groups are presented in an order of both empty vector-control and Runx1 OE binding sites (Group 1 and Group 3), preferentially occupied by Runx1 OE (Group 2b and Group 4), and post-commitment sites not occupied by experimental conditions in Phase 1 (Group 2a). Thin vertical black lines mark minima to maxima value range and thick vertical black boxes show 25th to 75th percentiles range. The white circles indicate median values. c, Diagrams show a schematic summary of different groups of Runx peaks found commonly near Runx DEGs and Runx non-DEGs (Runx-independent). Note that each gene can possess multiple types of Runx peaks.
Extended Data figure 10. Runx factors function together with other TFs and control distinct sets of T-developmental genes.
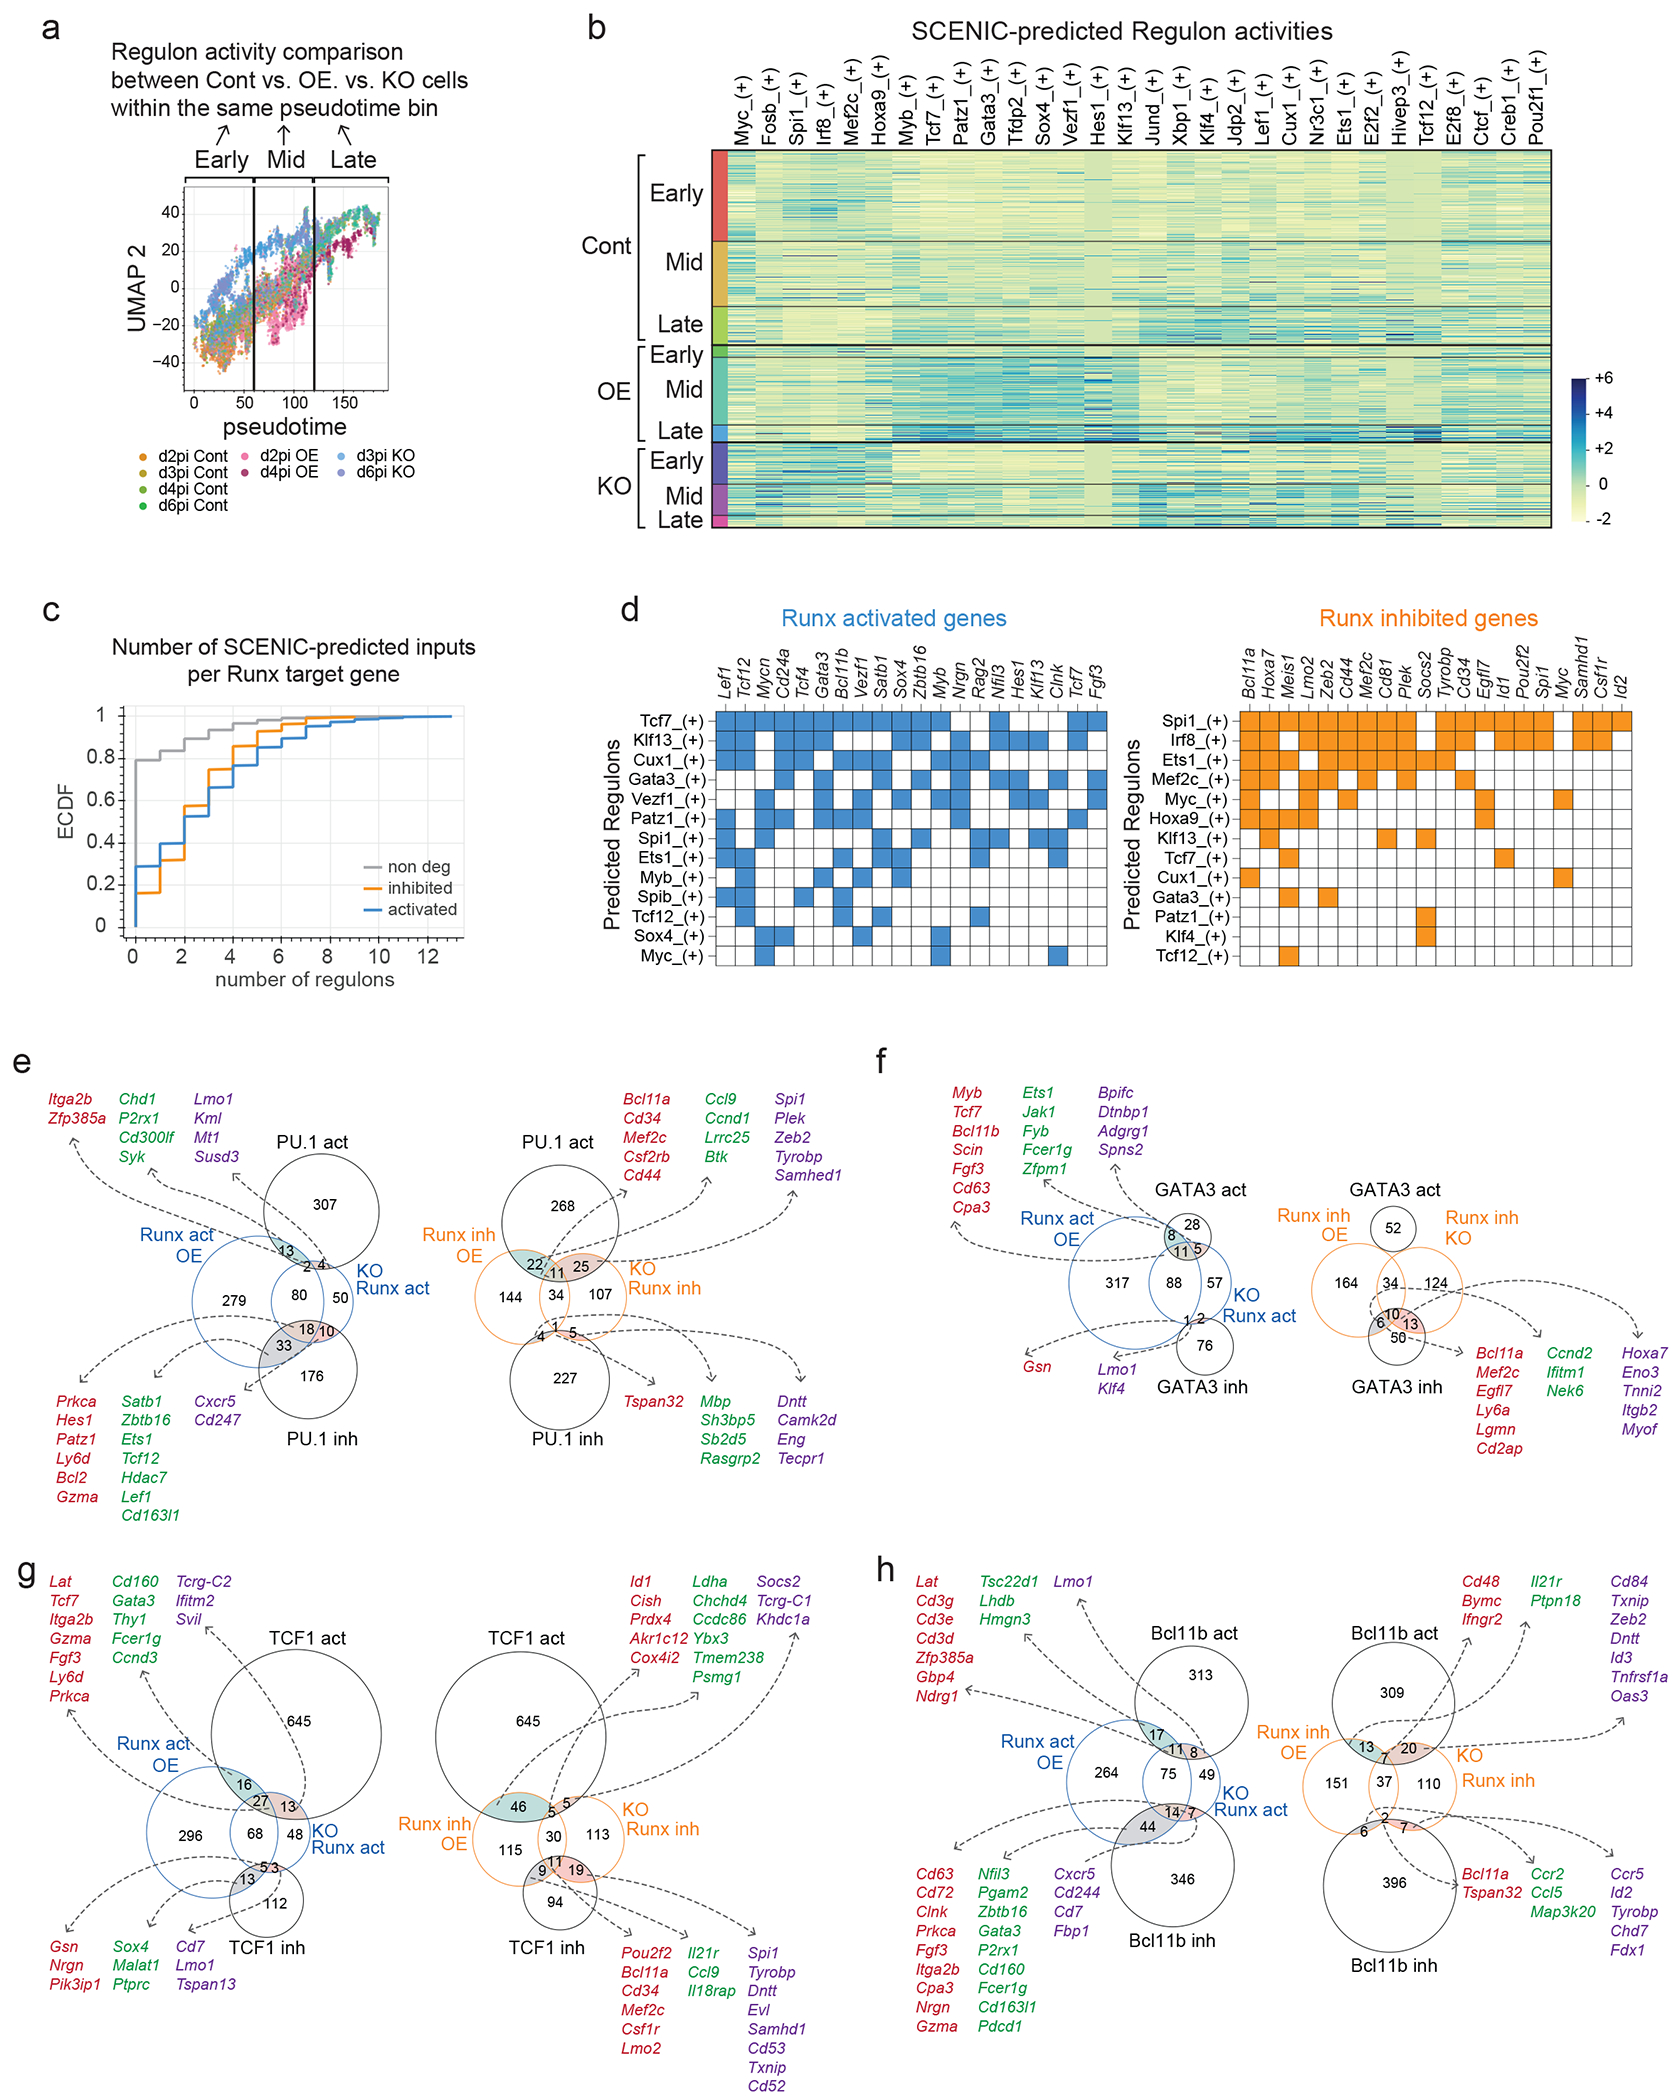
a, Gene regulatory network analysis strategy using pySCENIC is shown. Cells were grouped by Runx perturbation condition and pseudotime category to compute predicted target gene activity using SCENIC (pySCENIC, see Methods). b, SCENIC-predicted regulon activities for indicated TFs are represented as a heatmap. The expressed regulons scoring adj P < 1e-10 from more than two different pairwise comparisons using Kolmogorov–Smirnov tests were selected to display. c, The members of each regulon were overlapped with Runx DEGs defined by KO and/or OE from Figure 3e. Then the numbers of overlapping predicted input regulons were enumerated per functionally responding Runx target gene or per non-DEG, and the results displayed as cumulative density functions. KS test P values were calculated by comparing Runx-activated or Runx-repressed DEGs with non-DEGs. Activated genes’ P = 1.55e-15, inhibited genes’ P = 8.88e-16. d, Curated Runx DEGs regulon memberships predicting input relationships are displayed as matrices. Colored cells in matrix indicate that a given Runx DEG (rows) is a member of a given regulon (columns). Blue; Runx-activated genes, orange; Runx-inhibited genes. e-h, Area-proportional Venn diagrams display overlap patterns found between Runx DEGs with previously characterized functional targets of the indicated TFs. For Runx DEGs, genes activated (blue) or inhibited (orange) by Runx1 OE vs. Runx KO are each shown. Informative genes overlapping different classes of functionally responsive Runx DEGs are listed in different colored fonts: overlaps with Core-responsive DEGs showing reciprocal effects of Runx1 OE and KO (red); overlaps with DEGs defined by Runx1 OE-responses only (green); and overlaps with DEGs defined by Runx KO-responses only (blue) are listed. Comparisons between e, PU.1 target genes, f, GATA3 target genes, g, TCF1 target genes, and h, Bcl11b target genes are shown.
Supplementary Material
Acknowledgments
We thank Rothenberg lab members for helpful discussions, Rochelle Diamond and members of the Caltech Flow Cytometry and Cell Sorting facility for sorting, Igor Antoshechkin and Vijaya Kumar of the Caltech Jacobs Genomics Facility for sequencing, Henry Amrhein and Diane Trout for computer support, Jeff Park and Sisi Chen from the Caltech Single Cell Profiling and Engineering Center for support for processing 10X Chromium samples, Jost Vielmetter and the Caltech Protein Expression Center for purifying protein A-MNase, Ingrid Soto for mouse care, Maria Quiloan and Mei Chau for mouse genotyping and supervision, and Jeffrey Longmate (formerly City of Hope) and Mary Yui (formerly Caltech) for statistics advice.
Funding
Support for this project came from USPHS grants (R01AI135200, R01HL119102, and R01HD100039) to E.V.R., and by a Cancer Research Institute Irvington Postdoctoral Fellowship CRI.SHIN and Caltech Baxter Fellowship (to B.S.). F.G. was supported in part by NIH 1RF1NS122060-01. Support also came from The Beckman Institute at Caltech for all the Caltech facilities, and from the Biology and Biological Engineering Division Bowes Leadership Chair Fund, the Louis A. Garfinkle Memorial Laboratory Fund, and the Al Sherman Foundation to the Rothenberg lab. E.V.R. gratefully acknowledges support from the Edward B. Lewis Professorship and past support from the Albert Billings Ruddock Professorship.
Footnotes
Competing Interests Statement
WZ is employed by BillionToOne, Inc. and has been employed by 10X Genomics (CA 94588). FG is employed by Lyterian Therapeutics. EVR was a member of the Scientific Advisory Board for Century Therapeutics and has advised Kite Pharma and A2 Biotherapeutics. The other authors declare no competing interests.
CODE AVAILABILITY
All code used for data analysis in this work is publicly available and listed in the Methods and Reporting Summary.
DATA AVAILABILITY
All new genomic sequencing data have been deposited in Gene Expression Omnibus under accession numbers GSE218147 (C&R, ChIP-seq, and ATAC-seq) and GSE218149 (scRNA-seq). All other data needed to evaluate the conclusions in the paper are present in the paper, the Extended Data, or the Supplementary Materials, or are available upon request.
References
- 1.Shin B et al. Runx1 and Runx3 drive progenitor to T-lineage transcriptome conversion in mouse T cell commitment via dynamic genomic site switching. Proc Natl Acad Sci U S A 118, e2019655118 (2021). [DOI] [PMC free article] [PubMed] [Google Scholar]
- 2.Guo Y, Maillard I, Chakraborti S, Rothenberg EV & Speck NA Core binding factors are necessary for natural killer cell development and cooperate with Notch signaling during T-cell specification. Blood 112, 480–92 (2008). [DOI] [PMC free article] [PubMed] [Google Scholar]
- 3.Zhao L et al. CBFB-MYH11 hinders early T-cell development and induces massive cell death in the thymus. Blood 109, 3432–3440 (2007). [DOI] [PMC free article] [PubMed] [Google Scholar]
- 4.Taniuchi I et al. Differential requirements for Runx proteins in CD4 repression and epigenetic silencing during T lymphocyte development. Cell 111, 621–33 (2002). [DOI] [PubMed] [Google Scholar]
- 5.Egawa T, Tillman RE, Naoe Y, Taniuchi I & Littman DR The role of the Runx transcription factors in thymocyte differentiation and in homeostasis of naive T cells. J Exp Med 204, 1945–57 (2007). [DOI] [PMC free article] [PubMed] [Google Scholar]
- 6.Yzaguirre AD, de Bruijn MF & Speck NA The Role of Runx1 in Embryonic Blood Cell Formation. Adv Exp Med Biol 962, 47–64 (2017). [DOI] [PMC free article] [PubMed] [Google Scholar]
- 7.Growney JD et al. Loss of Runx1 perturbs adult hematopoiesis and is associated with a myeloproliferative phenotype. Blood 106, 494–504 (2005). [DOI] [PMC free article] [PubMed] [Google Scholar]
- 8.Ichikawa M et al. AML-1 is required for megakaryocytic maturation and lymphocytic differentiation, but not for maintenance of hematopoietic stem cells in adult hematopoiesis. Nat Med 10, 299–304 (2004). [DOI] [PubMed] [Google Scholar]
- 9.Talebian L et al. T-lymphoid, megakaryocyte, and granulocyte development are sensitive to decreases in CBFb dosage. Blood 109, 11–21 (2007). [DOI] [PMC free article] [PubMed] [Google Scholar]
- 10.Seo W, Ikawa T, Kawamoto H & Taniuchi I Runx1-Cbfb facilitates early B lymphocyte development by regulating expression of Ebf1. J Exp Med 209, 1255–62 (2012). [DOI] [PMC free article] [PubMed] [Google Scholar]
- 11.Niebuhr B et al. Runx1 is essential at two stages of early murine B-cell development. Blood 122, 413–23 (2013). [DOI] [PubMed] [Google Scholar]
- 12.Pham T-H et al. Mechanisms of in vivo binding site selection of the hematopoietic master transcription factor PU.1. Nucleic Acids Res 41, 6391–6402 (2013). [DOI] [PMC free article] [PubMed] [Google Scholar]
- 13.Ungerback J et al. Pioneering, chromatin remodeling, and epigenetic constraint in early T-cell gene regulation by SPI1 (PU.1). Genome Res 28, 1508–1519 (2018). [DOI] [PMC free article] [PubMed] [Google Scholar]
- 14.Pencovich N et al. Cell-autonomous function of Runx1 transcriptionally regulates mouse megakaryocytic maturation. PLoS One 8, e64248 (2013). [DOI] [PMC free article] [PubMed] [Google Scholar]
- 15.Zang C, Luyten A, Chen J, Liu XS & Shivdasani RA NF-E2, FLI1 and RUNX1 collaborate at areas of dynamic chromatin to activate transcription in mature mouse megakaryocytes. Sci Rep 6, 30255 (2016). [DOI] [PMC free article] [PubMed] [Google Scholar]
- 16.Miyazaki M et al. The opposing roles of the transcription factor E2A and its antagonist Id3 that orchestrate and enforce the naive fate of T cells. Nat Immunol 12, 992–1001 (2011). [DOI] [PMC free article] [PubMed] [Google Scholar]
- 17.Lin YC et al. A global network of transcription factors, involving E2A, EBF1 and Foxo1, that orchestrates B cell fate. Nat.Immunol 11, 635–643 (2010). [DOI] [PMC free article] [PubMed] [Google Scholar]
- 18.Zhong Y et al. Hierarchical regulation of the resting and activated T cell epigenome by major transcription factor families. Nat Immunol 23, 122–134 (2022). [DOI] [PMC free article] [PubMed] [Google Scholar]
- 19.Hosokawa H et al. Bcl11b sets pro-T cell fate by site-specific cofactor recruitment and by repressing Id2 and Zbtb16. Nat Immunol 19, 1427–1440 (2018). [DOI] [PMC free article] [PubMed] [Google Scholar]
- 20.Hosokawa H & Rothenberg EV How transcription factors drive choice of the T cell fate. Nat Rev Immunol 21, 162–176 (2021). [DOI] [PMC free article] [PubMed] [Google Scholar]
- 21.Hu G et al. Transformation of Accessible Chromatin and 3D Nucleome Underlies Lineage Commitment of Early T Cells. Immunity 48, 227–242 e8 (2018). [DOI] [PMC free article] [PubMed] [Google Scholar]
- 22.Yoshida H et al. The cis-Regulatory Atlas of the Mouse Immune System. Cell 176, 897–912 e20 (2019). [DOI] [PMC free article] [PubMed] [Google Scholar]
- 23.Zhang JA, Mortazavi A, Williams BA, Wold BJ & Rothenberg EV Dynamic transformations of genome-wide epigenetic marking and transcriptional control establish T cell identity. Cell 149, 467–82 (2012). [DOI] [PMC free article] [PubMed] [Google Scholar]
- 24.Bruno L et al. Selective deployment of transcription factor paralogs with submaximal strength facilitates gene regulation in the immune system. Nat Immunol 20, 1372–1380 (2019). [DOI] [PMC free article] [PubMed] [Google Scholar]
- 25.Kueh HY et al. Asynchronous combinatorial action of four regulatory factors activates Bcl11b for T cell commitment. Nat Immunol 17, 956–65 (2016). [DOI] [PMC free article] [PubMed] [Google Scholar]
- 26.Hamey FK et al. Reconstructing blood stem cell regulatory network models from single-cell molecular profiles. Proc Natl Acad Sci U S A 114, 5822–5829 (2017). [DOI] [PMC free article] [PubMed] [Google Scholar]
- 27.Kitagawa Y et al. Guidance of regulatory T cell development by Satb1-dependent super-enhancer establishment. Nat Immunol 18, 173–183 (2017). [DOI] [PMC free article] [PubMed] [Google Scholar]
- 28.Wilson NK et al. Combinatorial transcriptional control in blood stem/progenitor cells: genome-wide analysis of ten major transcriptional regulators. Cell Stem Cell 7, 532–44 (2010). [DOI] [PubMed] [Google Scholar]
- 29.Okuyama K et al. PAX5 is part of a functional transcription factor network targeted in lymphoid leukemia. PLoS Genet 15, e1008280 (2019). [DOI] [PMC free article] [PubMed] [Google Scholar]
- 30.Hosokawa H et al. Transcription Factor PU.1 Represses and Activates Gene Expression in Early T Cells by Redirecting Partner Transcription Factor Binding. Immunity 48, 1119–1134 e7 (2018). [DOI] [PMC free article] [PubMed] [Google Scholar]
- 31.Skene PJ, Henikoff JG & Henikoff S Targeted in situ genome-wide profiling with high efficiency for low cell numbers. Nat Protoc 13, 1006–1019 (2018). [DOI] [PubMed] [Google Scholar]
- 32.Lieberman-Aiden E et al. Comprehensive mapping of long-range interactions reveals folding principles of the human genome. Science 326, 289–93 (2009). [DOI] [PMC free article] [PubMed] [Google Scholar]
- 33.Ernst J & Kellis M Chromatin-state discovery and genome annotation with ChromHMM. Nat Protoc 12, 2478–2492 (2017). [DOI] [PMC free article] [PubMed] [Google Scholar]
- 34.Isoda T et al. Non-coding Transcription Instructs Chromatin Folding and Compartmentalization to Dictate Enhancer-Promoter Communication and T Cell Fate. Cell 171, 103–119 e18 (2017). [DOI] [PMC free article] [PubMed] [Google Scholar]
- 35.Bonifer C, Levantini E, Kouskoff V & Lacaud G Runx1 Structure and Function in Blood Cell Development. Adv Exp Med Biol 962, 65–81 (2017). [DOI] [PubMed] [Google Scholar]
- 36.Friedman AD Cell cycle and developmental control of hematopoiesis by Runx1. J Cell Physiol 219, 520–524 (2009). [DOI] [PMC free article] [PubMed] [Google Scholar]
- 37.Yu M et al. Direct recruitment of polycomb repressive complex 1 to chromatin by core binding transcription factors. Mol Cell 45, 330–43 (2012). [DOI] [PMC free article] [PubMed] [Google Scholar]
- 38.Schmitt TM & Zúñiga-Pflücker JC Induction of T cell development from hematopoietic progenitor cells by Delta-like-1 in vitro. Immunity 17, 749–56 (2002). [DOI] [PubMed] [Google Scholar]
- 39.Wong WF et al. Over-expression of Runx1 transcription factor impairs the development of thymocytes from the double-negative to double-positive stages. Immunology 130, 243–53 (2010). [DOI] [PMC free article] [PubMed] [Google Scholar]
- 40.Hosokawa H et al. Stage-specific action of Runx1 and GATA3 controls silencing of PU.1 expression in mouse pro-T cells. J Exp Med 218, e20202648 (2021). [DOI] [PMC free article] [PubMed] [Google Scholar]
- 41.Hosokawa H et al. Cell type-specific actions of Bcl11b in early T-lineage and group 2 innate lymphoid cells. J Exp Med 217, e20190972 (2020). [DOI] [PMC free article] [PubMed] [Google Scholar]
- 42.Miyazaki M et al. The E-Id Protein Axis Specifies Adaptive Lymphoid Cell Identity and Suppresses Thymic Innate Lymphoid Cell Development. Immunity 46, 818–834 e4 (2017). [DOI] [PMC free article] [PubMed] [Google Scholar]
- 43.Zhou W, Gao F, Romero-Wolf M, Jo S & Rothenberg EV Single-cell deletion analyses show control of pro-T cell developmental speed and pathways by Tcf7, Spi1, Gata3, Bcl11a, Erg, and Bcl11b. Sci Immunol 7, eabm1920 (2022). [DOI] [PMC free article] [PubMed] [Google Scholar]
- 44.Wiede F et al. PTPN2 regulates T cell lineage commitment and ab versus gd specification. J Exp Med 214, 2733–2758 (2017). [DOI] [PMC free article] [PubMed] [Google Scholar]
- 45.Yao Z et al. Stat5a/b are essential for normal lymphoid development and differentiation. Proc Natl Acad Sci U S A 103, 1000–5 (2006). [DOI] [PMC free article] [PubMed] [Google Scholar]
- 46.Seet CS et al. Generation of mature T cells from human hematopoietic stem and progenitor cells in artificial thymic organoids. Nat Methods 14, 521–530 (2017). [DOI] [PMC free article] [PubMed] [Google Scholar]
- 47.Montel-Hagen A et al. In Vitro Recapitulation of Murine Thymopoiesis from Single Hematopoietic Stem Cells. Cell Rep 33, 108320 (2020). [DOI] [PMC free article] [PubMed] [Google Scholar]
- 48.Van de Sande B et al. A scalable SCENIC workflow for single-cell gene regulatory network analysis. Nat Protoc 15, 2247–2276 (2020). [DOI] [PubMed] [Google Scholar]
- 49.Brewster RC et al. The transcription factor titration effect dictates level of gene expression. Cell 156, 1312–1323 (2014). [DOI] [PMC free article] [PubMed] [Google Scholar]
- 50.Lie-A-Ling M et al. Regulation of RUNX1 dosage is crucial for efficient blood formation from hemogenic endothelium. Development 145, dev149419 (2018). [DOI] [PMC free article] [PubMed] [Google Scholar]
- 51.Lacaud G, Kouskoff V, Trumble A, Schwantz S & Keller G Haploinsufficiency of Runx1 results in the acceleration of mesodermal development and hemangioblast specification upon in vitro differentiation of ES cells. Blood 103, 886–889 (2004). [DOI] [PubMed] [Google Scholar]
METHODS-ONLY REFERENCES
- 52.Ng KK et al. A stochastic epigenetic switch controls the dynamics of T-cell lineage commitment. Elife 7, e37851 (2018). [DOI] [PMC free article] [PubMed] [Google Scholar]
- 53.Dionne CJ et al. Subversion of T lineage commitment by PU.1 in a clonal cell line system. Dev Biol 280, 448–66 (2005). [DOI] [PubMed] [Google Scholar]
- 54.Telfer JC, Hedblom EE, Anderson MK, Laurent MN & Rothenberg EV Localization of the domains in Runx transcription factors required for the repression of CD4 in thymocytes. J Immunol 172, 4359–70 (2004). [DOI] [PubMed] [Google Scholar]
- 55.Meers MP, Bryson TD, Henikoff JG & Henikoff S Improved CUT&RUN chromatin profiling tools. Elife 8, e46314 (2019). [DOI] [PMC free article] [PubMed] [Google Scholar]
- 56.Skene PJ & Henikoff S An efficient targeted nuclease strategy for high-resolution mapping of DNA binding sites. Elife 6, e21856 (2017). [DOI] [PMC free article] [PubMed] [Google Scholar]
- 57.Levanon D et al. Transcription factor Runx3 regulates interleukin-15-dependent natural killer cell activation. Mol Cell Biol 34, 1158–69 (2014). [DOI] [PMC free article] [PubMed] [Google Scholar]
- 58.Buenrostro JD, Wu B, Chang HY & Greenleaf WJ ATAC-seq: A Method for Assaying Chromatin Accessibility Genome-Wide. Curr Protoc Mol Biol 109, 21.29.1–21.29.9 (2015). [DOI] [PMC free article] [PubMed] [Google Scholar]
- 59.Corces MR et al. An improved ATAC-seq protocol reduces background and enables interrogation of frozen tissues. Nat Methods 14, 959–962 (2017). [DOI] [PMC free article] [PubMed] [Google Scholar]
- 60.Buenrostro JD, Giresi PG, Zaba LC, Chang HY & Greenleaf WJ Transposition of native chromatin for fast and sensitive epigenomic profiling of open chromatin, DNA-binding proteins and nucleosome position. Nat Methods 10, 1213–8 (2013). [DOI] [PMC free article] [PubMed] [Google Scholar]
- 61.Liu N et al. Direct Promoter Repression by BCL11A Controls the Fetal to Adult Hemoglobin Switch. Cell 173, 430–442 e17 (2018). [DOI] [PMC free article] [PubMed] [Google Scholar]
- 62.Langmead B & Salzberg SL Fast gapped-read alignment with Bowtie 2. Nat Methods 9, 357–9 (2012). [DOI] [PMC free article] [PubMed] [Google Scholar]
- 63.Heinz S et al. Simple combinations of lineage-determining transcription factors prime cis-regulatory elements required for macrophage and B cell identities. Mol Cell 38, 576–89 (2010). [DOI] [PMC free article] [PubMed] [Google Scholar]
- 64.McLean CY et al. GREAT improves functional interpretation of cis-regulatory regions. Nat Biotechnol 28, 495–501 (2010). [DOI] [PMC free article] [PubMed] [Google Scholar]
- 65.Ramirez F et al. deepTools2: a next generation web server for deep-sequencing data analysis. Nucleic Acids Res 44, W160–5 (2016). [DOI] [PMC free article] [PubMed] [Google Scholar]
- 66.Ernst J & Kellis M ChromHMM: automating chromatin-state discovery and characterization. Nat Methods 9, 215–6 (2012). [DOI] [PMC free article] [PubMed] [Google Scholar]
- 67.Hao Y et al. Integrated analysis of multimodal single-cell data. Cell 184, 3573–3587 e29 (2021). [DOI] [PMC free article] [PubMed] [Google Scholar]
- 68.Qiu X et al. Reversed graph embedding resolves complex single-cell trajectories. Nat Methods 14, 979–982 (2017). [DOI] [PMC free article] [PubMed] [Google Scholar]
- 69.Trapnell C et al. The dynamics and regulators of cell fate decisions are revealed by pseudotemporal ordering of single cells. Nat Biotechnol 32, 381–386 (2014). [DOI] [PMC free article] [PubMed] [Google Scholar]
- 70.Aibar S et al. SCENIC: single-cell regulatory network inference and clustering. Nat Methods 14, 1083–1086 (2017). [DOI] [PMC free article] [PubMed] [Google Scholar]
- 71.Romero-Wolf M et al. Notch2 complements Notch1 to mediate inductive signaling that initiates early T cell development. J Cell Biol 219, e202005093 (2020). [DOI] [PMC free article] [PubMed] [Google Scholar]
Associated Data
This section collects any data citations, data availability statements, or supplementary materials included in this article.
Supplementary Materials
Data Availability Statement
All new genomic sequencing data have been deposited in Gene Expression Omnibus under accession numbers GSE218147 (C&R, ChIP-seq, and ATAC-seq) and GSE218149 (scRNA-seq). All other data needed to evaluate the conclusions in the paper are present in the paper, the Extended Data, or the Supplementary Materials, or are available upon request.