Abstract
Small molecule modulators are important tools to study both basic biology and the complex signaling of protein kinases. The cdc2-like kinases (CLK) are a family of four kinases that have garnered recent interest for their involvement in a diverse set of diseases such as neurodegeneration, autoimmunity, and many cancers. Targeted medicinal chemistry around a CLK inhibitor hit identified through screening of a kinase inhibitor set against a large panel of kinases allowed us to identify a potent and selective inhibitor of CLK1, 2, and 4. Here, we present the synthesis, selectivity, and preliminary biological characterization of this compound – SGC-CLK-1 (CAF-170). We further show CLK2 has the highest binding affinity, and high CLK2 expression correlates with a lower IC50 in a screen of multiple cancer cell lines. Finally, we show that SGC-CLK-1 not only reduces serine arginine-rich (SR) protein phosphorylation but also alters SR protein and CLK2 subcellular localization in a reversible way. Therefore, we anticipate that this compound will be a valuable tool for increasing our understanding of CLKs and their targets, SR proteins, at the level of phosphorylation and subcellular localization.
Keywords: CLK1, CLK2, CLK4, Chemical probe, Splicing
1. Introduction
Kinases are attractive targets for drug discovery, with well-documented success stories over the past two decades, and to date, over 65 kinase inhibitors have been approved for clinical use by the FDA (Roskoski, 2022; Attwood et al., 2021). The utility of kinase inhibitors stems from their intimate involvement in most physiological processes and pathways in healthy cells and tissues, and aberrant signaling through these same kinases, brought about by mutation or overexpression, for example, can lead to disease. One such important biological process regulated by the activity of kinases is pre-mRNA splicing, the process by which pre-mRNAs are processed into mature mRNAs that will be translated into proteins. The splicing process allows for the generation of alternately spliced mRNA variants, leading to the production of different protein products from the same gene (Gallego-Paez et al., 2017; Lee et al., 2015).
Recently, modulators of splicing, including intervention through so-called splicing kinases, have garnered attention for their therapeutic potential (Bates et al., 2017; Le et al., 2015; Martin Moyano et al., 2020). Splicing modulators have been suggested as potential therapeutics for human diseases including autoimmune diseases like lupus and rheumatoid arthritis (Ren et al., 2021), muscle diseases such as Duchenne muscular dystrophy (McClorey et al., 2005; Pistoni et al., 2010), neurodegenerative diseases like Alzheimer’s disease and Parkinson’s disease (Li et al., 2021), and various types of cancers (Bonnal et al., 2020; Di et al., 2019; Lindberg et al., 2021; Schneider-Poetsch et al., 2021; Melnyk et al., 2020; Bowler et al., 2018; Braun et al., 2017; Tiek et al., 2019, 2022). Alternate splicing influences numerous cellular processes that are considered to be hallmarks of cancer (Oltean et al., 2014; Hanahan et al., 2000, 2011), and the body of evidence for the role of the splicing process in tumorigenesis has led to the suggestion of including aberrant alternative splicing as an additional hallmark of cancer (Ladomery, 2013).
The cdc2-like kinases – CLK1, CLK2, CLK3, and CLK4 – constitute a small family of kinases that are part of the CMGC group (CDK, MAPK, GSK3, and CLK) of the human kinome, and they play key roles in the splicing process. CLKs can phosphorylate (p) serine-arginine rich (SR) proteins, and this phosphorylation re-localizes the pSR proteins from their holding area in the nuclear speckles to the spliceosome to dictate exon inclusion/exclusion in the nascent transcript (Prasad et al., 2003; Ngo et al., 2005; Mueller et al., 2012). As expected, the four CLK family members are highly homologous, but there are differences in sequence that give rise to functional differences and lead to different compound inhibition profiles across the four CLKs (Martin Moyano et al., 2020; Lindberg et al., 2021; Bullock et al., 2009; Qin et al., 2021).
As targeting splicing through splicing modulators has become an active and attractive area of research, a growing number of small molecule inhibitors have been created to better understand the CLKs in physiological roles such as splicing, and to investigate the consequences of CLK inhibition in disease-relevant models. CLK inhibitors and the therapeutic potential of CLK inhibition have been reviewed recently (Martin Moyano et al., 2020; Lindberg et al., 2021; Qin et al., 2021). Several CLK inhibitors have been sufficiently characterized so that they can be considered chemical probes for the CLKs. Table 1 depicts the recent CLK inhibitors that can be used to probe CLK biology, along with examples of CLK inhibitors that have advanced into clinical trials.
Table 1.
Literature CLK chemical probes and compounds in clinical trialsa.
| Compound | Name | Structure | CLK Activities (IC50 nM) |
Current Status |
|---|---|---|---|---|
| 1 | MU1210 |

|
CLK1 = 8 CLK2 = 20 CLK3 = 12 |
CLK Probe (Nemec et al., 2019) |
| 2 | T3-CLK |
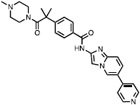
|
CLK1 = 0.67 CLK2 = 15 CLK3 = 110 |
CLK Probe (Funnell et al., 2017) |
| 3 | Compound 25 |
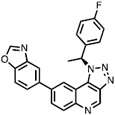
|
CLK1 = 2.0 | CLK Probe (Sun et al., 2017) |
| 4 | SM08502 |

|
CLK2 = 2 CLK3 = 22 |
CLK Probe Phase I Clinical Trial for solid tumor (Tam et al., 2020; Bossard et al., 2020) |
| 5 | SM04690 Loricivivint |
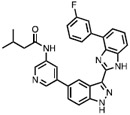
|
CLK2 = 7.8 | CLK Probe Phase II Clinical trial for osteoarthritis (Hood et al., 2017; Kc Sunil, 2017) |
| 6 | SM04755 |

|
CLK2 = 0.82 | CLK Probe Phase I clinical trial for plaque psoriasis [ (Qin et al., 2021), terminated] |
| 7 | CTX-712 |

|
CLK2 = 1.4 | Phase I Clinical trial relapsed and refractory malignancies (Ogawa et al., 2019) |
For further information see the recent review on CLK inhibitors (Martin Moyano et al., 2020) and the SGC chemical portal [SGC-CLK1 (https://www.thesgc.org/chemical-probes/SGC-CLK-1); MU1210 (https://www.thesgc.org/chemical-probes/MU1210); T3-CLK (https://www.thesgc.org/chemical-probes/T3-CLK)].
From the recent CLK reviews and the primary CLK medicinal chemistry publications it becomes apparent that CLK inhibitor scaffolds have varied potency across the CLK family and carry different off-target kinase activities. There are also examples of kinase inhibitors initially developed for other enzymes that can act as CLK inhibitors (Kim et al., 2014; Lee et al., 2019; Riggs et al., 2017; Shi et al., 2017). As the CLKs share very similar ATP binding pockets, creating a potent and selective tool molecule for each CLK has proven difficult to date. Nevertheless, there are several ongoing clinical trials currently underway with CLK inhibitors ranging from osteoporosis to neurodegenerative disorders and cancer (Supplemental Table S1). Alternate scaffolds with different pharmacological profiles, intrafamily potency profiles, and kinase off-target profiles should prove useful in the quest to find useful CLK inhibitors that can modulate disease phenotypes and serve as precursors for new therapeutics.
Here, we report a new potent and cell active CLK chemical probe, SGC-CLK-1 (CAF-170), and a negative control compound SGC-CLK-1N (CAF-225). SGC-CLK-1 has excellent kinome wide selectivity, is a potent inhibitor of CLK1, CLK2, and CLK4, and produces a unique phenotype outside of the normal presumed CLK inhibitor function of simply decreasing SR phosphorylation. At low nanomolar concentrations, we observe that SGC-CLK-1 re-distributes CLK2 and pSRs leading to a decrease in growth of both melanoma and glioblastoma cells. Finally, this relocalization is reversible, which positions SGC-CLK-1 as a useful mechanistic tool for CLK2 function and a scaffold for further optimization.
2. Materials and methods
2.1. Cell lines and culturing conditions
MDA-MB-435 (ATCC) and U118-MG (ATCC) were cultured in DMEM (Thermo Fisher Scientific, 11995-065) and supplemented with 10% FBS (Thermo Fisher Scientific, 10437028). All cells were authenticated by short tandem repeat analysis at IDEXX BioAnalytics and were cultured for less than 10 passages prior to use.
2.2. Western blotting
Cells were lysed in RIPA buffer supplemented with protease and phosphatase inhibitors (Roche (Sigma), 4906837001) for protein extractions and separated by polyacrylamide gel electrophoresis using 4–12% gradient gels (Novex by Life Tech, NP0321BOX). They were then transferred onto Nitrocellulose membranes (Invitrogen, IB23001) with the iBlot2 (Invitrogen, IB21001) and probed with the following antibodies post 1 h blocking in 5% milk: anti-phosphorylated (p)SR proteins (clone 1H4, 1:500, MABE50; MilliporeSigma), and anti–α/β-tubulin (1:1000, Cell Signaling Technology, 2148) antibodies. Following washing with TBS-T, the blot was incubated with corresponding HRP-conjugated secondary antibodies (DAKO, anti-rabbit immunoglobulins, P0217; anti-mouse immunoglobulins, P0260). Blots were developed with enhanced chemiluminescence.
2.3. Cell proliferation assays
Cells were seeded in 96-well plastic tissue culture plates at 1000 cells/well 1 d prior to treatment with the indicated concentrations of SGC-CLK-1 or the negative control compound SGC-CLK-1N. Cells were treated for a total of 8 days, with medium changed and drug replenished on day 4. Staining with crystal violet, re-solubilization, and analysis of staining intensity as a proxy for cell number was performed as previously described (Feoktistova et al., 2016). For CellTiter-Glo assays, dissociated cells were seeded in 96-well plates at density of 1000 or 2000 cells per well, 3 to 4 replicates per group. Cell viability was measured using CellTiter-Glo Luminescent Cell Viability Assay Kit (Promega) at according to the manufacturer’s instructions. Luminescence was measured using SpectraMax M3 Multi-Mode Microplate Reader (Molecular Devices) and normalized to their levels at day zero.
2.4. Immunofluorescence
Cells were seeded at a density of 45,000–55,000 cells onto 18-mm-diameter #1.0 round coverslips (VWR, Radnor, PA, USA) in 12-well dishes. On the following day, the cells were treated with indicated concentrations of inhibitor (500 nM SGC-CLK-1N, 100 nM, 500 nM SGC-CLK-1, 500 nM MU140, 500 nM MU1210, 500 nM T3) for either 15′, 30′, 45′, or 60’ as indicated in the figure legends in conditioned media from cells seeded to the same density. Media was removed, and coverslips were washed 3X with PBS and then fixed and permeabilized in 3.2% paraformaldehyde with 0.2% Triton X-100 in PBS for 5 min at room temperature. Three washes were performed with PBS in the 12-well plate, and then coverslips were inverted onto 120 μl of primary antibody in the antibody block (0.1% gelatin with 10% normal donkey serum in PBS) on strips of parafilm and incubated for 1 h. Coverslips were first incubated with anti-pSR (1:150) and anti-CLK2 (1:500, Sigma Aldrich, HPA055366-100UL) antibodies for 1 h. After incubation with primary antibodies, coverslips were washed 3 times with PBS. Then, coverslips were inverted onto 100 μl of antibody block with secondary antibodies (Alexa Fluor 488 anti-mouse, 1:200, A11029; Thermo Fisher Scientific) and DAPI (DNA, 1:500 dilution) for 20 min in the dark. Coverslips were again washed 3 times with PBS and then gently dipped 4 times into molecular biology-grade water before inversion onto 1 drop of Fluoro-Gel (with N-[tris(hydroxymethyl)methyl]-2-aminoethanesulfonic acid buffer, 17985–30; Electron Microscopy Sciences, Hatfield, PA, USA) and allowed to air-dry in the dark for at least 10 min. Slides were stored at 4 °C until image collection on an Olympus BX-53 microscope with a series 120 Q X-cite Lumen Dynamics laser.
2.5. General chemistry and compound synthesis information
Reagents were obtained from reputable commercial vendors. Solvent was removed via rotary evaporator under reduced pressure. Thin layer chromatography was used to track reaction progress. These abbreviations are used in experimental procedures: mmol (millimoles), μmol (micromoles), mg (milligrams), mL (milliliters) and r.t. (room temperature). 1H NMR and/or additional microanalytical data was collected to confirm identity and assess purity of final compounds. Magnet strength for NMR spectra is included in line listings. Peak positions are listed in parts per million (ppm) and calibrated versus the shift of CD3OD-d4; coupling constants (J values) are reported in hertz (Hz); and multiplicities are as follows: singlet (s), doublet (d), doublet of doublets/triplets (dd/dt), doublet of doublets of triplets (ddt), triplet (t), and multiplet (m). Compounds were confirmed to be >95% pure by 1H NMR and HPLC analysis.
2.6. Probe and negative control synthesis
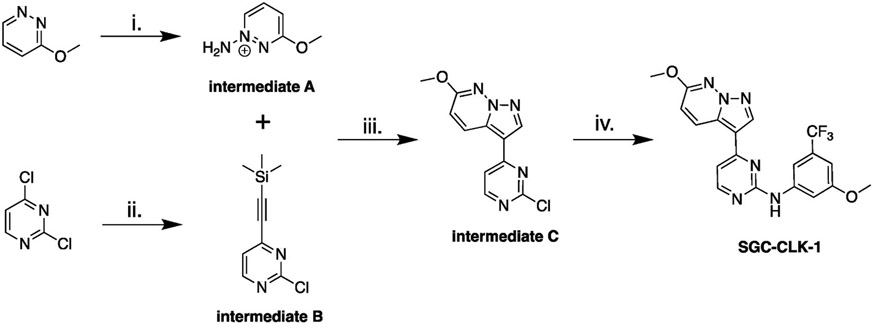
The synthetic route to make the chemical probe SGC-CLK-1 is depicted in Scheme 1.
Scheme 1.
Chemistry route for probe synthesis. Reagent and conditions: i) hydroxylamine-O-sulfonic acid (HOSA), KHCO3, H2O, 80 °C, 14 h; ii) ethynyltrimethyl silane, Pd(dppf)Cl2 · CH2Cl2, CuI, PPh3, TEA, THF, 70 °C, 15 min; iii) KHCO3, KOH, H2O, DCM, r.t, 18 h; iv) 3-methoxy-5-(trifluoromethyl)aniline, TFA, tert-BuOH, 85 °C, 15 h.
2.6.1. Synthesis of intermediate A: 1-amino-3-methoxypyridazin-1-ium
Hydroxylamine-O-sulfonic acid (HOSA) (0.83 g, 7.39 mmol, 3.7 eq.) was dissolved in water (1.6 mL), and then treated with KHCO3 (0.74 g, 7.39 mmol, 3.7 eq.) in water (1.0 mL), pH 5. Then 3-methoxypyridazine (0.22 g, 2.00 mmol, 1.00 eq.) was added in portions. The reaction was then stirred at 80 °C overnight. This solution of the crude material was used for the next reaction without purification.
2.6.2. Synthesis of intermediate B: 2-chloro-4-((trimethylsilyl)ethynyl) pyrimidine
2,4-dichloropyrimidine (1.00 g, 6.7 mmol, 1 eq.) in tetrahydrofuran (30 mL) was degassed with nitrogen for 10–12 min, then ethynyltrimethylsilane (0.73 g, 7.4 mmol, 1.1 eq.) and triethylamine (0.74 g, 7.5 mmol, 1.1 eq.) were added, and the reaction degassed for another 5 min. At this time PdCl2(dppf)-CH2Cl2adduct (0.27 g, 0.34 mmol, 0.05 eq.), copper(I) iodide (0.13 g, 0.67 mmol, 0.10 eq.), and triphenylphosphine (0.18 g, 0.67 mmol, 0.10 eq.) were added. The reaction was then refluxed for 15 min and copious solids formed. By TLC, all starting material was consumed (Hexanes:EtOAc, 85:15). Hexanes was added to precipitate triphenylphosphine oxide, and the reaction was filtered and rinsed with EtOAc. The crude material was concentrated in the rotavap, to provide a thick brown liquid. The desired product was obtained by flash chromatography using EtOAc in hexanes (0%–20%). The desired fractions were concentrated in the rotary evaporator, dried under vacuum overnight, to provide the desired product as a brown solid 770 mg (yield 50%), purity>90% by NMR.
1H NMR (400 MHz, DMSO-d6) δ ppm 0.27 (s, 9 H), 7.66 (d, J = 5.1 Hz, 1 H), 8.80 (d, J = 5.1 Hz, 1 H). 13C NMR (101 MHz, DMSO-d6) δ ppm 100.4, 102.1, 122.6, 151.4, 160.1, 161.2.
2.6.3. Synthesis of intermediate C: 3-(2-chloropyrimidin-4-yl)-6-methoxypyrazolo[1,5-b]pyridazine
The aqueous solution of 1-amino-3-methoxypyridazin-1-ium (0.20 g, 1.6 mmol, 1.5 eq.) from the previous step (pH = 1) was treated with saturated KHCO3 to bring the pH to 7. 2-chloro-4-((trimethylsilyl)ethynyl)pyrimidine (0.22 g, 1.04 mmol, 1.00 eq.) was dissolved in 1 mL of DCM (1 M), and added in one portion to the crude aminated pyridazine. KOH (0. 320 g, 6.26 mmol, 6 eq.) was dissolved in H2O (5 mL) 1.0 M and was added in one portion to the reaction mixture. The reaction mixture turned dark red in color after 5–10 min. The reaction mixture was stirred vigorously at r.t. for 22 h. The crude mixture was then quenched with water, extracted with DCM, and the combined organic layers were dried over anhydrous Na2SO4. Filtration and rotary evaporation of the solvent provide the crude product which was dry loaded on a 10 g Biotage Sfar 60 μm silica cartridge (Hexanes/EtOAc 70:30) and chromatographed to provide a light pink solid (0.095 g, 35% yield). LCMS [M+1] = 262, purity >95%.
1H NMR (400 MHz, DMSO-d6) δ ppm 4.02 (s, 3 H), 7.27 (d, J = 9.4 Hz, 1 H), 8.01 (d, J = 5.5 Hz, 1 H), 8.66–8.78 (m, 2 H), 8.83 (s, 1 H).
2.6.4. Synthesis of SGC-CLK-1 (SGC-CLK-1): N-(3-methoxy-5-(trifluoromethyl)phenyl)-4-(6-methoxypyrazolo[1,5-b]pyridazin-3-yl) pyrimidin-2-amine
3-(2-chloropyrimidin-4-yl)-6-methoxypyrazolo[1,5-b]pyridazine (0.085 g, 0.32 mmol, 1 eq.), 3-methoxy-5-(trifluoromethyl)aniline (0.075 g, 0.39 mmol, 1.20 eq.), and tert-butanol (4.5 mL) were combined in a microwave vial, 4 small drops of TFA added, the vial was sealed, and the reaction stirred at 85 °C for 15 h. The reaction mixture was allowed to come to r.t. and quenched with water. Using aqueous NaHCO3, the pH was adjusted to 7 and a solid precipitated. More water was added, the solid was obtained by filtration, thoroughly rinsed with water, and air dried. A pale pink solid was obtained, 110 mg recovered. The product was purified using Biotage Sfar 10g silica cartridge, solid load and a Hexanes/EtOAc gradient from 0% to 50% EtOAc to provide the desired product as a pale off-white solid (0.057 g, >95% pure). LCMS [M+1] = 417, 418.
1H NMR (850 MHz, DMSO-d6) δ 9.90 (s, 1H), 9.02 (d, J = 9.6 Hz, 1H), 8.72 (s, 1H), 8.54 (d, J = 5.2 Hz, 1H), 7.84 (d, J = 1.8 Hz, 1H), 7.68 (t, J = 2.2 Hz, 1H), 7.43 (d, J = 5.2 Hz, 1H), 7.15 (d, J = 9.5 Hz, 1H), 6.85 (t, J = 2.0 Hz, 1H), 4.03 (s, 3H), 3.84 (s, 3H).
13C NMR (214 MHz, DMSO-d6) δ 163.22, 162.93, 162.78, 162.58, 161.21, 145.80, 141.40, 133.84, 133.54, 133.39, 132.60, 127.97, 126.70, 116.29, 113.54, 111.55, 111.00, 110.54, 106.06, 58.69, 57.91.
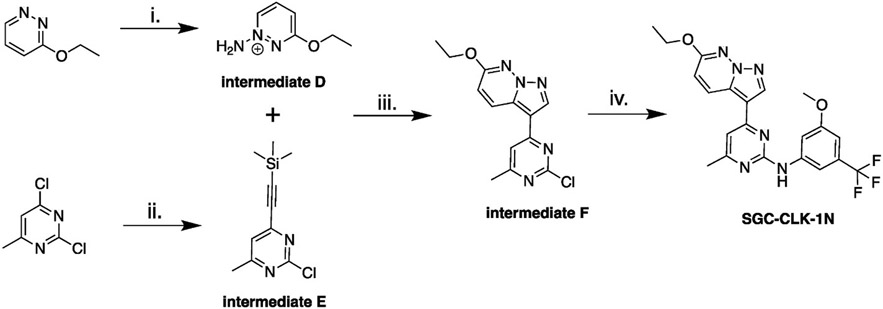
The synthetic route to make the negative control compound SGC-CLK-1N is depicted in Scheme 2.
Scheme 2.
Synthesis of negative control compound SGC-CLK-1N. Reagents and conditions: i) hydroxylamine-O-sulfonic acid (HOSA), KHCO3, H2O, 80 °C, 14 h; ii) ethynyltrimethylsilane, Pd(dppf)Cl2 · CH2Cl2, CuI, PPh3, TEA, THF, 70 °C, 15 min; iii) KHCO3, KOH, H2O, DCM, r.t, 18 h; iv) 3-methoxy-5-(trifluoromethyl)aniline, TFA, tert-BuOH, 85 °C, 15 h.
2.6.5. Synthesis of intermediate D. 1-amino-3-ethoxypyridazin-1-ium
Hydroxylamine-O-sulfonic acid (HOSA), (0.82 g, 7.25 mmol, 4.5 eq.) was dissolved in water (1.6 mL), then treated with KHCO3 (0.72 g, 7.25 mmol, 4.5 eq.) in water (1.0 mL), pH 5. 3-ethoxypyridazine (0.20 g, 1.61 mmol, 1.00 eq.) was added to the HOSA solution portionwise. The reaction was then stirred at 80 °C overnight. The resulting crude solution was used in the next reaction without purification.
2.6.6. Synthesis of intermediate E. 2-chloro-4-methyl-6-((trimethylsilyl) ethynyl) pyrimidine
A solution of 2,4-dichloro-6-methylpyrimidine (1.0 g, 6.10 mmol, 1.00 eq.) dissolved in THF (30 mL) was degassed with nitrogen for 10–12 min, then ethynyltrimethylsilane (0.66 g, 6.7 mmol, 1.1 eq.) and triethylamine (0.68 g, 6.7 mmol, 1.10 eq., 0.94 mL) were added and the reaction mixture was degassed for another 5 min, and then PdCl2(dppf)-CH2Cl2adduct (0.25 g, 0.31 mmol, 0.05 eq.), copper(I) iodide (0.12 g, 0.61 mmol, 0.10 eq.), and triphenylphosphine (0.16 g, 0.61 mmol, 0.10 eq.) were added. The reaction mixture was refluxed for 15 min and a precipitate formed. The crude reaction mixture was filtered over celite, and then the celite plug rinsed with EtOAc. The EtOAc washes were concentrated by rotary evaporation to provide a thick brown oil. The crude product was purified using flash chromatography (0–15% EtOAc) to provide 1.03 g of the desired product (yield 67%), purity around 90%.
1H NMR (400 MHz, DMSO-d6) δ ppm 0.27 (bs, 9 H), 2.46 (s, 3 H), 7.61 (s, 1 H).
2.6.7. Synthesis of intermediate F. 3-(2-chloro-6-methylpyrimidin-4-yl)-6-ethoxypyrazolo [1,5-b]pyndazine
The crude solution of 1-amino-3-ethoxypyridazin-1-ium (0.22 g, 1.6 mmol, 2.0 eq.) from the previous step (pH = 1) was treated with saturated KHCO3 to bring the pH to 7. 2-chloro-4-methyl-6-((trimethylsilyl) ethynyl)pyrimidine (0.18 g, 0.88 mmol, 1.00 eq.) was dissolved in 0.8 mL of DCM (1 M), and added in one portion to the crude aminated pyridazine. KOH (0. 27 g, 4.8 mmol, 6 eq.) dissolved in H2O (4.8 mL) 0.9–1.0 M was then added in one portion to the reaction mixture. The reaction mixture turned dark red in color after 5–10 min. The reaction mixture was stirred vigorously at r.t. for 22 h. The crude mixture was then quenched with water, extracted with DCM, and the combined organic layers were dried over anhydrous Na2SO4. Filtration and evaporation of the solvent proved the crude product which was dry loaded on a 10 g Biotage Sfar 60 μm silica cartridge. Chromatography using Hexanes/EtOAc 7(0:30) provided the desired product as an off-white solid (0.116 g, 48% yield). LCMS [M+1] = 290, purity >95%.
1H NMR (400 MHz, DMSO-d6) δ ppm 1.41 (t, J = 7.0 Hz, 3 H), 2.49 (br s, 3 H), 4.41 (q, J = 7.0 Hz, 2 H), 7.23 (d, J = 9.4 Hz, 1 H), 7.92 (s, 1 H), 8.69–8.77 (m, 2 H).
2.6.8. Synthesis of negative control SGC-CKL-1N. 4-(6-ethoxypyrazolo [1,5-b]pyridazin-3-yl)-N-(3-methoxy-5-(trifluoromethyl)phenyl)-6-methylpyrimidin-2-amine
3-(2-chloro-6-methylpyrimidin-4-yl)-6-ethoxypyrazolo[1,5-b]pyridazine (0.065 g, 0.22 mmol, 1 eq.), 3-methoxy-5-(trifluoromethyl) aniline (0.051 g, 0.27 mmol, 1.20 eq.), and tert-butanol (4.5 mL) were mixed into a microwave vial, 4 small drops of TFA added, the vial was sealed, and the reaction stirred at 85 °C for 15 h. The reaction mixture was allowed to cool to r.t., and quenched with water. The pH was adjusted to 7 with aqueous NaHCO3, and a solid precipitated. More water was added, and the resulting solid was filtered, thoroughly rinsed with water, and air dried to provide a pale pink solid (110 mg recovered). The product was purified using Biotage Sfar 10 g silica cartridge, solid load, eluting with Hexanes/EtOAc gradient from 0% to 50% EtOAc to provide the desired product as an off-white solid (0.065 g, yield 30%, >95% pure). LCMS [M+1] = 445, 446.
1H NMR (850 MHz, DMSO-d6) δ 9.85 (s, 1H), 8.98 (d, J = 9.3 Hz, 1H), 8.65 (s, 1H), 7.84 (d, J = 1.8 Hz, 1H), 7.75 (s, 1H), 7.35 (s, 1H), 7.09 (d, J = 9.5 Hz, 1H), 6.83 (t, J = 2.0 Hz, 1H), 4.42 (q, J = 7.0 Hz, 2H), 3.84 (s, 3H), 2.44 (s, 3H), 1.43 (t, J = 7.0 Hz, 3H).
13C NMR (214 MHz, DMSO-d6) δ 170.71, 163.20, 162.67, 162.40, 162.26, 145.99, 141.02, 133.78, 133.48, 133.33, 132.48, 127.99, 126.71, 116.20, 113.69, 110.82, 110.65, 110.48, 105.90, 66.43, 58.62, 27.01, 17.24.
2.7. Kinome-wide selectivity analysis and confirmation of binding
The scanMAX assay platform offered by the Eurofins DiscoverX Corporation was used to assess the selectivity of the chemical probe when screened at 1 μM. This platform measures the binding of a compound to 403 wildtype (WT) human as well as several mutant and nonhuman kinases, generating percent of control (PoC) values for every kinase evaluated (Davis et al., 2011). A selectivity score (S10(1 μM)) is calculated using the PoC values for WT human kinases only. The KinomeScan data is available in the supplemental information in an Excel file called “KinomeScan data for the CLK probe and negative control”.
2.8. NanoBRET assays
The CLK family of nanoBRET assays were run as directed by Promega. Briefly, to 10.5 mL of 2.0 × 10^5 of Hek293 Cells (ATCC CRL1573) in growth media (DMEM + 10% FBS) was added 525 μL of a 9:1 ratio of carrier DNA (Promega E4881) to a CLK nLuc construct-CLK1 CLK2 or CLK4 (Promega – NV1131, NV1141, NV1151) in OPTImem (Gibco) + 15.75μL of Fugene (Promega). To each well of a 96 well plate (Corning 3717) was then added 100 μL of cells. The cells were then transfected overnight (20 h) at 37 °C. After overnight the media was aspirated and replaced with 85 μL of OPTImem. To each well was then added 5 μL of tracer K5 (Promega) at a final concentration of 0.5 μM per well. Then 10 μL of CLK inhibitor was added with concentrations varying from 1 nM to 1 μM. The plates were then returned to 37 °C for 2 h. After 2 h the plates were equilibrated to room temperature for 15 min. After 15 min, 50 μL of 3x complete substrate plus inhibitor solution (Promega) was added to each well and read after 2 min on a GloMax instrument. Test compounds were evaluated at eleven concentrations in competition with NanoBRET Tracer K5 in HEK293 cells transiently expressing the CLK(1,2, or 4) fusion protein. Raw milliBRET (mBRET) values were obtained by dividing the acceptor emission values (600 nm) by the donor emission values (450 nm) then multiplying by 1000. Averaged control values were used to represent complete inhibition (no tracer control: Opti-MEM + DMSO only) and no inhibition (tracer only control: no compound, Opti-MEM + DMSO + Tracer K5 only) and were plotted alongside the raw mBRET values. The data with n = 3 biological replicates was first normalized and then fit using Sigmoidal, 4 PL binding curve in Prism Software (version 8, GraphPad, La Jolla, CA, USA). All error bars are based on n = 3 and are ± standard error (SE).
2.9. CLK KinaseSeeker assays
The Luceome KinaseSeeker™ assay (Jester et al., 2010, 2012) was used to measure binding to CLK1, CLK2, and CLK3. Stock solutions (10 mM in DMSO) of test compounds were serially diluted in DMSO to make assay stocks. Prior to initiating screening or IC50 determination, the test compounds were evaluated for false positive results against split luciferase. The test compound was screened against CLK1, CLK2, and CLK3 at a minimum of eight different concentrations in duplicate. For kinase assays, a 24 mL aliquot of lysate containing Cfluc-kinase and Fos-Nfluc was incubated with either 1 μL of DMSO (for no-inhibitor control) or compound solution in DMSO for 2 h in the presence of a kinase-specific probe. Luciferin assay reagent (80 μL) was added to each solution, and luminescence was immediately measured on a luminometer. The % inhibition was calculated using the following equation: % inhibition = [ALU (control) – ALU (sample)]/ALU (control) × 100. For IC50 determinations, each compound was tested at a minimum of eight different concentrations. The % inhibition was plotted against compound concentration, and the IC50 value was determined for each compound using an eight-point curve.
3. Results
3.1. Discovery and characterization of a CLK chemical probe
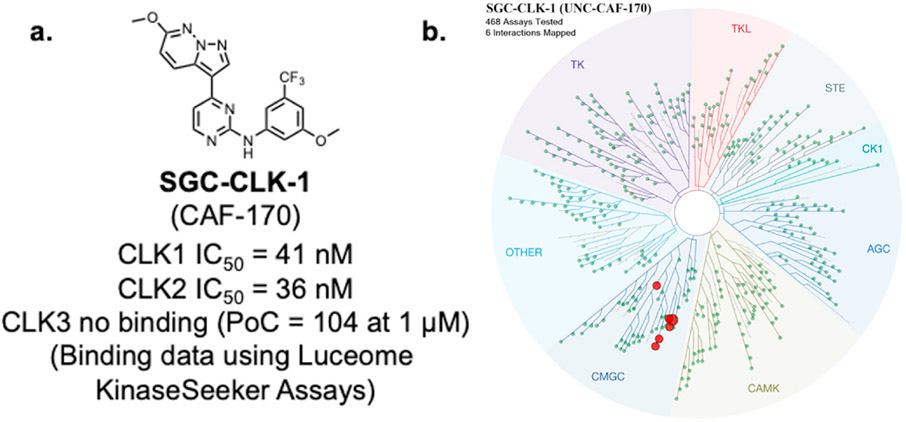
In our original kinase chemogenomic set known as PKIS (Published Kinase Inhibitor Set), we identified GW807982X (CAF-022) as a potent inhibitor of members of the CLK family with good kinome wide selectivity based on screening against a panel of over 200 kinases at NanoSyn. CAF-022 has subsequently been shown to selectively inhibit chemo-resistant glioblastoma cells (Tiek et al., 2022). To further understand the selectivity of this compound we screened it at a concentration of 1 μM in the Eurofins KINOMEscan® panel. In this assay format, GW807982X exhibited very good selectivity, with an S10 (1 μM) = 0.02, indicating that only 2% of the kinases tested had a PoC <10 at a screening concentration of 1 μM. In this assay, lower PoC values arise from potent binding to the kinases in question. The kinome wide data is available as Supplemental Table 1. In efforts to further enhance selectivity, we made a series of analogs. We utilized the Luceome KinaseSeeker™ assays to assess the affinity towards CLK1, CLK2, and CLK3. Close analogue SGC-CLK-1 (Fig. 1a) bound effectively to CLK1 with IC50 = 46 nM and CLK2 with IC50 = 36 nM, but when screened at a concentration of 1 μM against CLK3 showed no binding at all. SGC-CLK-1 demonstrated improved kinome-wide selectivity, with S10 (1 μM) = 0.002 in the KINOMEscan® assay format (Fig. 1b and Supplemental Table 1). SGC-CLK-1 bound to only six kinases in the KINOMEscan® panel with a PoC<35: CLK1, CLK2, CLK4, HIPK1, HIPK2, and MAPK15 (also known as ERK8). Given this excellent selectivity we chose to characterize SGC-CLK-1 more fully in a series of orthogonal assays to assess its potential to serve as a cell active chemical probe for CLK1, CLK2, and CLK4.
Fig. 1.
CLK probe SGC-CLK-1 and kinase selectivity: a. SGC-CLK-1 structure and binding activity values from KinaseSeeker assays (Luceome) b. SGC-CLK-1 KINOMEscan® selectivity data visualized on the kinase phylogenetic tree (see supplemental Excel file for complete KinomeScan data). All kinases with PoC values < 35 are depicted on the tree as red dots. Image generated using TREEspot™ Software Tool and reprinted with permission from KINOMEscan®, a division of DiscoveRx Corporation, © DISCOVERX CORPORATION 2010.
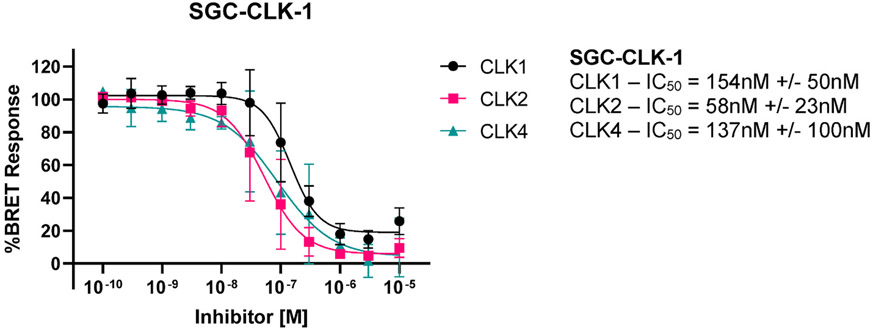
The nine kinases that bound tightest to SGC-CLK-1 in the KINOMEscan® panel, along with family member CLK3 are listed in Table 2. To validate the binding data in an enzymatic assay, we generated enzyme IC50 inhibition data using commercially available assays (if available). SGC-CLK-1 is a potent inhibitor of CLK1, CLK2, and CLK4 (IC50 values, 13 nM, 4 nM, and 46 nM, respectively). CLK3 is inhibited more poorly, with IC50 = 363 nM. SGC-CLK-1 is also an inhibitor of HIPK1, HIPK2, and STK16. The NanoBRET (NB) in cell target engagement assay can be used to measure the binding to a kinase of interest in a cellular context (Vasta et al., 2018; Wells et al., 2020). Thus, we employed that technology here to investigate cellular potency and selectivity. The NB data demonstrates that SGC-CLK-1 binds to CLK1, CLK2, and CLK4 with cellular IC50 values below 200 nM, with the CLK2 cellular affinity the best, at 58 nM (Fig. 2). The compound does show some binding in cells to STK16, but only partial inhibition was achieved (Supplemental Table S1).
Table 2.
SGC-CLK-1 binding, enzymatic and cellular target engagement characterization data.
| Kinase | % Control (1 μM)a | IC50 (nM)b | Cellular IC50 (nM)c |
|---|---|---|---|
| CLK1 | 8 | 13 | 154 ± 50 |
| CLK4 | 13 | 46 | 137 ± 100 |
| CLK2 | 16 | 4 | 58 ± 23 |
| ERK8 | 21 | nt | ntd |
| HIPK1 | 31 | 50 | >10,000 (n = 1) |
| HIPK2 | 34 | 42 | >10,000 (n = 1) |
| NEK7 | 40 | nt | ntd |
| PIP5K2B | 50 | nte | ntd |
| STK16 | 53 | 49 | 167f (n = 1) |
| CLK3 | 92 | 363 | ntd |
nt = not tested.
% Control data was generated at Eurofins DiscoverX at a concentration of 1 μM.
Enzymatic IC50 values were generated at Eurofins.
Cellular IC50 values were generated in a NanoBRET assay (n = 3).
NanoBRET assay not available.
No commercial enzyme assay available.
NanoBRET showed only partial inhibition (Supplemental Fig. S3).
Fig. 2. SGC-CLK-1 binds to CLK1, CLK2, and CLK4 in cells (n = 3).
The compounds were evaluated in NanoBRET (NB) assay which provides a quantitative measure of in-cell target engagement. For further details and background of NanoBRET assay see references (Vasta et al., 2018; Wells et al., 2020).
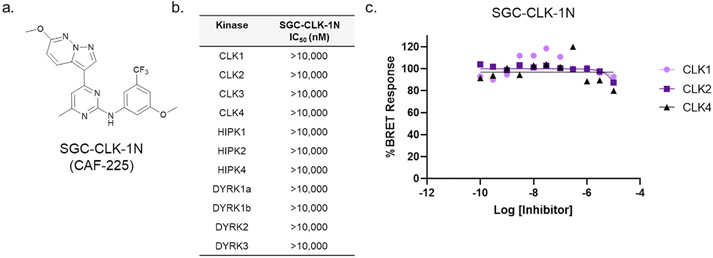
In parallel, a structurally related compound, SGC-CLK-1N, was designed and characterized as a negative control compound (Fig. 3a). The key feature is the addition of a methyl group at the 6-position of the pyrimidine. In the KINOMEscan® panel, SGC-CLK-1N did not bind to any kinases with PoC <45. In the CLK Luceome KinaseSeeker™ CLK binding assays, SGC-CLK-1N showed 100% activity remaining for CLK1, CLK2, and CLK4 when screened at a concentration of 1 μM, indicating no binding to these targets at this concentration. SGC-CLK-1N was screened in enzymatic assays, and showed no inhibition of CLK1, CLK2, CLK3, CLK4 and a small panel of closely related targets, including the DYRK and HIPK families (Fig. 3a, Supplemental Table S2). Finally, the negative control SGC-CLK-1N was inactive in the CLK1, CLK2, and CLK4 NanoBRET in-cell target engagement assays (Fig. 3b).
Fig. 3.
3a. Structure of CLK negative control SGC-CLK-1N. 3b. Negative control SGC-CLK-1N is inactive in CLK1, CLK2, CLK3, and CLK4 enzyme assays (Eurofins) 3c. Negative control SGC-CLK-1N is also inactive in the CLK1, CLK2, and CLK4 NanoBRET in cell target engagement assays.
3.2. SGC-CLK-1 is a type 1 kinase inhibitor
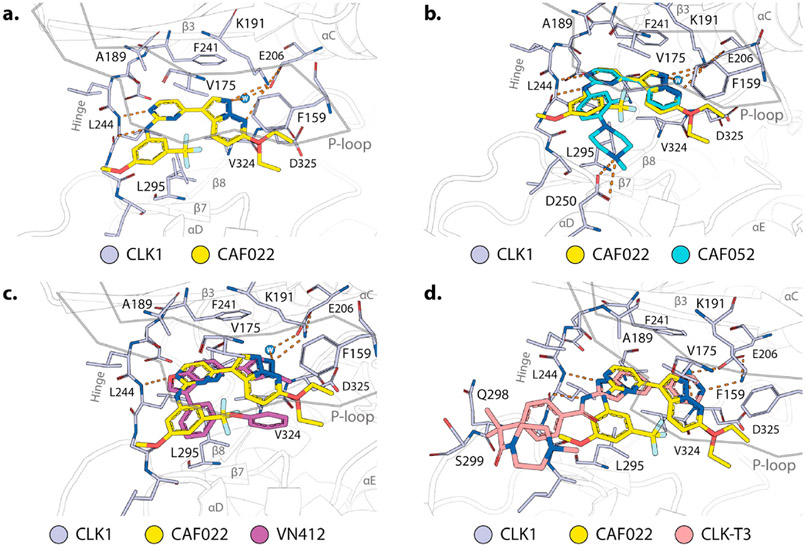
Other CLK probes are available, but SGC-CLK-1 belongs to a structurally distinct chemical series. The availability of multiple chemotypes can be useful for elucidation of function as different scaffolds often have different patterns of off targets and different properties. In Fig. 4 we present the binding mode of CAF022, a close analogue of the chemical probe SGC-CLK-1 alongside other CLK scaffolds (for structures of these other compounds and their CLK activity profiles see Supplemental Table S3).
Fig. 4. Structural analysis of CAF022 in comparison with other CLK inhibitors.
a. Crystal structure of the CLK1 (gray)-CAF022 (yellow) complex (pdb 6ZLN). Highlighted are amino acids of CLK1 that directly interact with CAF022. Hydrogen bonds are indicated by orange dashes. For the ethyl ether of CAF022 two alternative conformations were modeled. b-d. Overlay of the binding modes of CAF022 (yellow) and b. CAF052 (cyan, pdb 7AK3), c VN412 (magenta, pdb 6I5H), or d. CLK-T3 (red, pdb 6RAA). Structures of the compounds described in this figure along with activity data are in the Supplemental Table S3.
The crystal structure of the ethoxy analogue of SGC-CLK-1, CAF022, has been recently published (Schroder et al., 2020a), highlighting the impact of the interaction of the CLK1 DFG-1 residue V324 with the pyrazolo[1,5-b]pyridazine (Fig. 4a). The van-der-Waals interactions of this residue enable the correct positioning of the heterocycle to form hydrogen bonds with K191 and a structurally conserved water molecule. The importance of these back pocket interactions was confirmed by mutation studies of the V324 residue to alanine which resulted in a reduction the affinity by orders of magnitude (Schroder et al., 2020a). Intriguingly, the ethoxy moiety showed two distinct conformation and was subsequently modeled with two alternative conformations. This suggests a lack of strong direct interaction of the ethoxy group but could potentially contribute to the strong selectivity of this compound series for CLK1/2/4. CAF022 forms further typical hydrogen bonds with the hinge via the backbone of L244. The 3-methoxy-5-(trifluoromethyl) phenyl engages in van-der-Waals interactions with the p-loop of CLK1 and thus contributes further to the potency of this compound. Interestingly, a chemically similar analog, CAF052, shares key interactions seen with CAF022 in complex with CLK1 (Fig. 4b). This compound also shows high affinity towards CLK1 but lacks the selectivity for this protein family. For example, CAF052 has been recently identified as a potent ERK3 kinase binder (Schroder et al., 2020b) and the available KINO-MEscan® data of the trifluoromethyl derivative of CAF052, GW779439X (Drewry et al., 2017), confirmed the promiscuous nature of these piperazine derivates. The solvent directed piperazine of CAF052 forms an electrostatic interaction with the carboxylic acid of D250. While the untypically strong back pocket interactions of CAF022 are a key driver of the potency for CLKs, the front pocket interactions of CAF052 are most likely not limited to CLK1 and therefore limit its selectivity. The strong back pocket interactions of CAF022 are also conserved in two other, highly selective CLK inhibitors, VN412 (Nemec et al., 2019) and CLK-T3 (Funnell et al., 2017).
Analogous to CAF022, both VN412 (Fig. 4c) as well as CLK-T3 (Fig. 4d) form direct van-der-Waals interaction with V324 and form similar hydrogen bonds with K191 and a conserved back pocket water molecule. Taken together, these structural models suggest that CAF022, analogous to CLK-T3 and VN412, exploits the non-conserved back pocket of CLK1 to gain selectivity over other kinases. This binding mode results in an affinity gain particular for the CLKs while avoiding extensive ATP mimetic kinase hinge contacts.
Thus, based on kinome wide screening, a panel of in vitro binding and enzymatic assays, NanoBRET in cell target engagement assays, and crystal structure and modeling data with the ethoxy analogue CAF-022, we show that SGC-CLK-1 is a unique CLK inhibitor suitable for exploring elements of CLK biology in cells.
3.3. SGC-CLK-1 is active against multiple cancer types
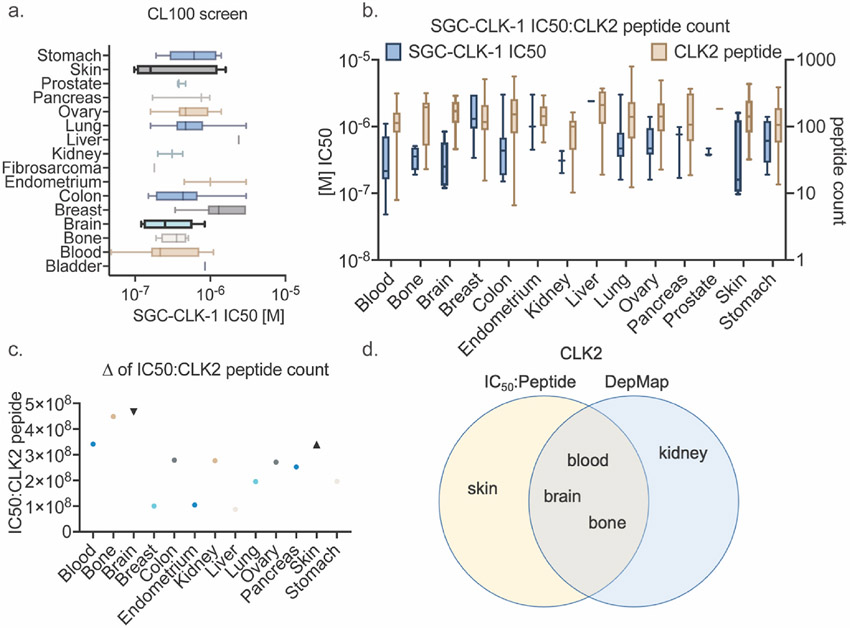
As others have linked CLK activity to cancer cell growth, we screened SGC-CLK-1 (SGC-CLK-1) in the ProQinase CL100 cancer cell line panel. IC50 values for cell-proliferation were determined for 100 different cancer cell lines using a CellTiter-Glo assay format (full data set is Supplemental Excel File “SGC-CLK-1 ProQinase CL100 cancer cell line panel data”). SGC-CLK-1 has an IC50 value for inhibiting proliferation <250 nM for 27/100 cell lines tested. Fig. 5a shows the IC50 values in subsets grouped by tissue type. As CLK2 showed the most potent inhibition with SGC-CLK-1, we focused on CLK2 expression to determine the best cancer type for further studies.
Fig. 5.
a. CL100 screen of denoted cancers by organ to determine IC50 of SGC-CLK-1, b. CCLE quantification of CLK2 peptide abundance (tan boxplot) as compared to IC50 (blue boxplot from 4a) by cancer type, c. ratio of IC50 to CLK2 peptide abundance where a higher score suggests greater CLK2 dependence, d. DepMap and IC50: peptide ratio Venn diagram for overlapping CLK2 dependent cancers.
Using mass spectrometry data from the CCLE lines to determine the peptide abundance of CLK2 in each cancer by organ, as RNAseq data and protein abundance of splicing factors does not always correlate in a 1:1 fashion, we observed that some cancer types – blood, bone, brain, and skin – had an inverse relationship of low IC50 (log scale) to high CLK2 peptide count (Fig. 5b). To better define this relationship by cancer type, we calculated the average IC50 and CLK2 peptide abundance by cancer type and determined their IC50:peptide ratio. Confirming our observations in Fig. 5b, we found blood, bone, brain, and skin with the highest ratios giving us potential cancers with a CLK2 dependency that could be targeted with a CLK2 inhibitor (Fig. 5c). To test this idea, we went to The Cancer Dependency Map (DepMap) data to determine which cancers by organ have dependencies on single genes through both RNAi and CRIPSR screens. DepMap predicted CLK2 as a dependency for neuroblastoma (various), EWS_FLI (bone), glioma (brain) and glioblastoma (brain), and hematopoietic and lymphoid (blood), among others (Fig. 5d). This substantial overlap between the IC50:peptide ratio and DepMap in cancer type was the greatest for CLK2 as compared to the other CLK family members (Supplemental Fig. 1).
3.4. CLK2 inhibition via SGC-CLK-1 redistributes CLK2 and SR proteins
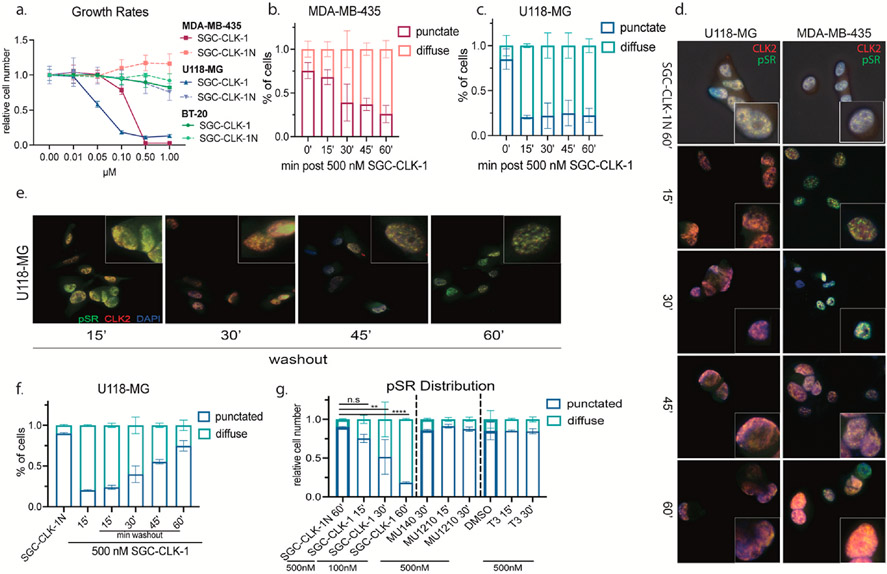
To test the efficacy of our CLK inhibitor in cell lines, we chose cell lines that showed either no (BT-20), moderate (MDA-MB-435), or maximum (U118-MG) sensitivity to SGC-CLK-1 in our screen (Fig. 5a) and had similar growth rates (Supplemental Fig. 2a). Treatment with SGC-CLK-1 showed a dose-dependent decrease in the growth of both U118-MG and MDA-MB-435 cells, but not BT-20 cells, with U118-MG cells being more sensitive as predicted with little effect of the negative control compound SGC-CLK-1N (Fig. 6a). We then quantified CLK2 protein abundance in all lines and found that U118-MG and MDA-MB-435 have similar CLK2 expression, but BT-20s have very little CLK2 at the validated size (Supplemental Fig. 2b.) and had no peptide counts in the CCLE dataset (Supplemental Fig. 2c.). As others have shown that CLK inhibition broadly decreases SR phosphorylation (pSR), we tested for but did not detect significant pSR changes at our highest treatment condition of 1 μM SGC-CLK-1. At 5 μM we observed a decrease in SR phosphorylation 30 min post SGC-CLK-1 treatment (Supplemental Figs. 2d and e). This, however, did not explain the decrease in cell growth we noted at a 10-fold lower concentration. We therefore looked at the localization of both pSRs and CLK2 post SGC-CLK-1 treatment. Surprisingly, we observed significant changes in the cellular distribution of both pSRs and CLK2 in cells treated with 500 nM treatment of SGC-CLK-1 over the course of 60 min (Fig. 6b-d). We next tested if the effect of the probe was reversible by removing SGC-CLK-1 from the media. U118-MG cells were treated with 500 nM SGC-CLK-1 for 15 min, and the media was replaced by conditioned U118-MG media where pSR and CLK2 localization was determined every 15 min for an hour. As shown in Fig. 6e and quantified in Fig. 6f, pSRs and CLK2 could redistribute to a normal punctate pattern post SGC-CLK-1 washout. In the BT-20s, which showed no growth change, we also did not observe a difference in CLK2 or pSR distribution with SGC-CLK-1N or SGC-CLK-1 (Supplemental Fig. 2f). Since SGC-CLK-1 showed a decrease in cell growth at a much lower concentration than other published CLK compounds, we wanted to test if other CLK inhibitors also affected pSR and CLK2 localization at nM-range concentrations. 500 nM treatment with the active CLK probes – MU1210 and T3 – as well as their negative controls – MU140 and DMSO – did not show any effect on pSR or CLK2 localization. MU1210 and T3 are both active in the CLK nanoBRET assays and the activity has been reported in the SGC chemical probe website (MU1210: https://www.thesgc.org/chemical-probes/MU1210; T3: https://www.thesgc.org/chemical-probes/T3-CLK). In this way, our CLK2 modulator seems to have a distinct mechanism of action at lower doses as compared to other published CLK inhibitors.
Fig. 6.
a. Crystal violet growth rates of U118-MG, MDA-MB-435, and BT-20 with denoted concentration of SGC-CLK-1 or the negative control SGC-CLK-1N for 7 days. b and c. Immunofluorescent quantification of pSR localization at denoted timepoints and cell lines with 500 nM SGC-CLK-1. d and e. Representative images of c. and f. quantification, respectively, in U118-MG cells. f. IF quantification of pSR localization post conditioned media washout in U118-MG cells. g. pSR localization via IF in denoted CLK inhibitors at either 500 or 100 nM concentrations for the times written. The bold bars depict the negative control for the respective CLK inhibitor.
4. Discussion
In this work, we show that SGC-CLK-1 (SGC-CLK-1) is a potent small molecule inhibitor of CLK1, 2 and 4 family members – with the greatest inhibition for CLK2. As the CLKs have garnered recent interest as potential therapeutic targets for osteoarthritis, solid tumors, neurodegenerative diseases, and drug refractory malignancies, a diverse set of tool compounds are necessary to better understand the role of these regulatory splicing kinases.
Using the in vitro CL100 cancer cell line panel IC50 screen, CCLE peptide abundance, and DepMap dependency information, we found that brain, skin, blood, and bone cancers show the lowest IC50 for CLK inhibition with the highest expression and greatest dependency for CLK2. We further confirm this in both a skin and brain cell line, where we find a dose-dependent decrease in growth with SGC-CLK-1 as compared to our negative control compound SGC-CLK-1N. While previous CLK inhibitors have focused on the phosphorylation status of serine/arginine rich (SR) proteins – a target of the CLK kinase family – we find that a high concentration of our probe (5 μM) decreases pSR abundance, but at a lower concentration of 500 nM this inhibitor disrupts pSR protein and CLK2 localization. The high dose effect on pSR phosphorylation is probably due to inhibition of all CLK isoforms (or other kinase targets) at the 5 μM concentration. The low dose phenotype, however, seems to be specific to our probe, as compared to other published probes, and warrants further exploration. Finally, we show that this compound can be washed out, which makes it a useful tool compound for live imaging experiments in the future to determine the localization (low dose) vs. kinase function (high dose) of the CLK family members.
As splicing modulators have become more prevalent in clinical use, a better understanding of the full role of these splicing factors and kinases are needed. SGC-CLK-1 (SGC-CLK-1) may be able to shed some light on the function of CLK family members with its non-canonical role of CLK and pSR mislocalization at low concentration vs its canonical role of phosphorylation modulation at higher doses. Future studies are needed to complete our understanding of this biologically important family and the roles they play in a diverse set of malignancies.
Supplementary Material
Acknowledgements
Funding for this project was provided by these grants from the National Institutes of Health: 1R44TR001916-02 to Luceome Biotechnologies and the SGC-UNC, U24DK116204 to UNC, (David Drewry) NS125318 to Northwestern University (Shi-Yuan Cheng), and NIH K00 CA234799 to Northwestern University (Deanna Tiek). We are grateful for support from the Structural Genomics Consortium (SGC), a registered charity (no. 1097737) that receives funds from Bayer AG, Boehringer Ingelheim, Bristol-Myers Squibb, Genentech, Genome Canada through Ontario Genomics Institute [OGI196], EU/EFPIA/OICR/McGill/KTH/Diamond Innovative Medicines Initiative 2 Joint Undertaking [EUbOPEN grant 875510], Janssen, Merck KGaA (aka EMD in Canada and USA), Pfizer, and Takeda.
We thank Brandie Ehrmann and Diane Weatherspoon of the University of North Carolina’s Department of Chemistry Mass Spectrometry Core Laboratory for assistance with mass spectrometry analysis.
Footnotes
Declaration of competing interest
The authors declare that they have no known competing financial interests or personal relationships that could have appeared to influence the work reported in this paper.
Appendix A. Supplementary data
Supplementary data to this article can be found online at https://doi.org/10.1016/j.crchbi.2023.100045.
Data availability
Our data are in the attached supplemental files.
References
- Attwood MM, et al. , 2021. Trends in kinase drug discovery: targets, indications and inhibitor design. Nat. Rev. Drug Discov 20 (11), 839–861. [DOI] [PubMed] [Google Scholar]
- Bates DO, et al. , 2017. Pharmacology of modulators of alternative splicing. Pharmacol. Rev 69 (1), 63–79. [DOI] [PMC free article] [PubMed] [Google Scholar]
- Bonnal SC, Lopez-Oreja I, Valcarcel J, 2020. Roles and mechanisms of alternative splicing in cancer - implications for care. Nat. Rev. Clin. Oncol 17 (8), 457–474. [DOI] [PubMed] [Google Scholar]
- Bossard C., et al. , 2020. Abstract 5691: SM08502, a novel, small-molecule CDC-like kinase (CLK) inhibitor, demonstrates strong antitumor effects and Wnt pathway inhibition in castration-resistant prostate cancer (CRPC) models. Cancer Res. 80 (16_Suppl. ment), 5691–5691. [Google Scholar]
- Bowler E., et al. , 2018. Hypoxia leads to significant changes in alternative splicing and elevated expression of CLK splice factor kinases in PC3 prostate cancer cells. BMC Cancer 18 (1), 355. [DOI] [PMC free article] [PubMed] [Google Scholar]
- Braun CJ, et al. , 2017. Coordinated splicing of regulatory detained introns within oncogenic transcripts creates an exploitable vulnerability in malignant glioma. Cancer Cell 32 (4), 411–426 e11. [DOI] [PMC free article] [PubMed] [Google Scholar]
- Bullock AN, et al. , 2009. Kinase domain insertions define distinct roles of CLK kinases in SR protein phosphorylation. Structure 17 (3), 352–362. [DOI] [PMC free article] [PubMed] [Google Scholar]
- Davis MI, Hunt JP, Herrgard S, Ciceri P, Wodicka LM, Pallares G, Hocker M, Treiber DK, Zarrinkar PP, 2011. Comprehensive analysis of kinase inhibitor selectivity. Nat. Biotechnol 29 (11), 1046–1051. 10.1038/nbt.1990. [DOI] [PubMed] [Google Scholar]
- Di C., et al. , 2019. Function, clinical application, and strategies of Pre-mRNA splicing in cancer. Cell Death Differ. 26 (7), 1181–1194. [DOI] [PMC free article] [PubMed] [Google Scholar]
- Drewry DH, et al. , 2017. Progress towards a public chemogenomic set for protein kinases and a call for contributions. PLoS One 12 (8), e0181585. [DOI] [PMC free article] [PubMed] [Google Scholar]
- Feoktistova M, Geserick P, Leverkus M, 2016. Crystal violet assay for determining viability of cultured cells. Cold Spring Harb. Protoc 2016 (4), 087379 pdb prot. [DOI] [PubMed] [Google Scholar]
- Funnell T., et al. , 2017. CLK-dependent exon recognition and conjoined gene formation revealed with a novel small molecule inhibitor. Nat. Commun 8 (1), 7. [DOI] [PMC free article] [PubMed] [Google Scholar]
- Gallego-Paez LM, et al. , 2017. Alternative splicing: the pledge, the turn, and the prestige : the key role of alternative splicing in human biological systems. Hum. Genet 136 (9), 1015–1042. [DOI] [PMC free article] [PubMed] [Google Scholar]
- Hanahan D, Weinberg RA, 2000. The hallmarks of cancer. Cell 100 (1), 57–70. [DOI] [PubMed] [Google Scholar]
- Hanahan D, Weinberg RA, 2011. Hallmarks of cancer: the next generation. Cell 144 (5), 646–674. [DOI] [PubMed] [Google Scholar]
- Hood J., et al. , 2017. 2-(1H-Indazol-3-YL)-3H-Imidazo[4,5-C]Pyridines and Their Anti-Inflammatory Uses Thereof. Samumed LLC, WO. [Google Scholar]
- Jester BW, et al. , 2010. A coiled-coil enabled split-luciferase three-hybrid system: applied toward profiling inhibitors of protein kinases. J. Am. Chem. Soc 132 (33), 11727–11735. [DOI] [PMC free article] [PubMed] [Google Scholar]
- Jester BW, et al. , 2012. Testing the promiscuity of commercial kinase inhibitors against the AGC kinase group using a split-luciferase screen. J. Med. Chem 55 (4), 1526–1537. [DOI] [PMC free article] [PubMed] [Google Scholar]
- Kc Sunil K., 2017. Process for Preparing N-(5-(3-(7-(3-Fluorophenyl)-3H-Imidazo[4,5-C] Pyridin-2-YL)-1H-Indazol-5-YL)Pyridin-3-YL)-3-Methylbutanamide. Samumed LLC, WO. [Google Scholar]
- Kim H., et al. , 2014. Identification of a novel function of CX-4945 as a splicing regulator. PLoS One 9 (4), e94978. [DOI] [PMC free article] [PubMed] [Google Scholar]
- Ladomery M., 2013. Aberrant alternative splicing is another hallmark of cancer. Int J Cell Biol 2013, 463786. [DOI] [PMC free article] [PubMed] [Google Scholar]
- Le KQ, et al. , 2015. Alternative splicing as a biomarker and potential target for drug discovery. Acta Pharmacol. Sin 36 (10), 1212–1218. [DOI] [PMC free article] [PubMed] [Google Scholar]
- Lee Y, Rio DC, 2015. Mechanisms and regulation of alternative pre-mRNA splicing. Annu. Rev. Biochem 84, 291–323. [DOI] [PMC free article] [PubMed] [Google Scholar]
- Lee JY, et al. , 2019. Structural basis for the selective inhibition of cdc2-like kinases by CX-4945. BioMed Res. Int 2019, 6125068. [DOI] [PMC free article] [PubMed] [Google Scholar]
- Li D., et al. , 2021. Neurodegenerative diseases: a hotbed for splicing defects and the potential therapies. Transl. Neurodegener 10 (1), 16. [DOI] [PMC free article] [PubMed] [Google Scholar]
- Lindberg MF, Meijer L, 2021. Dual-Specificity, tyrosine phosphorylation-regulated kinases (DYRKs) and cdc2-like kinases (CLKs) in human disease, an overview. Int. J. Mol. Sci 22 (11). [DOI] [PMC free article] [PubMed] [Google Scholar]
- Martin Moyano P, Nemec V, Paruch K, 2020. Cdc-like kinases (CLKs): biology, chemical probes, and therapeutic potential. Int. J. Mol. Sci 21 (20). [DOI] [PMC free article] [PubMed] [Google Scholar]
- McClorey G, Fletcher S, Wilton S, 2005. Splicing intervention for Duchenne muscular dystrophy. Curr. Opin. Pharmacol 5 (5), 529–534. [DOI] [PubMed] [Google Scholar]
- Melnyk JE, et al. , 2020. The splicing modulator sulfonamide indisulam reduces AR-V7 in prostate cancer cells. Bioorg. Med. Chem 28 (20), 115712. [DOI] [PubMed] [Google Scholar]
- Mueller WF, Hertel KJ, 2012. The role of SR and SR-related proteins in pre-mRNA splicing. In: RNA Binding Proteins, pp. 27–46. [Google Scholar]
- Nemec V., et al. , 2019. Furo[3,2-b]pyridine: a privileged scaffold for highly selective kinase inhibitors and effective modulators of the hedgehog pathway. Angew Chem. Int. Ed. Engl 58 (4), 1062–1066. [DOI] [PubMed] [Google Scholar]
- Ngo JC, et al. , 2005. Interplay between SRPK and Clk/Sty kinases in phosphorylation of the splicing factor ASF/SF2 is regulated by a docking motif in ASF/SF2. Mol. Cell 20 (1), 77–89. [DOI] [PubMed] [Google Scholar]
- Ogawa S., et al. , 2019. CTX-712, a novel clk inhibitor targeting myeloid neoplasms with SRSF2 mutation. Blood 134 (Suppl. ment_1), 404–404. [Google Scholar]
- Oltean S, Bates DO, 2014. Hallmarks of alternative splicing in cancer. Oncogene 33 (46), 5311–5318. [DOI] [PubMed] [Google Scholar]
- Pistoni M, Ghigna C, Gabellini D, 2010. Alternative splicing and muscular dystrophy. RNA Biol. 7 (4), 441–452. [DOI] [PMC free article] [PubMed] [Google Scholar]
- Prasad J, Manley JL, 2003. Regulation and substrate specificity of the SR protein kinase Clk/Sty. Mol. Cell Biol 23 (12), 4139–4149. [DOI] [PMC free article] [PubMed] [Google Scholar]
- Qin Z., et al. , 2021. Development of cdc2-like kinase 2 inhibitors: achievements and future directions. J. Med. Chem 64 (18), 13191–13211. [DOI] [PubMed] [Google Scholar]
- Ren P., et al. , 2021. Alternative splicing: a new cause and potential therapeutic target in autoimmune disease. Front. Immunol 12, 713540. [DOI] [PMC free article] [PubMed] [Google Scholar]
- Riggs JR, et al. , 2017. The discovery of a dual TTK protein kinase/CDC2-like kinase (CLK2) inhibitor for the treatment of triple negative breast cancer initiated from a phenotypic screen. J. Med. Chem 60 (21), 8989–9002. [DOI] [PubMed] [Google Scholar]
- Roskoski R Jr.., 2022. Properties of FDA-approved small molecule protein kinase inhibitors: a 2022 update. Pharmacol. Res 175, 106037. [DOI] [PubMed] [Google Scholar]
- Schneider-Poetsch T, Chhipi-Shrestha JK, Yoshida M, 2021. Splicing modulators: on the way from nature to clinic. J. Antibiot. (Tokyo) 74 (10), 603–616. [DOI] [PMC free article] [PubMed] [Google Scholar]
- Schroder M., et al. , 2020a. DFG-1 residue controls inhibitor binding mode and affinity, providing a basis for rational design of kinase inhibitor selectivity. J. Med. Chem 63 (18), 10224–10234. [DOI] [PubMed] [Google Scholar]
- Schroder M., et al. , 2020b. Crystal structure and inhibitor identifications reveal targeting opportunity for the atypical MAPK kinase ERK3. Int. J. Mol. Sci 21 (21). [DOI] [PMC free article] [PubMed] [Google Scholar]
- Shi Y., et al. , 2017. A triple exon-skipping luciferase reporter assay identifies a new CLK inhibitor pharmacophore. Bioorg. Med. Chem. Lett 27 (3), 406–412. [DOI] [PMC free article] [PubMed] [Google Scholar]
- Sun QZ, et al. , 2017. Discovery of potent and selective inhibitors of cdc2-like kinase 1 (CLK1) as a new class of autophagy inducers. J. Med. Chem 60 (14), 6337–6352. [DOI] [PubMed] [Google Scholar]
- Tam BY, et al. , 2020. The CLK inhibitor SM08502 induces anti-tumor activity and reduces Wnt pathway gene expression in gastrointestinal cancer models. Cancer Lett. 473, 186–197. [DOI] [PubMed] [Google Scholar]
- Tiek DM, et al. , 2019. Estrogen-related receptor beta activation and isoform shifting by cdc2-like kinase inhibition restricts migration and intracranial tumor growth in glioblastoma. FASEB J 33 (12), 13476–13491. [DOI] [PMC free article] [PubMed] [Google Scholar]
- Tiek DM, et al. , 2022. Temozolomide-induced guanine mutations create exploitable vulnerabilities of guanine-rich DNA and RNA regions in drug-resistant gliomas. Sci. Adv 8 (25), eabn3471. [DOI] [PMC free article] [PubMed] [Google Scholar]
- Vasta JD, et al. , 2018. Quantitative, wide-spectrum kinase profiling in live cells for assessing the effect of cellular ATP on target engagement. Cell Chem. Biol 25 (2), 206–214 e11. [DOI] [PMC free article] [PubMed] [Google Scholar]
- Wells CI, et al. , 2020. Quantifying CDK inhibitor selectivity in live cells. Nat. Commun 11 (1), 2743. [DOI] [PMC free article] [PubMed] [Google Scholar]
Associated Data
This section collects any data citations, data availability statements, or supplementary materials included in this article.
Supplementary Materials
Data Availability Statement
Our data are in the attached supplemental files.


