

Abstract
Background
The development of Crohn’s disease [CD] involves immune cell signalling pathways regulated by epigenetic modifications. Aberrant DNA methylation has been identified in peripheral blood and bulk intestinal tissue from CD patients. However, the DNA methylome of disease-associated intestinal CD4+ lymphocytes has not been evaluated.
Materials and Methods
Genome-wide DNA methylation sequencing was performed from terminal ileum CD4+ cells from 21 CD patients and 12 age- and sex-matched controls. Data were analysed for differentially methylated CpGs [DMCs] and methylated regions [DMRs]. Integration was performed with RNA-sequencing data to evaluate the functional impact of DNA methylation changes on gene expression. DMRs were overlapped with regions of differentially open chromatin [by ATAC-seq] and CCCTC-binding factor [CTCF] binding sites [by ChIP-seq] between peripherally derived Th17 and Treg cells.
Results
CD4+ cells in CD patients had significantly increased DNA methylation compared to those from the controls. A total of 119 051 DMCs and 8113 DMRs were detected. While hypermethylated genes were mostly related to cell metabolism and homeostasis, hypomethylated genes were significantly enriched within the Th17 signalling pathway. The differentially enriched ATAC regions in Th17 cells [compared to Tregs] were hypomethylated in CD patients, suggesting heightened Th17 activity. There was significant overlap between hypomethylated DNA regions and CTCF-associated binding sites.
Conclusions
The methylome of CD patients shows an overall dominant hypermethylation yet hypomethylation is more concentrated in proinflammatory pathways, including Th17 differentiation. Hypomethylation of Th17-related genes associated with areas of open chromatin and CTCF binding sites constitutes a hallmark of CD-associated intestinal CD4+ cells.
Keywords: Crohn’s disease, C4+ lymphocytes, DNA methylation, CTCF, Th17 cells
1. Introduction
The aetiology of Crohn’s disease [CD] is complex and involves genetic predisposition and environmental triggers, which in turn can lead to epigenetic reprogramming and changes in gene expression. Over 200 genetic susceptibility loci associated with CD have been identified. However, genetic predisposition is only thought to contribute to 13% of the risk of developing CD, highlighting the need for deeper understanding of epigenetic mechanisms that may lead to the development of CD.1–3
Immune T cells play a critical role in the pathogenesis of CD, particularly Th17 and T regulatory [Treg] cells.4 Th17 and Treg cell differentiation is tightly controlled by a network of transcription factors that epigenetically control gene transcription.5,6 CCCTC-binding factor [CTCF], initially known as an insulator, is now recognized as an architectural protein that can mediate chromosomal structure and facilitates enhancer–promoter interactions.7 During Th17 differentiation, basic leucine zipper ATF-like transcription factor [BATF] modulates the recruitment of CTCF to promote chromatin looping and Th17-specifc gene transcription.8 The transcription factor CTCF binds to DNA in a methylation-dependent manner and is known to play a role in gene expression by regulating genomic structure.9 Environmental stimuli contribute to the pathogenesis of inflammatory bowel disease [IBD] by altering the epigenetic landscape of T cells.10–12 In response to environmental triggers, naïve CD4+ T cells are hypothesized to shift to a Th17-like pro-inflammatory state coupled with attenuated immunosuppressive function.13,14 Epigenetic alterations that can account for this pro-inflammatory state include changes in DNA methylation.8 Typically, hypermethylation correlates with decreased gene expression, while hypomethylation correlates with increased gene expression.15,16
The DNA methylome of patients with IBD has been shown to be significantly deregulated compared to that of healthy individuals.17–19 However, the currently available data on DNA methylation in IBD derives from either peripheral blood or bulk intestinal tissue, both composed of heterogeneous cell populations precluding deeper understanding of cell-specific changes. Therefore, results may not be representative of the predominant T-cell-mediated pathobiological dysregulation that occurs in CD. To fill this gap, we integrated DNA methylation profiling with ATAC and ChIP sequencing data to provide mechanistic insight into transcriptional deregulation in Crohn’s derived CD4+ lymphocytes.
We demonstrate here that CD patients have a distinct DNA methylome profile compared to controls, with hypomethylation of T cell-mediated inflammatory pathways, including the Th17-associated gene network. Th17 cell-specific open chromatin regions were predominantly hypomethylated in the CD4+ cells of CD patients. In addition, we found that these regions are specifically localized by the transcription factor CTCF, suggesting heightened Th17 activity.
2. Materials and Method
2.1. Study subjects and samples
Twenty-one patients with CD and 12 age- and sex-matched controls were selected from an ongoing sample collection and study database. All patients had either resection or mucosal biopsies of the terminal ileum. For controls, biopsies were performed at the time of screening by colonoscopy for non-IBD-related indications. For cases, inflamed ileal tissue was obtained. The freshly collected samples were immediately processed for CD4+ cell isolation. The data and sample collection were performed in accordance with the Mayo Clinic Institutional Review Board [IRB] guidelines.
2.2. Isolation of lamina propria CD4+ lymphocytes
The protocol has been described previously.10 Briefly, the tissue initially underwent mechanical disruption in the presence of 1 mM EDTA in a 37°C CO2 incubator for 30 min, followed by collagenase [1 mg/mL], DNase [1 mg/mL] and trypsin inhibitor [1 mg/mL] overnight at 4°C in cRPMI supplemented with 10% human serum. After passage through a 70-μm cell strainer, the buffy coat was isolated using Ficoll gradient centrifugation. Lamina propria CD4+ cells were isolated using magnetic bead sorting [CD4+ T cell isolation kit, 130-091-155, Miltenyi Biotec] and two passes through the LS column on the MACS magnet separator. Purification [>95% purity] was confirmed by flow cytometry. From the matching RNA-seq dataset, we performed cell type proportion estimates through the deconvolution algorithm Cibersort.20 The estimated CD4 fractions [combined CD4 naïve, CD4 memory resting, CD4 memory activated, T cell follicular helper and Tregs] ranged from 0.69 to 0.95 [Supplementary Figure S1], confirming the high enrichment of CD4+ cells from gene expression patterns.
2.3. DNA methylation sequencing through reduced representation bisulfite sequencing
DNA was isolated from purified CD4+ cells using a genomic DNA isolation kit for reduced representation bisulfite sequencing [RRBS] library preparation and subsequent sequencing at the Mayo Clinic Genotyping Shared Resource facility. Briefly, DNA [250 ng] was digested with MspI [New England Biolabs, Catalogue Number: R0106M] and purified using Qiaquick Nucleotide Removal Kit [Qiagen, Catalogue Number: 28004]. End-repair A tailing was performed [New England Biolabs, Catalogue Number: M0212L] and TruSeq methylated indexed adaptors [Illumina, Catalogue Number: 15025064] were ligated with T4 DNA ligase [New England Biolabs, Catalogue Number: M0202L]. Size selection was performed with Agencourt AMPure XP beads [Beckman Coulter, Catalogue Number: A63882]. Bisulfite conversion was performed using EZ-DNA Methylation Kit [Zymo Research, Catalogue Number: D5001] as recommended by the manufacturer with the exception that incubation was performed using 55 cycles of 95°C for 30 s and 50°C for 15 min. Following bisulfite treatment, the DNA was purified as directed and amplified using Pfu Turbo C Hotstart DNA Polymerase [Agilent Technologies, Catalogue Number: 600414]. Library quantification was performed using Qubits dsDNA HS Assay Kit [Life Technologies, Catalogue Number: Q32854] and the Bioanalyzer DNA 1000 Kit [Agilent Technologies, Catalogue Number: 5067-1504].
The final libraries for RRBS were prepared for sequencing as per the manufacturer’s instructions in the Illumina cBot system. The samples were placed onto seven lanes of a paired-end flow cell at concentrations of 7–8 pM and the control sample, PhiX, was placed in the eighth lane to allow the sequencer to account for the unbalanced representation of cytosine bases. The flow cell was then loaded into the Illumina cBot for generation of cluster densities. After cluster generation, the flow cells were sequenced as 51 × 2 paired-end reads using Illumina HiSeq 2000 with TruSeq SBS sequencing kit version 3. Data were collected using HiSeq data collection version 1.5.15.1 software, and the bases were called using Illumina’s RTA version 1.13.48.
2.4. RNA-seq
The matching RNA-seq data were described and reported previously.10 Briefly, total RNA was extracted from purified CD4+ cells using Exiqon’s miRCURY RNA Isolation Kit. Illumina’s TruSeq un-stranded RNA library preparation protocol was used for RNA-seq library preparation. Paired-end sequencing was carried out using the Illumina HiSeq 2000 sequencer at 50 bp [three or four samples per lane], which generated 42–113 million paired-end reads for each sample. Raw data were processed using the MAPR-Seq pipeline.21
2.5. In vitro T cell polarization and flow cytometry
Peripheral blood was obtained from three healthy adult donors and the buffy coat was isolated following Ficoll gradient centrifugation. Subsequently, after lysis of red blood cells, peripheral blood mononuclear cells were isolated. A magnetic bead separation kit [Miltenyi Biotec] was used to obtain CD4+ cells. Next, CD45RA+ cells were isolated using a magnetic separation kit [Miltenyi Biotec] and stimulated with mouse anti-human CD28 [1 µg/mL; BioLegend] and plate-bound anti-CD3 [2 µg/mL; BioLegend]. The following conditions were used for induction of T cell subtypes as previously described22,23: Treg: TGF-β1 [5 ng/mL; Peprotech] and IL-2 [2 U/mL; Peprotech]; Th17: IL-1β1 [20 ng/mL; Peprotech], TGF-β1 [5 ng/mL; Peprotech], IL-6 [50 ng/mL; Peprotech], IL-21 [100 ng/mL; Peprotech], IL-23 [20 ng/mL; Peprotech], mouse anti-human IFN-γ [10 µg/mL; BD Biosciences] and anti-IL4 [2.5 µg/mL]. After 5 days, cells were rested and stimulated with mouse anti-human CD28 and plate-bound anti-CD3. Chromatin accessibility at the RORC locus [highly specific for the Th17 phenotype] was assessed through ATAC-seq [Supplementary Figure S2]. At day 7, we perform quality control staining by flow cytometry using fluorochrome-tagged monoclonal antibodies [Biolegend] for RORγt and FOXP3 as the final step in a pooled aliquot of sample prior to subsequent experimental steps.
2.6. Omni-ATAC-seq for polarized day 3 Th17 and Treg cells
The cells were resuspended with 50 µL of cell lysis buffer [RSB buffer: 10 mM Tris-HCl pH 7.4, 10 mM NaCl and 3 mM MgCl2 in water, containing 0.1% NP40, 0.1% Tween-20 and 0.01% digitonin] and lysed for 3 min on ice. The tube was gently mixed by inverting after adding 1 mL of ATAC-seq wash buffer (RSB containing 0.1% Tween-20 [without NP40 or digitonin]). Nuclei were then collected by centrifugation [500 rcf at 4°C for 10 min]. Nuclei were resuspended in 50 mL of Tn5 transposition buffer (25 µL 2× TD buffer, 2.5 µL transposase [100 nM final], 16.5 µL PBS, 0.5 µL 1% digitonin, 0.5 µL 10% Tween-20, 5 µL H2O). The reaction was incubated at 37°C for 30 min in a thermomixer with mixing at 1000 rpm. The libraries were purified by double size selection [0.55× to 1.35× beads] using AMPure XP magnetic beads. Real-time PCR analysis was performed using SYBR Green universal PCR mixes [Bio-Rad] to check the enrichment of accessible regions in the library DNAs. The following primers were used—accessible regions: Fam86fp-F: 5ʹ-GGCATTAGGGCGGGGATAAA-3ʹ, Fam86fp-R: 5ʹ-TAAGACCTGTCTCCTGGGCT-3ʹ; Ccdc146-F: 5ʹ-GCTCCGCCTCTTAGAAACCA-3ʹ, Ccdc146-R: 5ʹ-GCGATTCTAACACCTGCCCT-3ʹ; and inaccessible region: hATAC-C19 inter-F: 5ʹ-GCTTGTCTTTCCCAAGTTTACTC-3ʹ, hATAC-C19 inter-R: 5ʹ-TAGCTGTCGCACTTCAGAGGA-3ʹ. The ATAC-seq libraries were sequenced to 51 bp from both ends on an Illumina HiSeq 4000 instrument in the Mayo Clinic Center for Individualized Medicine Medical Genomics Facility.
2.7. Chromatin immunoprecipitation followed by DNA sequencing for CTCF
Human CD45RA+ T cells were cultured for 3 days under either Th17 [TGF-β1, IL-6, IL-21, IL-23, anti-IFN-γ and anti-IL4 antibodies] or Treg [TGF-β1 and IL-2] polarizing conditions. Cells were harvested at day 3 and chromatin immunoprecipitation [ChIP] was performed following a previously published protocol.24 The antibody used was anti-CTCF [C15410210; Diagenode]. DNA was precipitated with 0.4 M LiCl and a linear polyacrylamide and extracted using phenol/chloroform/isoamyl alcohol extraction as previously described.25 ChIP DNA library preparation was performed using 10 ng per reaction, and input DNA using the MicroPlex Library Preparation Kit [Diagenode] and sequencing was performed by the Mayo Clinic Medical Genomics Core. These were sequenced to 50 bp from both ends using the Illumina HiSeq 2000.
2.8. Bioinformatic data analysis
RRBS data were processed using our SAAP-BS [v1.0].26 Briefly, the sequence reads in fastq were aligned to UCSC human reference genome version 19 [hg19] to obtain CpG site methylation including both methylated and unmethylated cytosine counts and methylation ratio. Only CpG sites with ≥5× coverage in 80% of samples were kept for further analyses. Rigorous quality control was conducted through within- and across-sample CpG detection rate, boxplot, density plot, principal components analysis and unsupervised clustering. The conversion ratios for all samples were >0.999 and ~2.5 million CpGs were detected at 5× coverage in 80% of all samples. For quality control and global methylation, only CpGs that were captured at 5× in all samples were used.
Differentially methylated CpG [DMC] was identified by the beta binomial model implemented in Methylsig27 between the cases and controls. The beta binomial model has the flexibility of beta in modelling the distribution of methylation levels across biological replicate samples and taking into account the uncertainty associated with different coverages in different CpG sites. CpGs with a differential p value of <0.01 and absolute methylation difference >10% were considered as significantly changed. The distribution of these DMCs in the genome was summarized against various genomic regions such as intergenic, intron, 5ʹ untranslated region [UTR], 3ʹUTR, CDS, promoter, CpG island, shore or shelf.
Differentially methylated regions [DMRs] were detected by tiling the genome into 50-bp windows and those with at least one CpG mapped in at least a third of samples were used for statistical testing for differential methylation for the region. Regions with p < 0.01 and absolute methylation difference >10% were identified as DMRs. DMRs were annotated according to their locations relative to transcription start sites [TSSs] of human gene annotations for hg19. DMR-associated genes were defined as those whose promoters [TSS ±1500 bp] overlap with DMRs. Pathway or gene set enrichment analysis was performed by RITAN28 and ENRICHR.29 As many DMRs were located in intergenic regions, we also conducted transcription factor binding site enrichment analysis by ReMapEnrich.30 The study design and analytical workflow are outlined in Figure 1A.
Figure 1.

Experimental design and genome-wide DNA methylation. [A] Experimental design and analytical workflow. [B] Boxplot of DNA methylation ranges genome-wide in controls [green] and cases [red]. [C] PCA plot showing the separation of cases from controls. [D] Differential methylation between cases and controls and the distribution of changes in the genome outlined in volcano plot for DMCs by FDR [left] and p value [right]. Hypermethylation in the cases is dominant. [E] DMC distribution relative to CpG islands [CGI]. [F] Distribution of hyper- and hypo-DMCs separately. Hypermethylation is found significantly more in the CpG island shore and shelf regions. [G] Relative to genes, hyper- and hypo-DMCs are distributed similarly in most of the regions although hypo-DMCs are fewer in promoter regions.
Promoter DNA methylation and gene expression was investigated by first extracting CpGs within 1 kb up- or downstream of TSSs for each sample and transcript and differential methylation was performed for pooled CpGs in each region [up- and downstream separately] between cases and control samples. Regions with adjusted p < 0.05 were considered as differentially methylated and were compared with differential gene expression data (false discovery rate [FDR] < 0.05 and fold change > 1.5). Genes whose promoter methylation and expression were anti-correlated were extracted for functional analysis using pathway or gene network analysis.
The ATAC-seq data were processed using our modified HiChIP pipeline.31 Briefly, paired-end reads were mapped to the human reference genome [hg19] by Burrows–Wheeler Alignment [BWA]32 with default settings, and only pairs with at least one of the ends being uniquely mapped were retained for further analysis. Alignments were position sorted and duplicates were removed using the Picard tools [https://broadinstitute.github.io/picard/]. Peaks were called using the MACS2 algorithm at FDR ≤ 1%. The differential binding peaks between Th17 and Treg cells were called by the R package DiffBind with default parameters. Peaks with p < 1e-5 and absolute log2-fold change >1 were defined as significantly differential open peaks. Differential methylation in these differential peaks in patients’ CD4+ RRBS samples was performed first by mapping CpGs in the regions and only those with sufficient CpGs mapped were pursued for differential analysis using the same model as described before.
Processing of the CTCF ChIP-seq data was performed using the same pipeline as described above for ATAC-seq with the exception of calling peaks in each ChIP sample based on corresponding input samples instead of a random genomic background distribution. As with ATAC-seq, the differential analysis of CTCF binding in Th17 and Treg cells was performed using the R package Diffbind using the same aforementioned statistical cutoffs.
The overlap of the differential CTCF regions with the differential methylated regions was performed using in-house scripts. The genes closest to the overlapping regions were annotated using the HOMER software [http://homer.ucsd.edu/homer/].
2.9. Statistical analysis
For statistical analysis (Table 1), GraphPad Prism 9 (San Diego, CA) was used. Data are expressed as mean with standard deviation (SD). For numerical data, student t test was used. For categorial data, Chi-square test was used. A p value < 0.05 was required for a statistically significance difference.
Table 1.
Clinical characteristics of cases and controls
| Controls [N = 12] | Crohn’s [N = 21] ] | Total [N = 33] ] | p value | |
|---|---|---|---|---|
| Age, years | 0.217 | |||
| Mean [SD] | 48.67 [17.67] | 40.19 [19.07] | 43.27 [18.75] | |
| IQR | 29.5–59.5 | 24.0–58.5 | 24.0–58.5 | |
| Gender, n [%] | 0.692 | |||
| Female | 6 [50] | 12 [57.1] | 18 [54.5] | |
| Male | 6 [50] | 9 [42.9] | 15 [45.5] | |
| Age group, n [%] | 0.537 | |||
| <30 years | 3 [25.0] | 8 [38.1] | 11 [33.3] | |
| 30–55 years | 4 [33.3] | 8 [38.1] | 12 [36.4] | |
| >55 years | 5 [41.7] | 5 [23.8] | 10 [30.3] | |
| Smoking status, n [%] | ||||
| Current* | 1 [4.8] | 1 [4.8] | 2 [6.1] | 0.304 |
| Former | 2 [16.7] | 9 [42.9] | 11 [33.3] | |
| Never | 9 [75] | 11 [52.3] | 20 [60.6] | |
| BMI | 0.368 | |||
| Mean [SD] | 26.2 [4.3] | 24.8 [4.1] | 25.3 [4.1] | |
| Disease location, n [%] | ||||
| Ileal | — | 4 [19.1] | ||
| Ileocolonic | — | 17 [80.1] | ||
| Colonic | — | — | ||
| Disease phenotype, n [%] | ||||
| Inflammatory | — | 1 [4.8] | ||
| Stricturing | — | 12 [57.1] | ||
| Penetrating | — | 8 [38.1] | ||
| Disease recurrence, n [%] | ||||
| Recurrence [Rutgeerts ≥ 2] | — | 10 [57.6] | ||
| No recurrence [Rutgeerts 0 or 1] | — | 7 [33.3] | ||
| Unknown | — | 4 [19.1] | ||
| Biologic use* | ||||
| No | — | 7 [33.3%] | ||
| Yes | — | 14 [66.7%] | ||
| Anti-TNF | — | 14 [100%] | ||
| Anti-integrin | 0 [0%] | |||
| Anti IL-12/23 | 0 [0%] | |||
| Immunomodulator use* | ||||
| No | — | 17 [80.1%] | ||
| Yes | — | 4 [19.1] | ||
| Azathioprine or 6MP | 2 [50%] | |||
| Methotrexate | 2 [50%] | |||
| Corticosteroid use* | ||||
| No | — | 10 [47.6%] | ||
| Yes | — | 11 [52.4%] | ||
*At time of surgery for cases or ileal biopsy for controls.
IQR, Interquartile range; BMI, body mass index; TNF, tumour necrosis factor; 6MP, 6-mercaptopurine.
3. Results
3.1. Clinical characteristics of study subjects
Among the 21 cases, nine were male and 12 were female, while in controls six were male and six female [Chi Square p = 0.692, Table 1]. The patients were slightly younger than the controls although there was no statistical difference [40.19 vs 48.67 years old, t test p = 0.217]. Four patients had isolated ileal CD while 17 had ileocolonic disease. Among the patients, ten had post-operative recurrence after treatment at their first follow-up endoscopy, while seven did not. The recurrence status for four patients was not available.
3.2. Global DNA methylation largely separates patients from controls
There were ~2.5 million CpGs commonly detected at ≥5× in 80% of samples and 572 000 in all 33 samples. Genome-wide methylation was slightly higher [median methylation] in some of the CD patients [Figure 1B]. The mean of genome-wide average methylation in the cases was 0.337 while this was 0.332 in the controls [p < 2.2e-16; the median was 0.063 vs 0.051, p < 2.2e-16]. Principal components analysis [PCA] showed the overall methylation of CD4+ cells in the patients differed largely from the controls [Figure 1C].
3.3. Hypermethylation dominates in CD4+ cells of patients relative to controls
We conducted differentially methylated CpG analysis [DMC] at each CpG site by the beta-binomial model.27 At an FDR of <0.05, 37 416 CpGs were differentially methylated, of which 29 044 [77.6%] were hypermethylated and 8372 were hypomethylated [Figure 1D, left]. At p < 0.01 and methylation difference >10%, we found 119 051 DMCs [36 324 of which also with FDR < 0.05], where 89 933 were hypermethylated [75.5%] and 29 118 were hypomethylated in CD4+ cells from CD patients, almost three times more in the hypermethylation direction [Figure 1D, right].
Higher proportions of DMCs occurred in known regulatory regions of inter-CGI [CpG island] region, CGI shore and shelf [Figure 1E]. Relative to genes, the DMCs were more often in intronic or intergenic regions. There were significant distribution differences between hyper- and hypomethylated CpGs. Hypermethylated CpGs occurred more frequently in CGI shore than hypomethylated CpGs [Figure 1F] while hypomethylated CpGs were at a higher proportion in the inter-CGI regions. However, in the genic region, hyper- and hypomethylated DMCs had a similar distribution [Figure 1G].
3.4. Differentially methylated regions and their functional implications
Nearby CpGs generally change in a coordinated fashion and represent a functional region. To identify such regions, we conducted DMR analysis where CpGs within a 50-bp window were summarized as a group and compared between the patient and control samples. At q < 0.05 and methylation difference >10%, 19 367 regions were found to be DMRs, of which 14 934 were hypermethylated and 4433 were hypomethylated in the CD4+ cells of the patients [Figure 2A], a pattern similar to that observed in the DMC analysis. About one-quarter of hypo-DMRs [1144] were in the promoter region of 667 genes while one-third [5223] of hyper-DMRs were in the promoters of 2843 genes. Genes with hypomethylated DMRs in their promoters were significantly enriched in the pathways related to T cell activation and immune response while hypermethylated genes were moderately enriched in metabolic or signalling pathways [Figure 2A].
Figure 2.

Differentially methylated regions in areas of open chromatin and differential CTCF binding sites. [A] DMR distribution and enriched pathways for DMR-associated genes. Over three times more DMRs are hypermethylated in cases compared to controls. Genes whose promoters are hypomethylated are significantly enriched in immune response-related pathways while hypermethylated genes are more related to cell metabolisms and homeostasis. [B] DMR enrichment in transcription factor binding sites. Left: top 20 transcription factors enriched for hypomethylated DMRs. Right: top 20 transcription factors enriched for hypermethylated DMRs. [C] DNA methylation changes in patient CD4 cells in the open chromatin regions of Th17 cells from ATAC-seq. Volcano plot of differential DNA methylation for the regions of open chromatin in Th17 cells. [D] Methylation change and chromatin openness comparison for the chromatin open regions in Th17 cells. Significantly enriched pathways for the genes in regions of open chromatin and reduced DNA methylation [left upper quadrant]. [E] Differential CTCF ChiP-seq binding sites between polarized Th17 cells and Tregs [y-axis] and associated differential DNA methylation regions found in disease-associated CD4 cells in CD patients compared to controls [x-axis]. [F] Representative Integrative Genomics Viewer [IGV] tracks of ATAC-seq and ChIP-seq for CTCF and DNA methylation data showing areas of hypomethylation in cases compared to controls with corresponding enrichment of CTCF in Th17 cells.
As a large proportion of DMRs were in intergenic regions without associated known genes for direct interpretation, we were interested in whether they were enriched in transcription factor [TF] binding sites, which include not only promoters but also other key regulatory regions such as enhancers of the genome. For this, we applied ReMAP2020 [http://remap.univ-amu.fr/annotate_page], an application that consolidates public ChiP-seq data for a variety of TFs and tests query genomic regions’ enrichment for the TF binding profile of each TF. We conducted the analysis separately for hyper- and hypomethylated DMRs. The hypomethylated DMRs were significantly enriched for Th17-related TFs such as STAT3 and RUNX1 [Figure 2B, left] while the hypermethylated DMRs had significant enrichment for KDM5b, HEXIM1 and HDAC2 [Figure 2B, right].
3.5. Promoter DNA hypomethylation is correlated with a Th17 transcriptional phenotype
Although increased expression of the Th17-associated gene network has been demonstrated in bulk intestinal tissue gene expression analysis from CD patients, the methylation pattern of promoter regions has not been investigated in disease-associated CD4+ lymphocytes.33–35 For our unique datasets, we sought to identify genes whose expression was affected by promoter DNA methylation. For this, we conducted differential methylation analysis separately for the regions 1000 bp upstream and downstream of TSSs of the genes. The DMRs were compared with 5274 differentially expressed genes [DEGs] identified from mRNA-seq for the same set of samples.10 This integrated analysis found 603 DEGs whose upstream promoters were differentially methylated and 755 DEGs whose downstream promoters were differentially methylated, which accounts for 21.4% of the total DEGs [1140 unique genes, Figure 3]. The majority of these genes exhibited the expected reverse correlation, i.e. hypermethylation with reduced gene expression and hypomethylation with increased gene expression regardless of whether up- or downstream of their TSSs [71 and 77%, Figure 3A and B], in which 88% of the pairs were concordant [Figure 3C]. Consistent with the genome-wide patterns, most of these promoters were hypermethylated with reduced expression in the CD patient samples. These hypermethylated and down-regulated genes were significantly enriched in pathways of extracellular matrix [ECM]–reception interaction, fat digestion and absorption and focal adhesion [Figure 3D]. However, for the genes that were hypomethylated and up-regulated, they were concentrated in T cell adaptive immunities [T cell receptor signalling, Th17 differentiation, natural killer cell-mediated cytotoxicity, and Th1 and Th2 cell differentiation, Figure 3E]. These data suggest that CD4+ cells in the patients leveraged methylation to silence many regular maintenance functions and activate a specialized immune response with Th17 as a hallmark.
Figure 3.
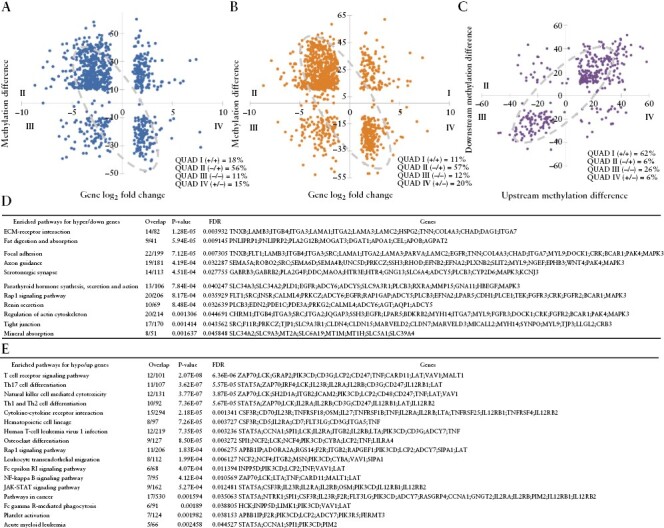
Correlation between methylation and gene expression. [A] Upstream [TSS − 1000 bp] promoter methylation and gene expression. Most gene expression and methylation [71%] are in expected anti-correlation. [B] Downstream [TSS + 1000 bp] promoter methylation and gene expression. Most gene expression and methylation [77%] are in expected anti-correlation. [C] Up- and downstream promoter methylation are highly consistent. [D] Enriched pathways for hypermethylated and downregulated genes. [E] Enriched pathways for hypomethylated and upregulated genes.
3.6. Hypomethylation occurs in the open chromatin regions of Th17 cells
Although Th17 cells and Tregs exert opposite functions [inducing and repressing inflammation, respectively], they both derive from naïve CD4+ T cells and have shared developmental requirements including TGF-β-dependent differentiation. Given their developmental similarities and to identify key chromatin determinants of Th17 cell identity, we compared areas of open chromatin between Treg and Th17 cells throughout in vitro derivation.
To confirm or refute the postulate that DNA methylation collaborates with chromatin remodelling throughout Th17 development, we compared the DNA methylation status in the open chromatin regions of our ATAC-seq data of Th17 cells. For this, we generated polarized Th17 and Treg cells from CD4+ cells obtained from three healthy donors and performed ATAC-seq for differential open regions between the two. Differential binding analysis revealed 21 800 regions that were significantly different [p < 1e-05], of which 71.3% were more open in Th17 cells. Differential methylation analysis of these regions in our clinical patient samples found 2117 regions with sufficient CpG methylation data for analysis, of which 584 were found to be differentially methylated [at FDR < 0.05]. As expected, these differentially methylated regions were mostly hypomethylated in the CD4+ cells of the patients compared to the controls [Figure 2C and D], in contrast to the genome-wide hypermethylation trend. The associated genes were significantly enriched in Th17 cell differentiation and Th1 and Th2 cell differentiation. Furthermore, 40 of these open region-associated genes with reduced methylation were up-regulated in CD patients. Again, they were significantly enriched in Th17 cell differentiation [STAT5A, IRF4, NFATC2, RORA, CD247 and CD3E], and Th1 and Th2 cell differentiation [Figure 2D], further confirming the coordination of epigenetic regulation of Th17 signature.
3.7. CTCF binding sites in Th17 cells are predominantly hypomethylated in CD4+ cells of the CD patients
The chromatic remodelling factor CTCF has recently been found to play a critical role in murine Th17 cell development through key promotor enhancer looping events that reorganize BATF target genes involved in Th17 differentiation.8 As CTCF binding can be regulated by methylation,9 we explored differential methylation of key CTCF binding elements in human Th17 cells.
We identified 896 differential CTCF regions at log2FC > |1| and p < 0.05 between the Th17 and Treg cells. Of these, 307 regions overlapped with differentially methylated CpGs. Since multiple differentially methylated CpGs can fall within a single differential CTCF region, we averaged the differential values of all CpGs falling within each CTCF region and identified the nearest gene associated with each region. We observed that most of the hypomethylated regions were associated with increased CTCF binding in the Th17 cells compared to Tregs, indicating a potential regulatory role of the combinatorial hypomethylation and CTCF signal around the nearest gene. Those regions of predominant hypomethylation correlated with increased CTCF binding at genes relevant to T cell differentiation such as TNFRSF5 [Figure 2F]. Of interest, RUNX1-IT1, a long non-coding RNA, was identified in those regions. Its role in T cell differentiation has yet to be explored.
3.8. CD4+ cells in patients with recurrence were hypomethylated genome wide and in Th17 open regions
To access if DNA methylation profiling of intestinal CD4+ T cells [obtained at time of intestinal resection for CD] could be of prognostic value to predict early post-operative disease recurrence, we compared the DNA methylation signature of patients with and without evidence of disease recurrence at time of post-operative follow-up colonoscopy. Cells from the patients with recurrence showed greater variability and tended to be separated from the cells without recurrence from PC1 and PC2 in the PCA plot [Figure 4A]. Further differential methylation analysis revealed that the cells in the former had dominant hypomethylation as 2362 out of 2964 DMRs [79.69%] had reduced methylation [Figure 4B]. The hypo-and hypermethylated DMRs were enriched in different pathways while calcium signalling was found in both [Figure 4C]. We next assessed the differential methylation for the chromatin open regions in Th17 cells and found that most of these regions in the recurrent group had reduced methylation [vs non-recurrent patients, Figure 4D]. The hypomethylated DMRs were overly represented in immune-related pathways [cytokine–cytokine receptor interaction], while the hypermethylated DMRs were enriched into Wnt and TGF-β pathways, both relevant to T cell differentiation. The genome-wide reduced methylation and hypomethylation in Th17 chromatin open regions suggest that genes related to Th17 signalling were more active in the T cells of patients with disease recurrence. This methylation pattern may represent a biomarker of early post-operative recurrence.
Figure 4.

Correlation between DNA methylation and disease recurrence. [A] PCA plot representing DNA methylation landscape for patients with recurrence [n = 10] and without recurrence [n = 7]. Samples from the patients with recurrence [blue] tend to be separated from patients without recurrence [green]. [B] DMRs between patients with and without recurrence. Most DMRs are hypomethylated in patients with recurrence. [C] Enriched pathways for hyper- and hypomethylated genes. [D] Volcano plot for differential DNA methylation in the Th17 chromatic open regions between patients with and without recurrence. Most of these regions have reduced methylation in patients with recurrence [with negative methylation difference].
4. Discussion
In this study, we conducted genome-wide DNA methylation profiling of CD-associated CD4+ T cells and found a globally hypermethylated pattern with localized hypomethylation in CD patients compared to controls. Hypomethylated genes were primarily involved in T cell adaptive immunity while hypermethylated genes were related to metabolism. We demonstrated that promoter methylation was highly correlated with gene expression by integrating paired RNA-seq data and that genes related to the Th17 signalling pathway were highly active. By comparing ATAC-seq and CTCF ChiP-seq data derived from in vitro polarized human Th17 and Treg cells, we made novel observations that Th17-relevant areas of open chromatin were mostly hypomethylated and that increased CTCF binding correlated with hypomethylation. Finally, we also identified a subset of DMRs associated with post-operative CD recurrence.
The pathogenesis of CD is complex involving many different cell types, including immune, epithelial and stromal cells of the intestine.4,36 The adaptive immune system, in particular Th17 and Treg cells, plays a major role in the pathogenesis of CD and is regulated by epigenetic changes induced by environmental cues. DNA methylation, a common form of epigenetic modification, has been shown to have the potential to be of diagnostic and prognostic value in IBD from the data derived from either peripheral blood, bulk disease-associated tissue or isolated epithelial cells.18,37 In a paediatric cohort, the CpG methylation pattern of TGF-β1 and IL-6 genes in peripheral blood differentiated CD from control patients,17 although others have raised the possibility that aberrant DNA methylation seen in CD patients is predominantly driven by inflammation itself.38 We demonstrate that DNA methylation of CD4+ T cells differentiates CD patients from controls and that patients had a more hypermethylated genome globally. Interestingly, genes with hypomethylated regions in their promoters were significantly enriched in the pathways related to T cell activation and immune response, including the Th17 differentiation pathway, while hypermethylated genes were enriched in metabolic or signalling pathways. Similar findings of global hypermethylation have been reported in DNA methylation data derived from bulk intestinal tissue from treatment-naïve ulcerative colitis patients.39 Although we found that disease recurrence was associated with DNA hypomethylation both genome-wide and in Th17 open chromatin regions, the limited number of patients made it impossible to derive and validate a reliable predictive signature. This critical question will be addressed in future studies by our group.
In CD, Th17 cells are known to play a critical role in pathogenesis by promoting a pro-inflammatory environment.40 In this study, we observed that Th17-relevant regions of open chromatin [identified in human Th17 in vitro polarized cells] were hypomethylated and correlated with more active gene expression in CD patients. In agreement, others have demonstrated in peripheral immune cells aberrant DNA methylation of genes relevant to Th17 pathways.41 A recent study demonstrated that CTCF is critical during BATF-dependent mouse T cell differentiation by promoting chromatin looping and modulating expression of BATF target regions.8 Confirming the relevance of CTCF in human Th17 cells, we found increased CTCF binding sites in Th17 cells compared to Tregs and further demonstrated that a significant proportion of those genes correlated with regions of DNA hypomethylation. Of interest, RUNX1-IT1, a long non-coding RNA associated with gastrointestinal tumour suppression,42 was one of the genes found to be significantly enriched for CTCF binding sites and also in a region of significant hypomethylation in disease-associated CD4+ cells from CD patients, suggesting its potential role in T cell differentiation. Our findings provide relevant insight into epigenetic mechanisms involved in the pathogenesis of CD and may lead to the development of novel epigenetic-based therapeutic targets.
In summary, we describe DNA methylation profiling of intestinal CD4+ cells and demonstrate that CD patients have a globally hypermethylated profile and may be of diagnostic and prognostic value. We provide novel mechanistic insights into Th17-relevant epigenetic mechanisms involved in the pathogenesis of CD, which appear to involve aberrant DNA methylation in areas of open chromatin and correlate with CTCF binding sites. Limitations of this study include overall relatively small sample size, which may have precluded us from making conclusive prognostic association of DNA methylation regarding disease recurrence. The cross-sectional nature of our study precluded us from determining if the DNA methylation changes found are stable over time. We cannot exclude that inflammation may at least partially explain the differential methylation found since only areas of inflamed intestinal tissue were assessed in cases. In addition, since peripherally induced Th17 and Treg cells were used as comparators rather than intestinal mucosa-associated CD4+ cells, our data should be interpreted with caution as they may not entirely relate to CD-associated CD4 cells. Single-cell ATAC-seq of immune cells from the intestinal mucosa is currently underway to address this gap in knowledge. Further studies involving a larger cohort of patients or single cell transcriptome or epigenomics are warranted to validate these observations.
Supplementary Material
Acknowledgments
We thank the staff of the Epigenomics Development Laboratory and Recharge Center [EDL] at Mayo Clinic for carrying out the epigenomic assays for this study. The EDL is supported in part by the Mayo Clinic Center for Individualized Medicine.
Contributor Information
Zhifu Sun, Division of Computational Biology, Mayo Clinic, Rochester, MN 55905, USA.
Manuel B Braga-Neto, Division of Gastroenterology and Hepatology, Mayo Clinic, Rochester, MN 55905, USA.
Yuning Xiong, Division of Gastroenterology and Hepatology, Mayo Clinic, Rochester, MN 55905, USA.
Adytia V Bhagwate, Division of Computational Biology, Mayo Clinic, Rochester, MN 55905, USA.
Hunter R Gibbons, Division of Gastroenterology and Hepatology, Mayo Clinic, Rochester, MN 55905, USA.
Mary R Sagstetter, Division of Gastroenterology and Hepatology, Mayo Clinic, Rochester, MN 55905, USA.
Feda H Hamdan, Division of Gastroenterology and Hepatology, Mayo Clinic, Rochester, MN 55905, USA.
Saurabh Baheti, Division of Computational Biology, Mayo Clinic, Rochester, MN 55905, USA.
Jessica Friton, Division of Gastroenterology and Hepatology, Mayo Clinic, Rochester, MN 55905, USA.
Asha Nair, Division of Computational Biology, Mayo Clinic, Rochester, MN 55905, USA.
Zhenqing Ye, Greehey Children’s Cancer Research Institute, UT Health Science Center San Antonio, San Antonio, TX 78229, USA.
William A Faubion, Division of Gastroenterology and Hepatology, Mayo Clinic, Rochester, MN 55905, USA.
Funding
This work was supported by the National Institutes of Health [grant number RO1 AI089714].
Conflict of Interest
None.
Author Contributions
MB: drafting the manuscript, critical intellectual content. ZS and WAF: study design, critical intellectual content and data interpretation. JF: clinical database and sample collection. MRS and HRG: data collection and laboratory protocols and experiments. YX, AB, FH, SB, AN and ZY: bioinformatics data collection and analysis.
Data Availability
The data underlying this article will be shared on reasonable request to the corresponding author.
References
- 1. McGovern DP, Kugathasan S, Cho JH.. Genetics of inflammatory bowel diseases. Gastroenterology 2015;149:1163–76.e2. [DOI] [PMC free article] [PubMed] [Google Scholar]
- 2. Liu JZ, van Sommeren S, Huang H, et al. ; International Multiple Sclerosis Genetics Consortium. Association analyses identify 38 susceptibility loci for inflammatory bowel disease and highlight shared genetic risk across populations. Nat Genet 2015;47:979–86. [DOI] [PMC free article] [PubMed] [Google Scholar]
- 3. Howell KJ, Kraiczy J, Nayak KM, et al. DNA methylation and transcription patterns in intestinal epithelial cells from pediatric patients with inflammatory bowel diseases differentiate disease subtypes and associate with outcome. Gastroenterology 2018;154:585–98. [DOI] [PMC free article] [PubMed] [Google Scholar]
- 4. Chang JT. Pathophysiology of inflammatory bowel diseases. N Engl J Med 2020;383:2652–64. [DOI] [PubMed] [Google Scholar]
- 5. Schmidl C, Hansmann L, Lassmann T, et al. ; FANTOM consortium. The enhancer and promoter landscape of human regulatory and conventional T-cell subpopulations. Blood 2014;123:e68–78. [DOI] [PubMed] [Google Scholar]
- 6. Ivanov II, McKenzie BS, Zhou L, et al. The orphan nuclear receptor RORgammat directs the differentiation program of proinflammatory IL-17+ T helper cells. Cell 2006;126:1121–33. [DOI] [PubMed] [Google Scholar]
- 7. Ong CT, Corces VG.. CTCF: An architectural protein bridging genome topology and function. Nat Rev Genet 2014;15:234–46. [DOI] [PMC free article] [PubMed] [Google Scholar]
- 8. Pham D, Moseley CE, Gao M, et al. BATF pioneers the reorganization of chromatin in developing effector Tcells via ETS1-dependent recruitment of CTCF. Cell Rep 2019;29:1203–20.e7. [DOI] [PMC free article] [PubMed] [Google Scholar]
- 9. Wang H, Maurano MT, Qu H, et al. Widespread plasticity in CTCF occupancy linked to DNA methylation. Genome Res 2012;22:1680–8. [DOI] [PMC free article] [PubMed] [Google Scholar]
- 10. Sarmento OF, Svingen PA, Xiong Y, et al. The role of the histone methyltransferase enhancer of Zeste Homolog 2 (EZH2) in the pathobiological mechanisms underlying inflammatory bowel disease (IBD). J Biol Chem 2017;292:706–22. [DOI] [PMC free article] [PubMed] [Google Scholar]
- 11. Bai AH, Wu WK, Xu L, et al. Dysregulated lysine acetyltransferase 2b promotes inflammatory bowel disease pathogenesis through transcriptional repression of interleukin-10. J Crohns Colitis 2016;10:726–34. [DOI] [PubMed] [Google Scholar]
- 12. Loddo I, Romano C.. Inflammatory bowel disease: genetics, epigenetics, and pathogenesis. Front Immunol 2015;6:551. [DOI] [PMC free article] [PubMed] [Google Scholar]
- 13. Zhou X, Bailey-Bucktrout S, Jeker LT, Bluestone JA.. Plasticity of CD4(+) FOXP3(+) T cells. Curr Opin Immunol 2009;21:281–5. [DOI] [PMC free article] [PubMed] [Google Scholar]
- 14. Voo KS, Wang YH, Santori FR, et al. Identification of IL-17-producing Foxp3+ regulatory T cells in humans. Proc Natl Acad Sci U S A 2009;106:4793–8. [DOI] [PMC free article] [PubMed] [Google Scholar]
- 15. Suzuki MM, Bird A.. DNA methylation landscapes: provocative insights from epigenomics. Nat Rev Genet 2008;9:465–76. [DOI] [PubMed] [Google Scholar]
- 16. Mohn F, Weber M, Rebhan M, et al. Lineage-specific polycomb targets and de novo DNA methylation define restriction and potential of neuronal progenitors. Mol Cell 2008;30:755–66. [DOI] [PubMed] [Google Scholar]
- 17. Samarani S, Dupont-Lucas C, Marcil V, et al. CpG methylation in TGFbeta1 and IL-6 genes as surrogate biomarkers for diagnosis of IBD in children. Inflamm Bowel Dis 2020;26:1572–8. [DOI] [PubMed] [Google Scholar]
- 18. Biasci D, Lee JC, Noor NM, et al. A blood-based prognostic biomarker in IBD. Gut 2019;68:1386–95. [DOI] [PMC free article] [PubMed] [Google Scholar]
- 19. Gasparetto M, Payne F, Nayak K, et al. Transcription and DNA methylation patterns of blood-derived CD8(+) T cells are associated with age and inflammatory bowel disease but do not predict prognosis. Gastroenterology 2021;160:232–44.e7. [DOI] [PMC free article] [PubMed] [Google Scholar]
- 20. Newman AM, Liu CL, Green MR, et al. Robust enumeration of cell subsets from tissue expression profiles. Nat Methods 2015;12:453–7. [DOI] [PMC free article] [PubMed] [Google Scholar]
- 21. Kalari KR, Nair AA, Bhavsar JD, et al. MAP-RSeq: Mayo analysis pipeline for RNA sequencing. BMC Bioinf 2014;15:224. [DOI] [PMC free article] [PubMed] [Google Scholar]
- 22. Braga-Neto MB, Gaballa JM, Bamidele AO, et al. Deregulation of long intergenic non-coding RNAs in CD4+ T cells of lamina propria in Crohn’s disease through transcriptome profiling. J Crohns Colitis 2020;14:96–109. [DOI] [PMC free article] [PubMed] [Google Scholar]
- 23. Ramos GP, Bamidele AO, Klatt EE, et al. G9a modulates lipid metabolism in CD4 T cells to regulate intestinal inflammation. Gastroenterology 2023;164:256–71.e10. [DOI] [PMC free article] [PubMed] [Google Scholar]
- 24. Lomberk G, Blum Y, Nicolle R, et al. Distinct epigenetic landscapes underlie the pathobiology of pancreatic cancer subtypes. Nat Commun 2018;9:1978. [DOI] [PMC free article] [PubMed] [Google Scholar]
- 25. Najafova Z, Tirado-Magallanes R, Subramaniam M, et al. Brd4 localization to lineage-specific enhancers is associated with a distinct transcription factor repertoire. Nucleic Acids Res 2017;45:127–41. [DOI] [PMC free article] [PubMed] [Google Scholar]
- 26. Sun Z, Baheti S, Middha S, et al. SAAP-RRBS: Streamlined analysis and annotation pipeline for reduced representation bisulfite sequencing. Bioinformatics 2012;28:2180–1. [DOI] [PMC free article] [PubMed] [Google Scholar]
- 27. Park Y, Figueroa ME, Rozek LS, Sartor MA.. MethylSig: a whole genome DNA methylation analysis pipeline. Bioinformatics 2014;30:2414–22. [DOI] [PMC free article] [PubMed] [Google Scholar]
- 28. Zimmermann MT, Kabat B, Grill DE, Kennedy RB, Poland GA.. Ritan: rapid integration of term annotation and network resources. PeerJ 2019;7:e6994. [DOI] [PMC free article] [PubMed] [Google Scholar]
- 29. Kuleshov MV, Jones MR, Rouillard AD, et al. Enrichr: A comprehensive gene set enrichment analysis web server 2016 update. Nucleic Acids Res 2016;44:W90–7. [DOI] [PMC free article] [PubMed] [Google Scholar]
- 30. Cheneby J, Menetrier Z, Mestdagh M, et al. Remap 2020: a database of regulatory regions from an integrative analysis of human and arabidopsis DNA-binding sequencing experiments. Nucleic Acids Res 2020;48:D180–8. [DOI] [PMC free article] [PubMed] [Google Scholar]
- 31. Yan H, Evans J, Kalmbach M, et al. HiChiP: a high-throughput pipeline for integrative analysis of ChiP-seq data. BMC Bioinf 2014;15:280. [DOI] [PMC free article] [PubMed] [Google Scholar]
- 32. Li H, Durbin R.. Fast and accurate short read alignment with Burrows-Wheeler transform. Bioinformatics 2009;25:1754–60. [DOI] [PMC free article] [PubMed] [Google Scholar]
- 33. Noble CL, Abbas AR, Lees CW, et al. Characterization of intestinal gene expression profiles in Crohn’s disease by genome-wide microarray analysis. Inflamm Bowel Dis 2010;16:1717–28. [DOI] [PubMed] [Google Scholar]
- 34. Giudici F, Lombardelli L, Russo E, et al. Multiplex gene expression profile in inflamed mucosa of patients with Crohn’s disease ileal localization: a pilot study. World J Clin Cases 2019;7:2463–76. [DOI] [PMC free article] [PubMed] [Google Scholar]
- 35. Ashton JJ, Boukas K, Davies J, et al. Ileal transcriptomic analysis in paediatric Crohn’s disease reveals IL17- and Nod-signalling expression signatures in treatment-naive patients and identifies epithelial cells driving differentially expressed genes. J Crohns Colitis 2021;15:774–86. [DOI] [PMC free article] [PubMed] [Google Scholar]
- 36. Martin JC, Chang C, Boschetti G, et al. Single-cell analysis of Crohn’s disease lesions identifies a pathogenic cellular module associated with resistance to anti-TNF therapy. Cell 2019;178:1493–1508.e20. [DOI] [PMC free article] [PubMed] [Google Scholar]
- 37. Moret-Tatay I, Cerrillo E, Saez-Gonzalez E, et al. Identification of epigenetic methylation signatures with clinical value in Crohn’s disease. Clin Transl Gastroenterol 2019;10:e00083. [DOI] [PMC free article] [PubMed] [Google Scholar]
- 38. Somineni HK, Venkateswaran S, Kilaru V, et al. Blood-derived DNA methylation signatures of Crohn’s disease and severity of intestinal inflammation. Gastroenterology 2019;156:2254–65.e3. [DOI] [PMC free article] [PubMed] [Google Scholar]
- 39. Taman H, Fenton CG, Hensel IV, Anderssen E, Florholmen J, Paulssen RH.. Genome-wide DNA methylation in treatment-naive ulcerative colitis. J Crohns Colitis 2018;12:1338–47. [DOI] [PMC free article] [PubMed] [Google Scholar]
- 40. Calderon-Gomez E, Bassolas-Molina H, Mora-Buch R, et al. Commensal-specific CD4(+) cells from patients with Crohn’s disease have a T-helper 17 inflammatory profile. Gastroenterology 2016;151:489–500.e3. [DOI] [PubMed] [Google Scholar]
- 41. Nimmo ER, Prendergast JG, Aldhous MC, et al. Genome-wide methylation profiling in Crohn’s disease identifies altered epigenetic regulation of key host defense mechanisms including the Th17 pathway. Inflamm Bowel Dis 2012;18:889–99. [DOI] [PubMed] [Google Scholar]
- 42. Liu S, Zhang J, Yin L, et al. The lncRNA RUNX1-IT1 regulates C-FOS transcription by interacting with RUNX1 in the process of pancreatic cancer proliferation, migration and invasion. Cell Death Dis 2020;11:412. [DOI] [PMC free article] [PubMed] [Google Scholar]
Associated Data
This section collects any data citations, data availability statements, or supplementary materials included in this article.
Supplementary Materials
Data Availability Statement
The data underlying this article will be shared on reasonable request to the corresponding author.