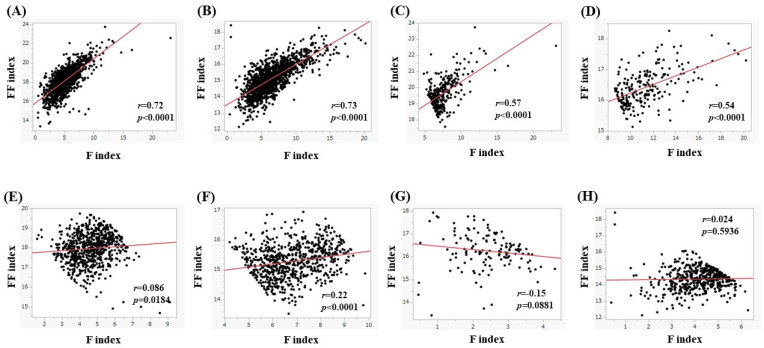
Figure 11.
(A,B) The correlation between the F index and FF index in men (A) and women (B) for all cases. (C,D) The correlation between the F index and FF index in men (C) and women (D) in subjects with a BMI of 25 kg/m2 or more. (E,F) The correlation between the F index and FF index in men (E) and women (F) in subjects with a 20 kg/m2 ≤ BMI < 25 kg/m2. (G,H) The correlation between the F index and FF index in men (G) and women (H) in subjects with a BMI < 20 kg/m2.

