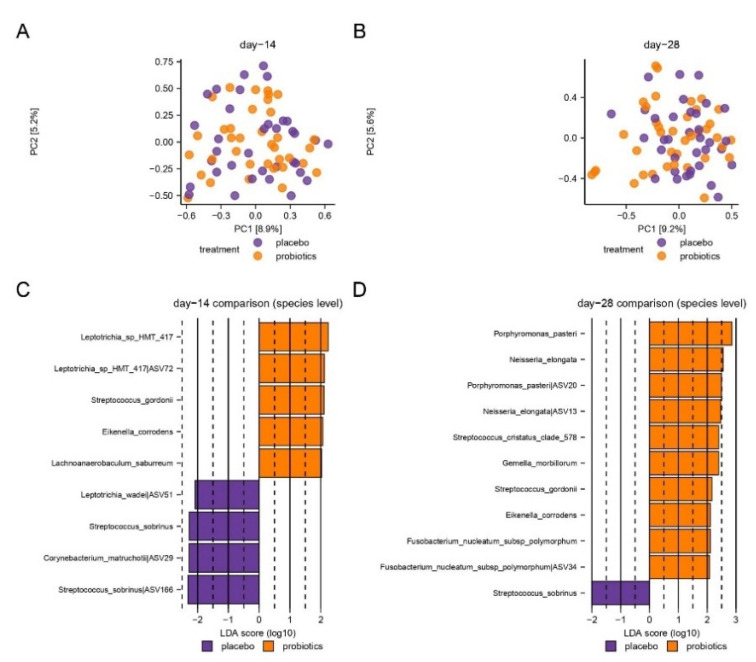
Figure 4.
Compositional changes induced by sugar stress. Principal component analysis (PCA) is expressed by the two most decisive components (PC1 and PC2), which covered approximately 15% of the variation of the dataset. Placebo vs. probiotics day 14 (A). Placebo vs. probiotics day 28 (B). LEfSe analysis expressed by significant species at day 14 (C) and day 28 (D).

