Abstract
Background:
Numerical scales are validated methods to report pain outcomes after Targeted Muscle Reinnervation (TMR) but do not include the assessment of qualitative pain components. This study evaluates the application of pain sketches within a cohort of patients undergoing primary TMR and describes differences in pain progression according to early postoperative sketches.
Methods:
This study included 30 patients with major limb amputation and primary TMR. Patients’ drawings were categorized into four categories of pain distribution (focal (FP), radiating (RP), diffuse (DP) and no pain (NP)) and inter-rater reliability was calculated. Secondly, pain outcomes were analyzed for each category. Pain scores were the primary and Patient-Reported Outcomes Measurement Information System (PROMIS) instruments were the secondary outcomes.
Results:
The inter-rater reliability for the sketch categories was good (overall Kappa coefficient of 0.8). The NP category reported a mean decrease in pain of 4.8 points, followed by the DP (2.5 points) and FP categories (2.0 points). The RP category reported a mean increase in pain of 0.5 points. For PROMIS Pain Interference and Pain Intensity, the DP category reported a mean decrease of 7.2 and 6.5 points respectively, followed by the FP category (5.3 and 3.6 points). The RP category reported a mean increase of 2.0 points in PROMIS Pain Interference and a mean decrease of 1.4 points in PROMIS Pain Intensity. Secondary outcomes for the NP category were not reported.
Conclusions:
Pain sketches demonstrated reliability in pain morphology assessment and might be an adjunctive tool for pain interpretation in this setting.
Introduction
Almost two million Americans live with limb loss, with upwards of 85% and 76% experiencing phantom limb pain (PLP) and residual limb pain (RLP), respectively.1,2 PLP and RLP have different neuropathic origin. RLP is specific to the terminal end of the remaining residual limb, while PLP refers to painful sensations within the missing limb.3 The physical and emotional impact of amputation-related pain affects patients’ quality of life and is associated with increased healthcare costs.4–7 The number of residual limb patients is estimated to double to 3.6 million by 2050, with proportionate increases in the number of people living with neuropathic pain.8
Targeted muscle reinnervation (TMR) transfers sensory or motor nerves resulting from amputation surgery to nearby motor nerves, which are transected to denervate their corresponding muscles. TMR has been shown to decrease PLP and RLP in residual limb patients and is gaining traction throughout centers with the U.S. Furthermore, TMR performed at or around the time of index amputation surgery has been shown to result in less frequent and less severe PLP and neuroma-related pain.2,5,9–13
Current evidence supporting the efficacy of TMR in preventing or treating neuroma-related pain has relied on numerical scores to report pain outcomes.2,5,9–13 Multiple Patient Reported Outcome Measures (PROMs) exist which capture the multifaceted aspects of a patient’s pain experience. Although PROMs are validated methods for use in clinical practice, no existing measures identify subjective components that may also have clinical importance. Our authors have observed that residual limb patients often present with varying pain morphologies and distributions. Pain sketches have been used in other neuropathic disorders to guide treatment based on the illustrated anatomic distribution of pain.14,15
In this context, we categorized and evaluated the application of pain sketches in residual limb patients receiving primary TMR at the time of their index amputation. From this cohort, differences in the progression of pain were analyzed in a subgroup of patients according to the sketch categories. We hypothesized that sketches may be a helpful modality to improve pain morphology assessment and track pain in this setting.
Methods
Study Design
A retrospective cross-sectional study at a single center was performed from 2020 to 2022. This study followed the Strengthening The Reporting of Observational Studies in Epidemiology (STROBE) guidelines and was approved by the Massachusetts General Brigham Institutional review board (protocol number 2020P003555).
Participants and Dataset
Patients were participants in the Massachusetts General Hospital Interdisciplinary Care for Amputee Network (ICAN) prospective data repository. The ICAN is a specialized orthoplastic clinic that combines multi-specialty functional and psychosocial rehabilitation to provide comprehensive residual limb care.16
This study consisted of two parts. First, patients with major limb amputation proximal to the wrist (transhumeral, transradial) or ankle (transfemoral, transtibial) who underwent primary TMR and completed a sketch and pain scales were included. Primary TMR was defined as undergoing TMR within 14 days of the index amputation surgery. Regardless of the amputation etiology, no substantial or pathological nerve regeneration is expected within this time frame, and the procedure is considered preemptive. Patients under 18 years old, revision or bilateral amputation (per limb pain scores were not reported), and patients who did not complete pain scores and sketches were excluded. The second part of this study included a subgroup of residual limb patients selected based on the timeframe they completed the sketch after the TMR. The time between TMR and the postoperative sketch and pain scores as well as the duration of follow-up were reported. The follow-up time was defined as the most recent appointment at which pain outcomes were collected. All patients who were enrolled in the ICAN data repository were assessed for eligibility of inclusion. Stata version 16.1. was used for descriptive statistics analysis.
Part I: Sketch categories and reliability.
The main objective of this study was to categorize and evaluate the use of pain sketches in a cohort of 30 patients who underwent primary TMR. For this purpose, we collected the first postoperative sketch that patients completed at a clinic visit before the evaluation and physical examination by the ICAN team.
A pain sketch consists of an upper or lower limb diagram depicting the frontal, lateral and transverse (axial) views. Basic instructions to complete the diagram are outlined at the top of the form, and the residual limb is highlighted on the figure for better visualization (Figure 1).
Figure 1.
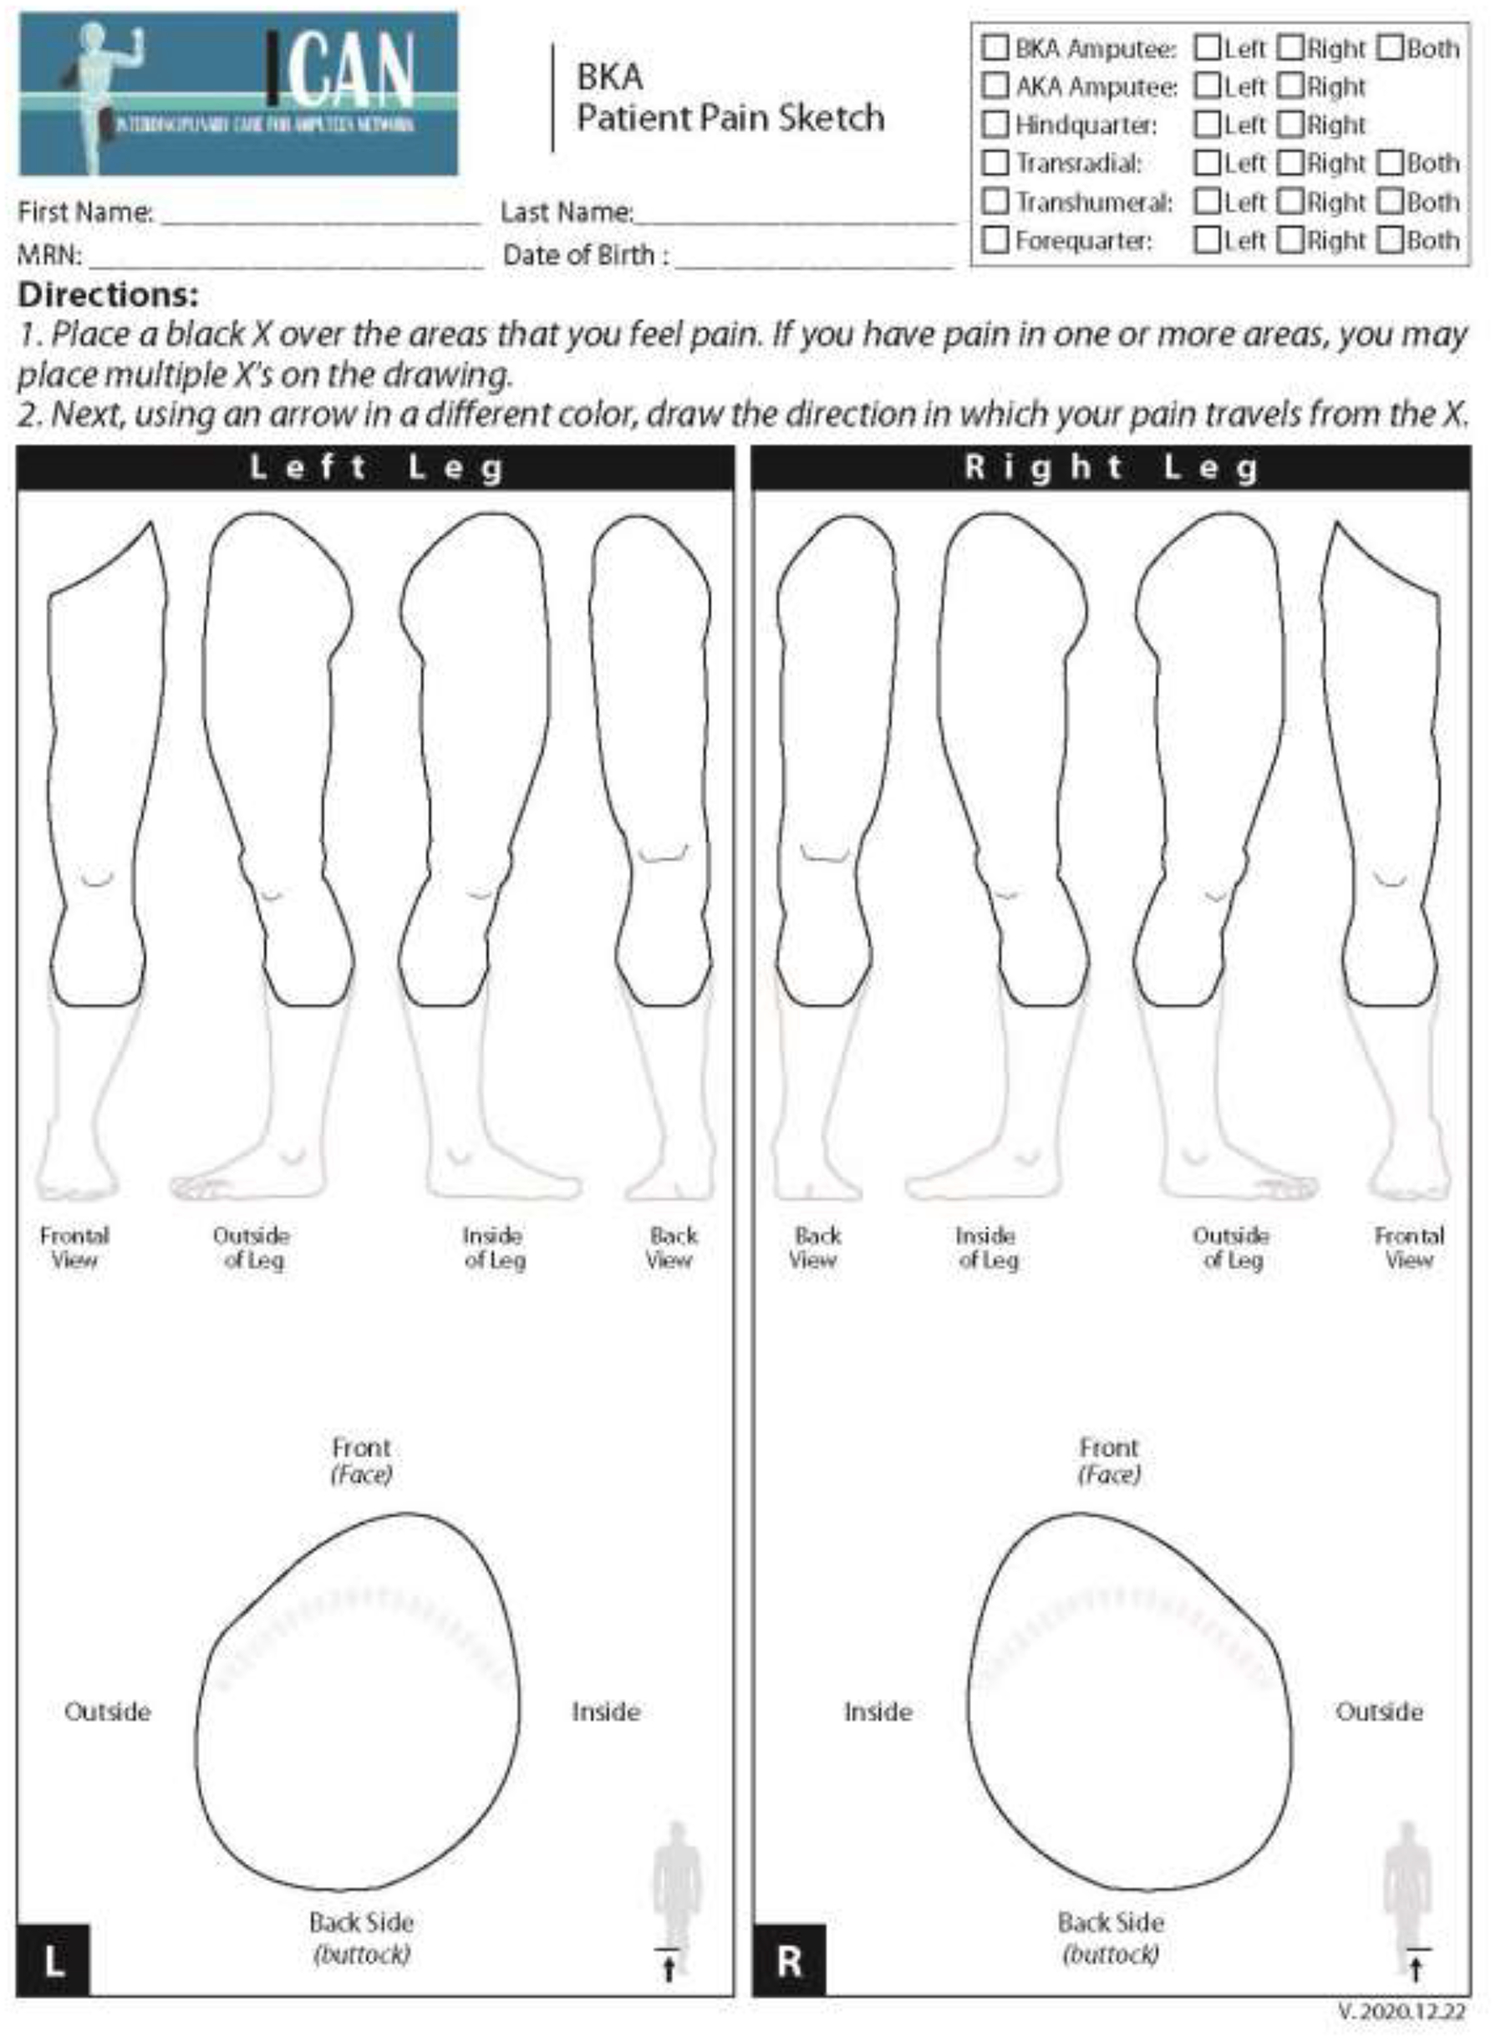
Blank Below-Knee Amputation (BKA) pain sketch.
Two researchers and two physicians analyzed the sketches to reach consensus on a comprehensive classification system. Patients’ drawings were categorized into four categories. Category 1 included drawings with a focal pain (FP) distribution (Figure 2a). Patients in this category drew one single X over the painful area or drew a circle to delineate it. Category 2 included diffuse pain (DP) drawings where patients shaded the painful area, draw multiple circles, or placed “X’” on an extended area (Figure 2b). Category 3 was defined as the radiating pain category (RP) where patients drew one or more arrows indicating the direction in which the pain extended from a specific point (Figure 2c). Patients who did not draw a pain pattern and indicated “no pain” on the sketch, were assigned to Category 4, the no pain category (NP) (Figure 2d). The reliability of this categorization system was calculated by the inter-rater reliability (IRR) using Cohen’s kappa.17 IRR was based on blinded assessment of sketches in the four categories by four members of the ICAN team.
Figure 2a.
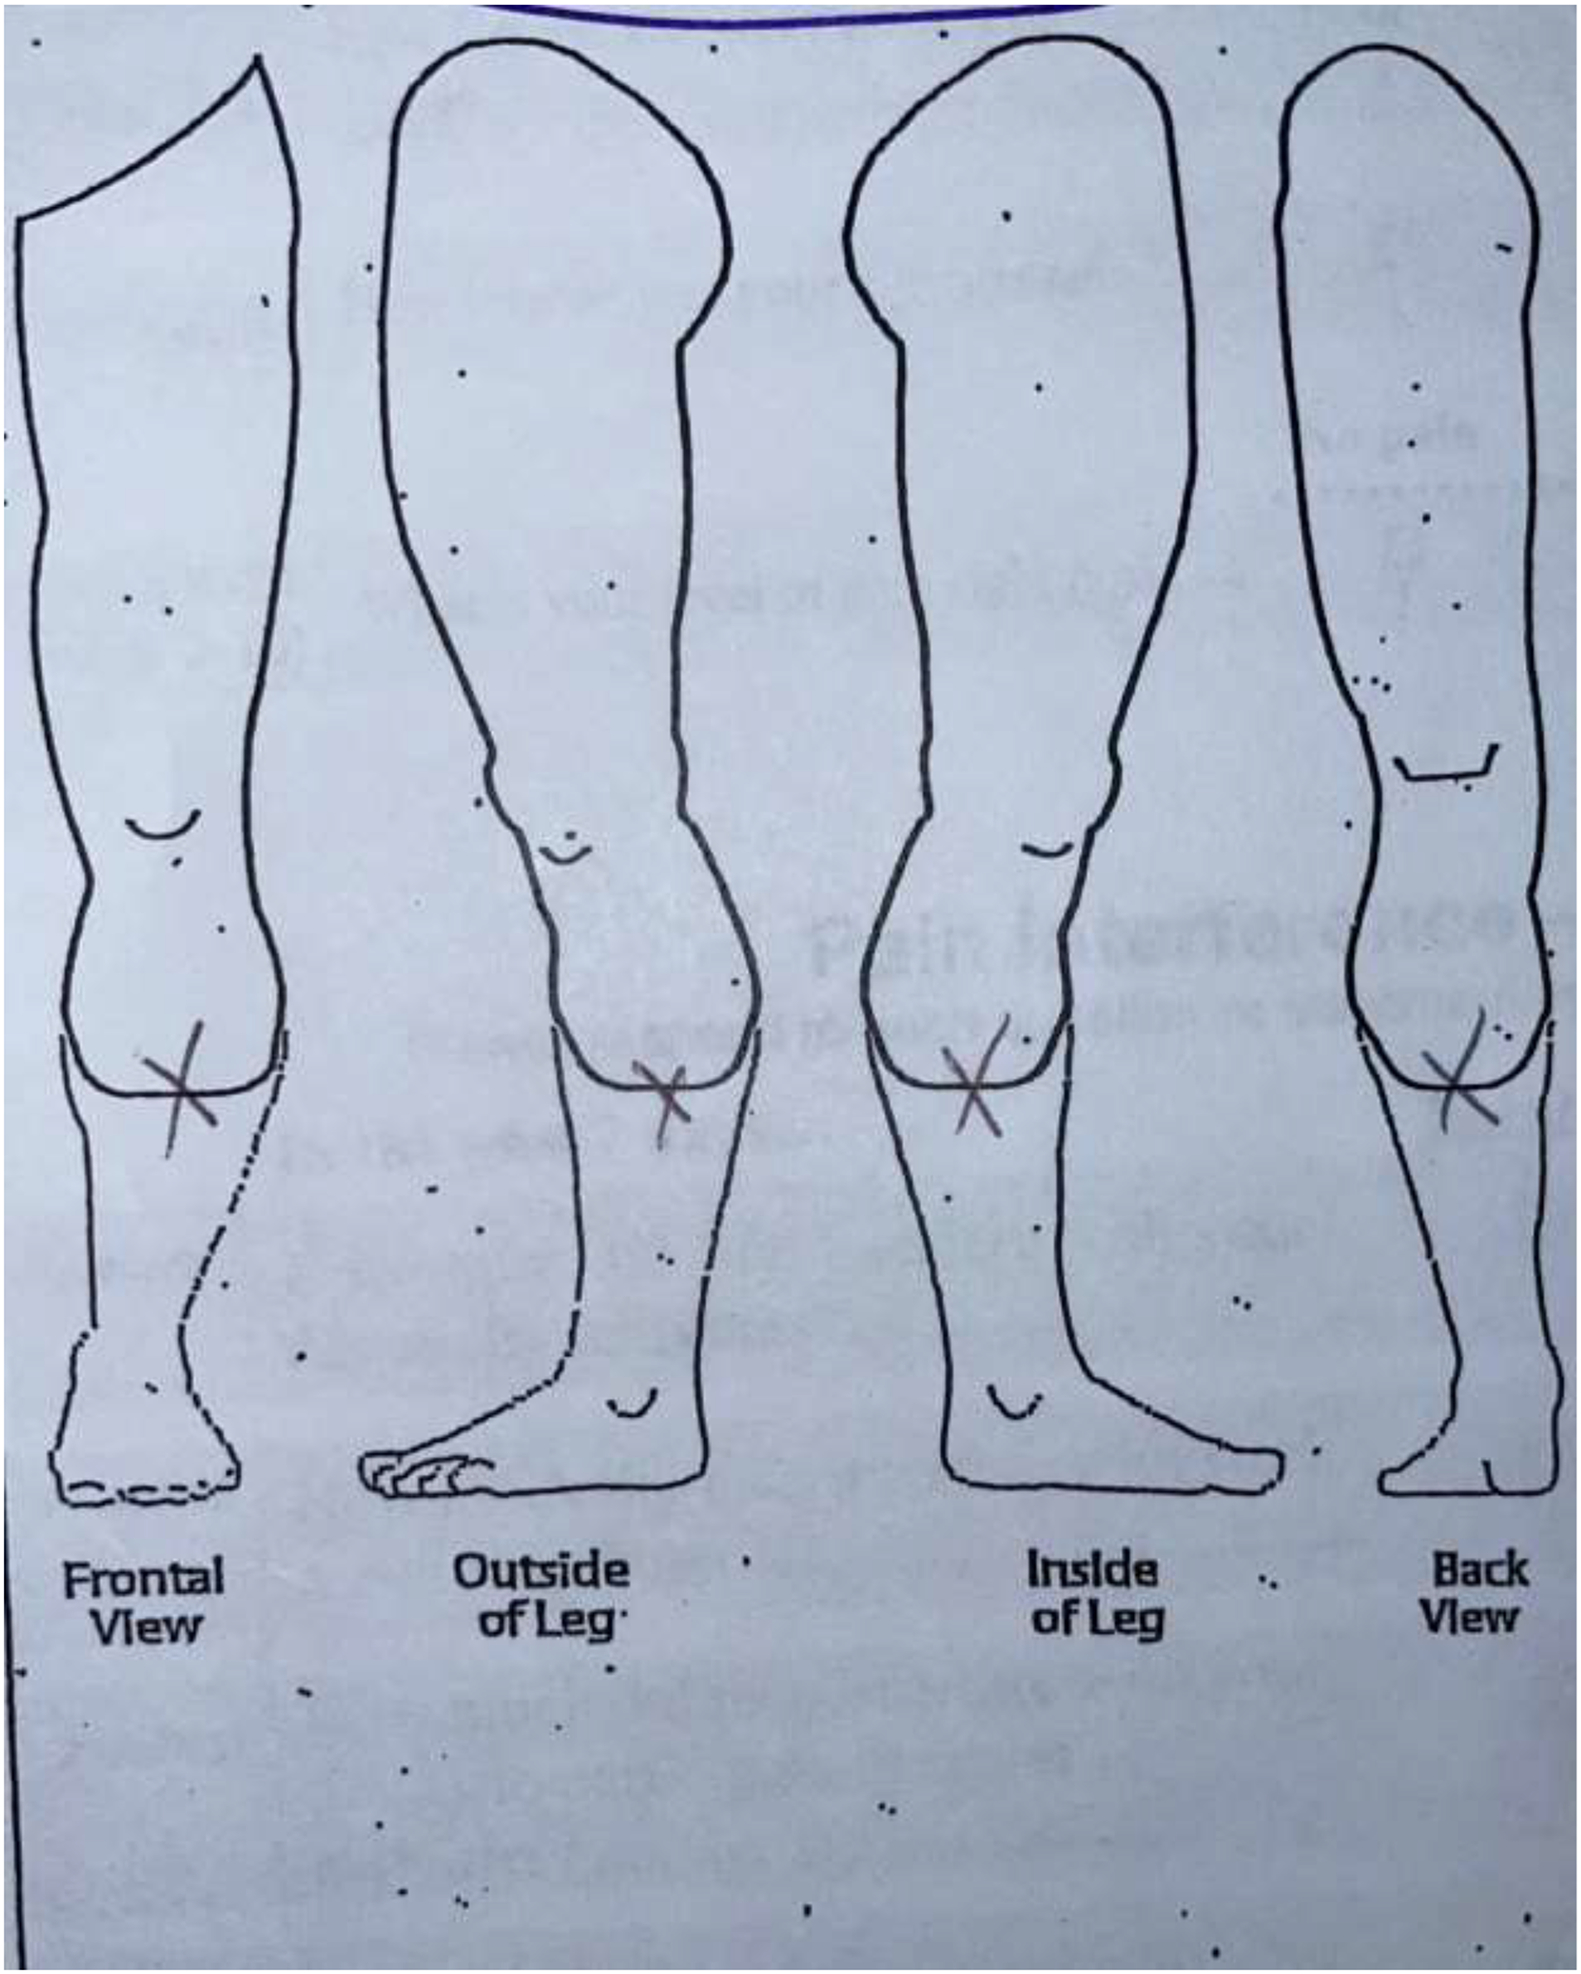
Category 1: Focal Pain (FP) sketch.
Figure 2b.
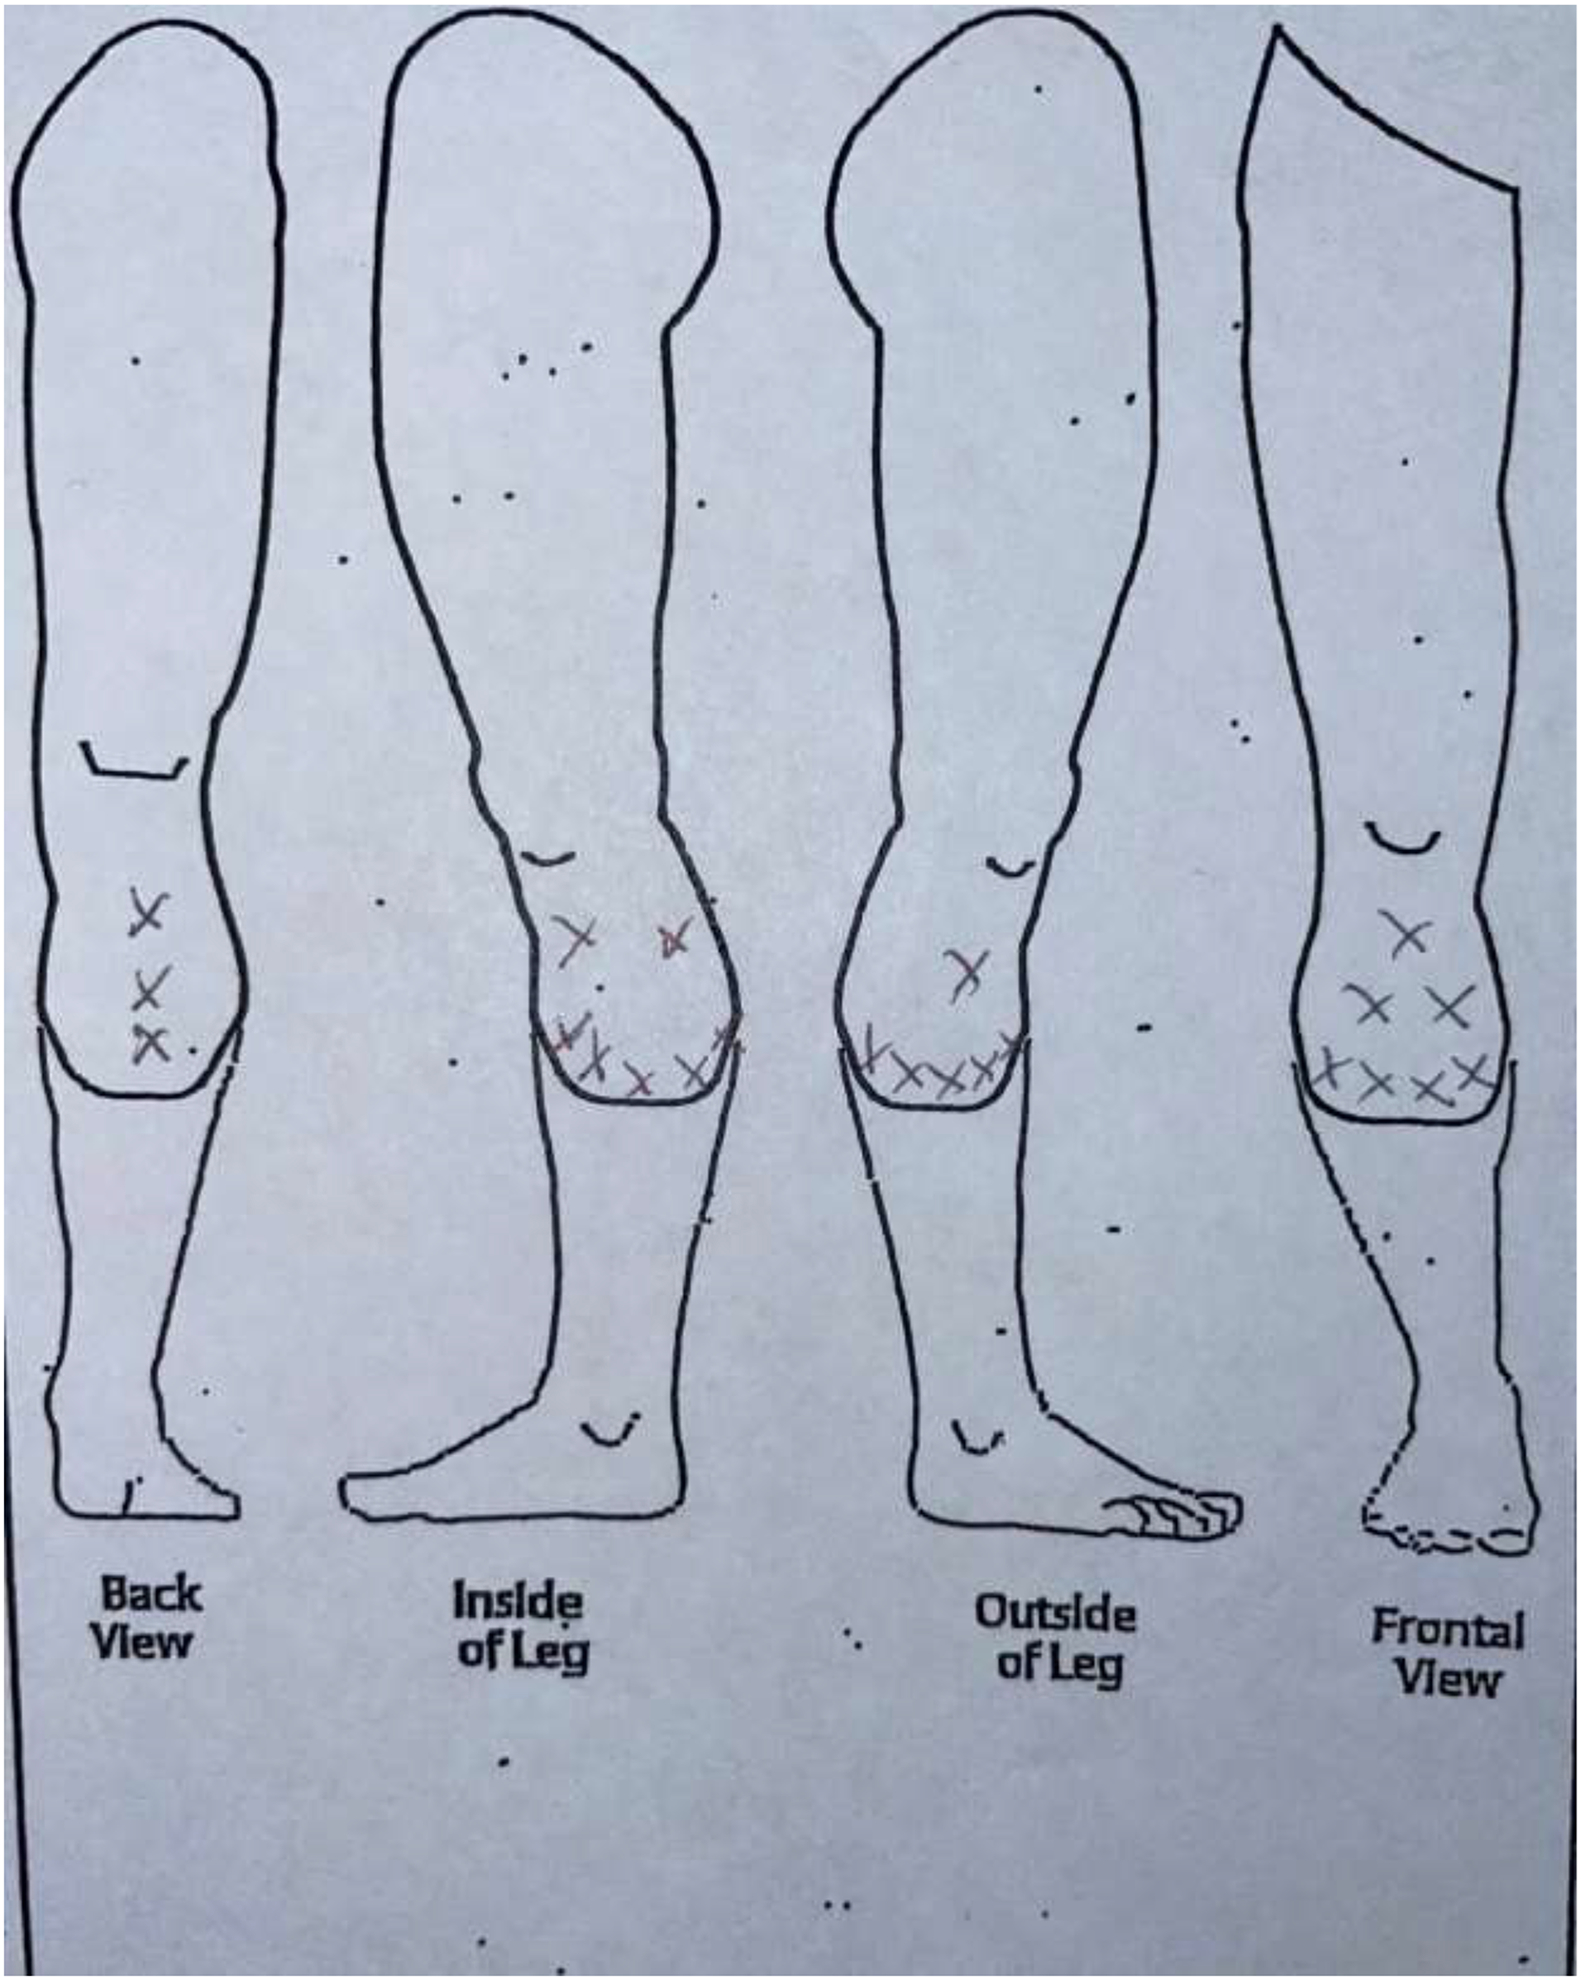
Category 2: Diffuse Pain (DP) sketch.
Figure 2c.
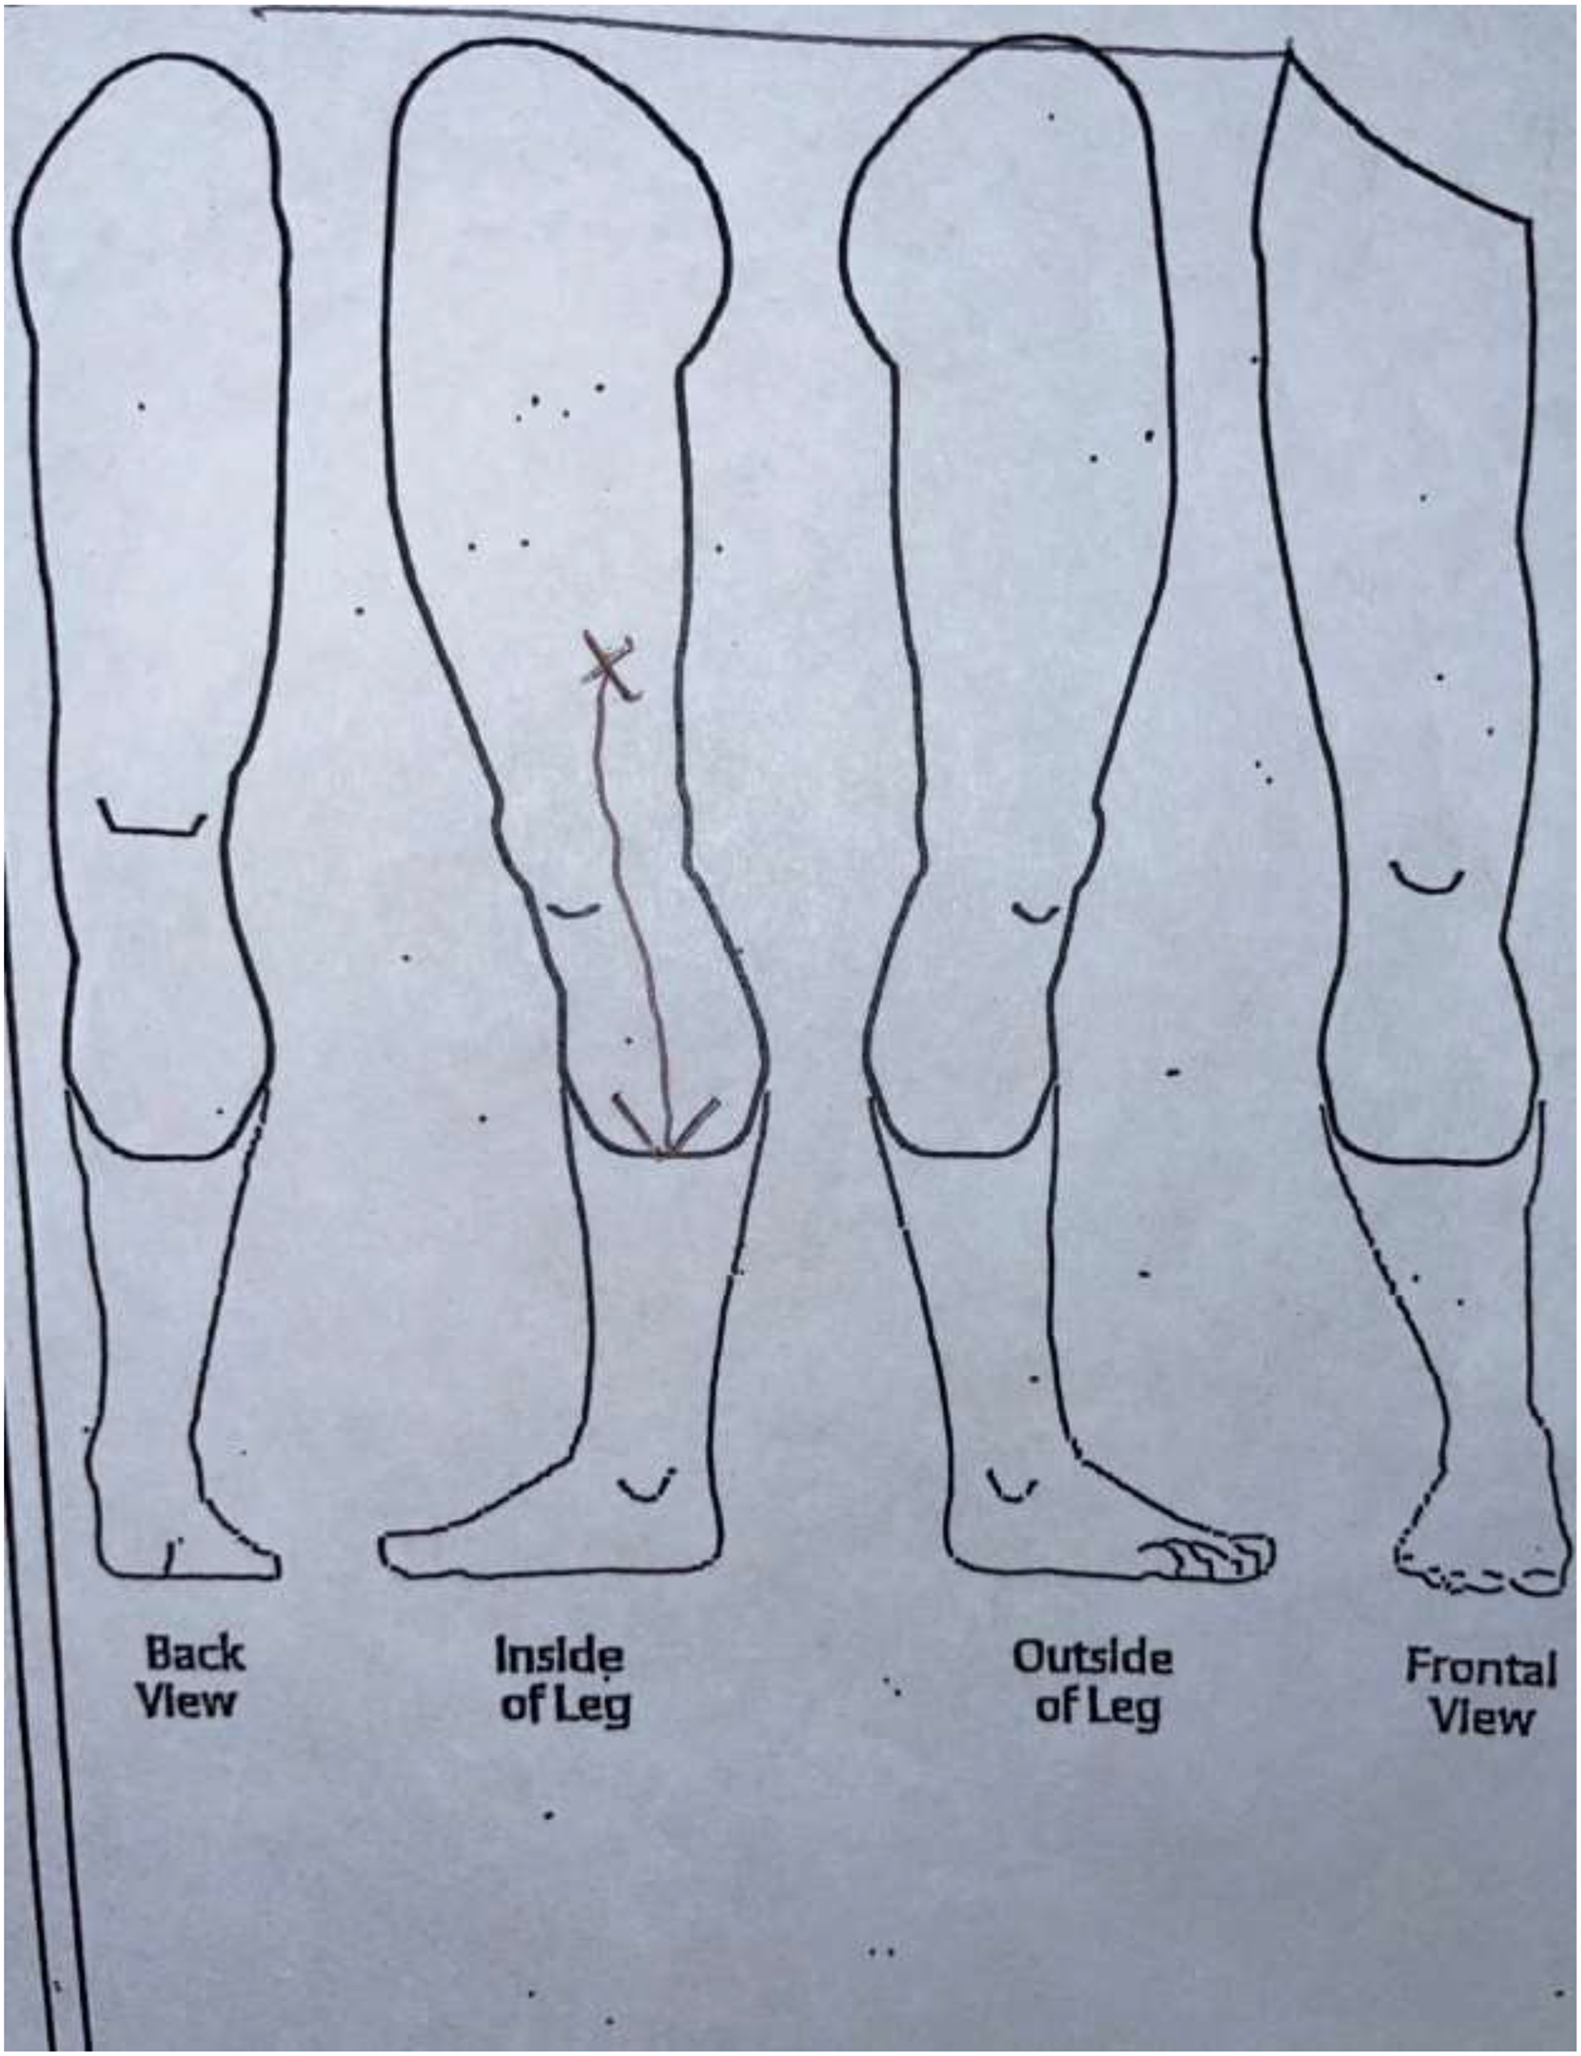
Category 3: Radiating Pain (RP) sketch.
Figure 2d.
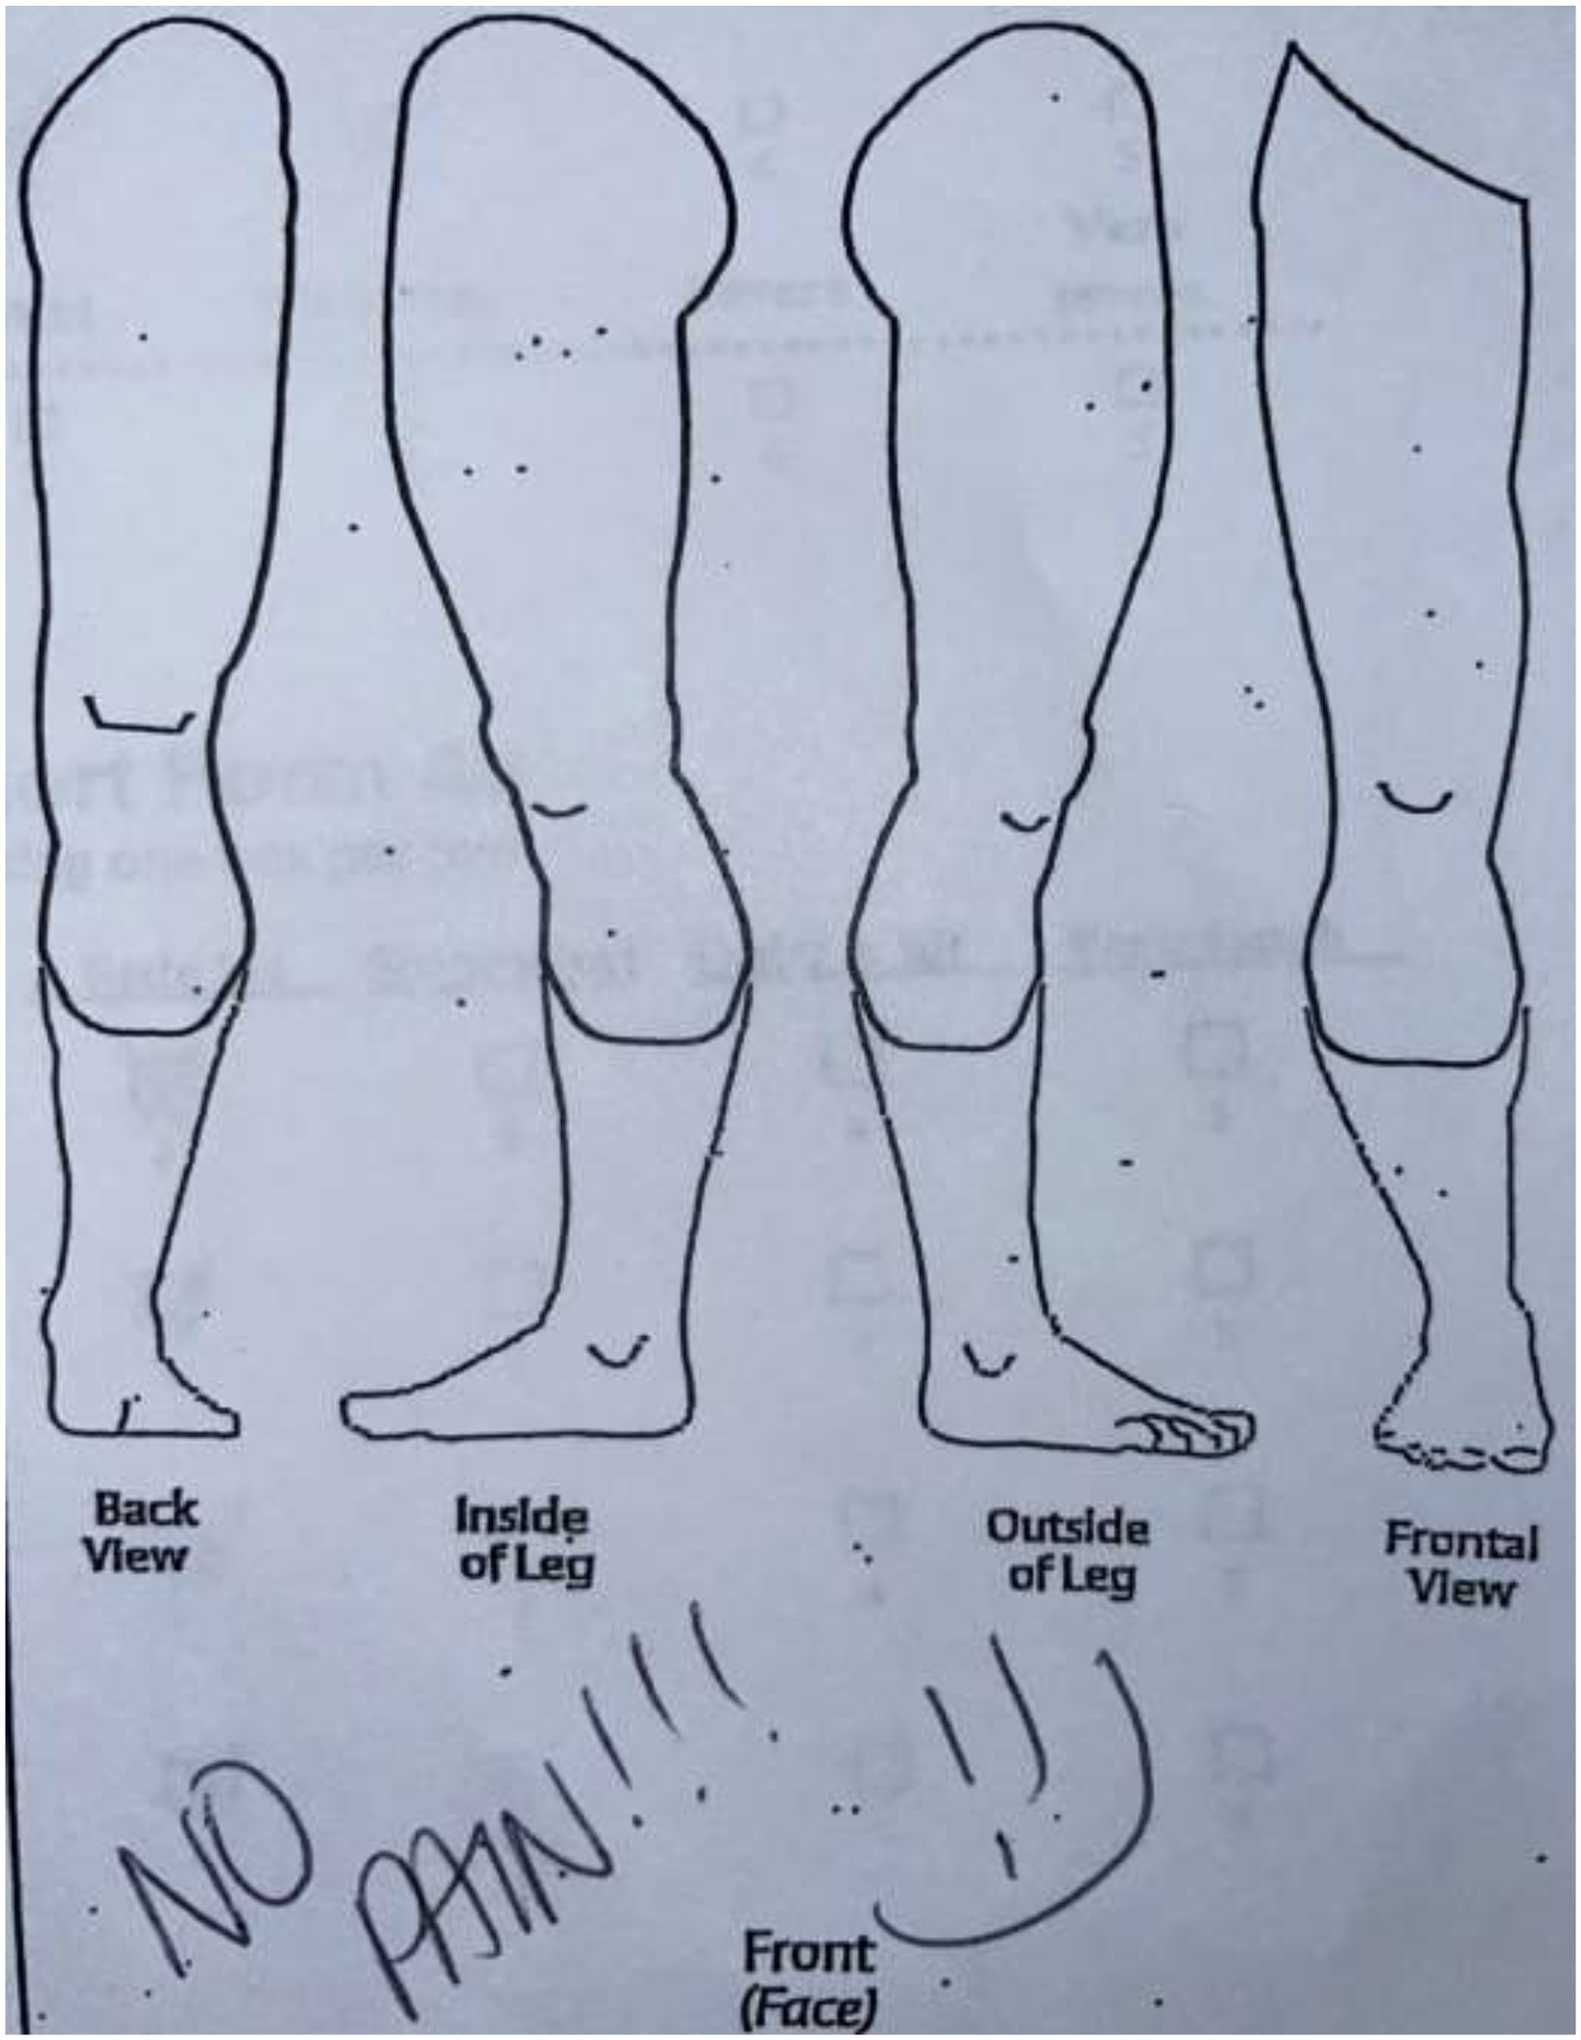
Category 4: No Pain (NP) sketch.
Part II: Sketch categories and differences in pain progression.
The second objective was to evaluate differences in postoperative pain outcomes according to the sketch categories. From the cohort of 30 patients, a subgroup of 20 patients who completed a sketch during the early postoperative period (<3 months) were included. Pain outcomes were defined based on pain scales patients completed during the postoperative period. The earlier postoperative and the most recent follow-up scores were collected for each scale. The difference between these scores was used to determine pain improvement for each sketch category. Patients in the NP category were included because some of them reported painful scores (>0.0) although they indicated having no pain on the sketch.
Pain scores were defined as the primary outcome, while PROMIS instruments were secondary outcomes measured.18,19 Primary outcomes were collected via either the Numerical Rating Scale (NRS) or the Defense & Veterans Pain Rating Scale (DVPRS). Both scales are based on a 0–10 scale where 0 indicates no pain and 10 indicates most extreme pain. The DVPRS includes emotion visualization correlating with the pain severity on the scale. The NRS and DVPRS data were synthesized for the analysis as both scales have been demonstrated to correlate well.20 Secondary outcomes were collected through Patient-Reported Outcome Measurement Information System (PROMIS) instruments, including the Pain Interference (Short Form 4a) and Pain Intensity questionnaires (Short Form 3a). A higher equates to a higher pain interference and intensity, respectively. Pain data were collected in the waiting room using tablets before the clinical evaluation. The questions were specific to neuropathic pain in the affected limb, and patients reported the scores the same day or within a few days of the date when the sketch was completed (median=0, IQR −2.5 – 0).
The timeline of the study procedure is presented in Figure 3.
Figure 3.
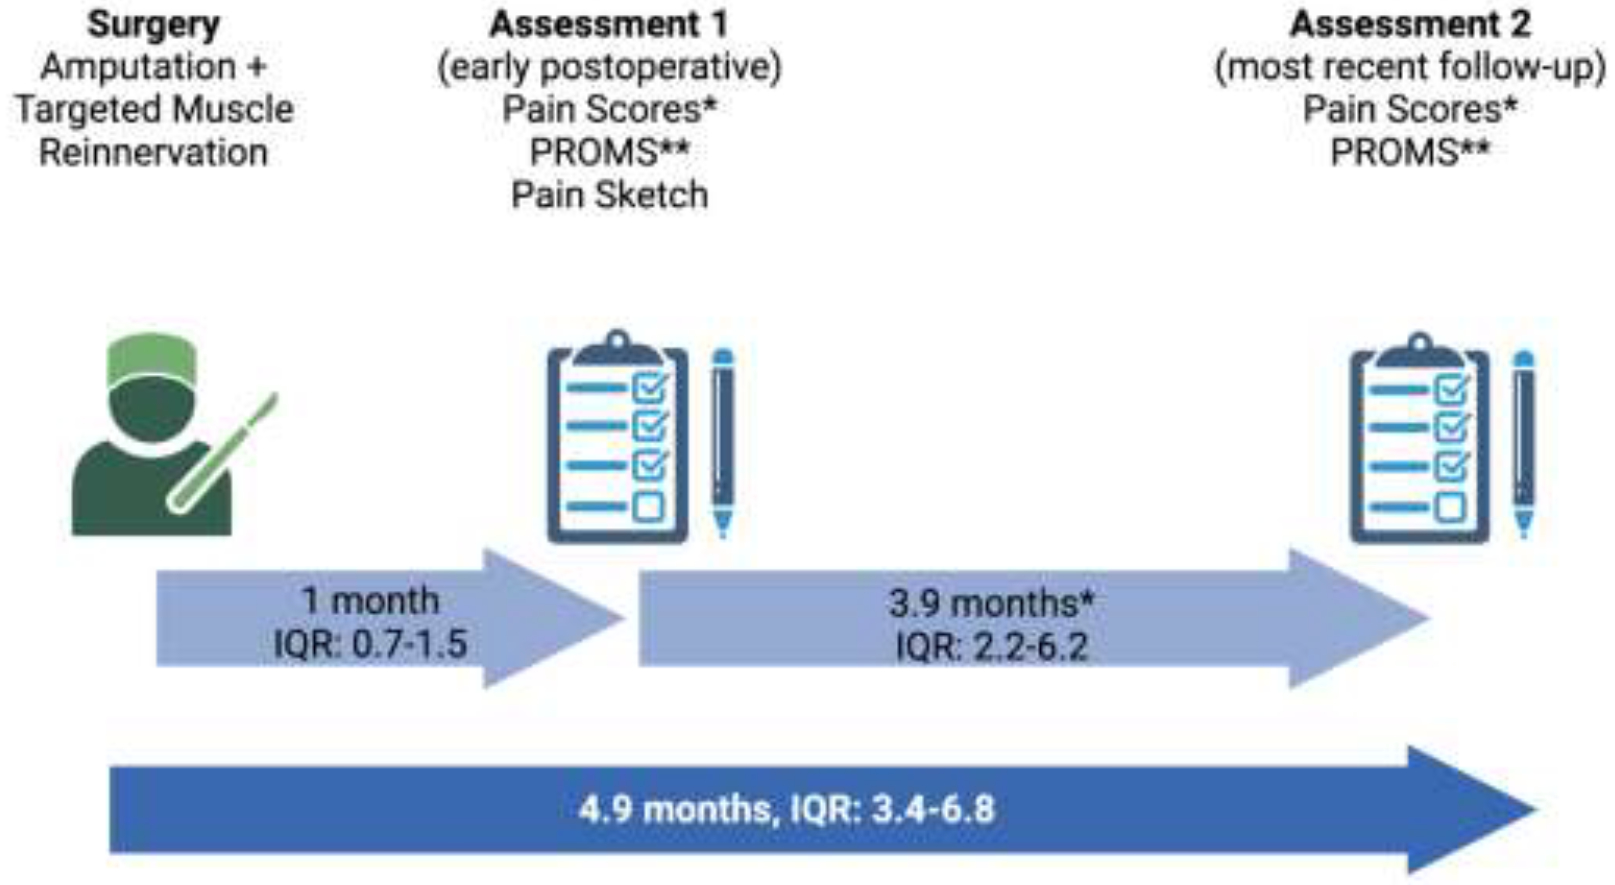
Diagram of the study procedure timeline.
*NRS/DVPRS (n=20), **PROMIS Pain Interference and Pain Intensity (n=15).
(Created with BioRender.com)
For the primary outcome, improvement was defined based on the minimal clinically important difference (MCID), described as a decrease of three or more points between the first and follow-up score.21 For PROMIS instruments, the MCID has been reported as 2–3 points for Pain Interference and 5–6 points for Pain Intensity.22,23 These values were determined in patient populations with chronic low back pain, chronic hip and knee pain and neck pain not necessarily specific to neuropathic pain, so no MCID was set for the secondary outcome.
Continuous variables were reported as medians with interquartile ranges (IQR) or means with standard deviation (SD), and categorical variables as frequencies with percentages.
Results
Part I: Sketch categories and reliability.
In the first part of the study, 30 patients who underwent primary TMR were included. Twenty-four patients underwent amputation and TMR simultaneously. For the remaining 6 patients, the median time between amputation and TMR was 6 days (IQR 2–8). Patients′ demographics and treatment characteristics are listed in Table 1. Four members of the ICAN team classified the sketches in each of one of the four categories by blinded assessment. After analysis, an overall Kappa coefficient of 0.8 was obtained, which corresponded to a strong level of agreement between raters.17 The NP category had the highest Kappa coefficient (1.0), followed by the FP, DP, and RP categories (0.7). Out of the 30 patients, 10 patients (33%) drew sketches that were congruent with FP, 8 (27%) reported NP, 7 (23%) reported DP and 5 (17%) reported a RP pattern.
Table 1:
Baseline characteristics
| Variable (n=30) |
Patient Level | |
|---|---|---|
| Age in years, mean (SD) | 50 | (2.8) |
| Male, n (%) | 17 | 56% |
| Race/ethnicity | ||
| Caucasian, n (%) | 27 | 90% |
| Hispanic/Latino, n (%) | 1 | 3% |
| Not reported, n (%) | 2 | 7% |
| Smoker, n (%) | 4 | 13% |
| Diabetic, n (%) | 6 | 20% |
| History of chronic pain, n (%) | 15 | 50% |
| Psychiatric comorbidity, n (%) | 12 | 40% |
| Medication at time of evaluation | ||
| Against neuropathic pain and opioids, n (%) | 12 | 40% |
| Against neuropathic pain or opioids, n (%) | 9 | 30% |
| No medication against neuropathic pain or opioids, n (%) | 9 | 30% |
| Limb | ||
| Level | ||
| Location of Limb and amputation type | ||
| Lower limb; BKA*, n (%) | 22 | 73% |
| Lower limb; AKA**, n (%) | 5 | 17% |
| Upper limb; Transradial, n (%) | 2 | 7% |
| Upper limb; Transhumeral, n (%) | 1 | 3% |
| Indication for amputation | ||
| Trauma, n (%) | 13 | 43% |
| Infection, n (%) | 8 | 27% |
| Cancer, n (%) | 5 | 17% |
| Other, n (%) | 3 | 10% |
| Vascular, n (%) | 1 | 3% |
| Number of nerves treated, median (IQR) | 4 | (3–5) |
Below-Knee Amputation,
Above-Knee Amputation
Part II: Sketch categories and differences in pain progression.
Twenty patients from the initial cohort met the criteria to be included in this second analysis. The median time between the TMR and the postoperative sketch, the earlier and follow-up scores for the primary outcome, and the median follow-up time from TMR are presented in figure 3. Per sketch category, the median follow-up time from TMR was 6.1 months (IQR 4.5–9.2) in the FP, 5.6 months (IQR 3.9–6.7) in the NP, 5.9 months (IQR 3.5–8.4) in the RP and 3.7 months (IQR 2.9–5.0) in the DP category.
Primary outcome (NRS/DVPRS)
From all the 20 patients who reported pain scores at the early postoperative and follow-up periods, 8 patients were in the FP category, 6 in the DP, 4 in the NP and 2 in the RP category. Although a pain score of 0.0 would be expected for patients who indicated not having pain on the sketch, three patients reported scores indicating pain (>0.0). One patient in the NP category and one in the DP category reported pain scores of 0.0 at both periods. The remaining patients in the NP category, 3 patients (50%) in the DP and 3 (38%) in the FP category improved three or more NRS/DVPRS points over time. We did not observe improvement of three or more NRS/DVPRS points for patients in the RP category.
Out of 20 patients, 9 patients (45%) were pain-free (NRS/DVPRS=0.0) at their most recent follow-up. The change in pain scores did not differ significantly between sketches categories. Pain scores mean per sketch category at early postoperative and follow-up periods and the mean score change for patients-reported primary outcomes are represented in Figure 4.
Figure 4.
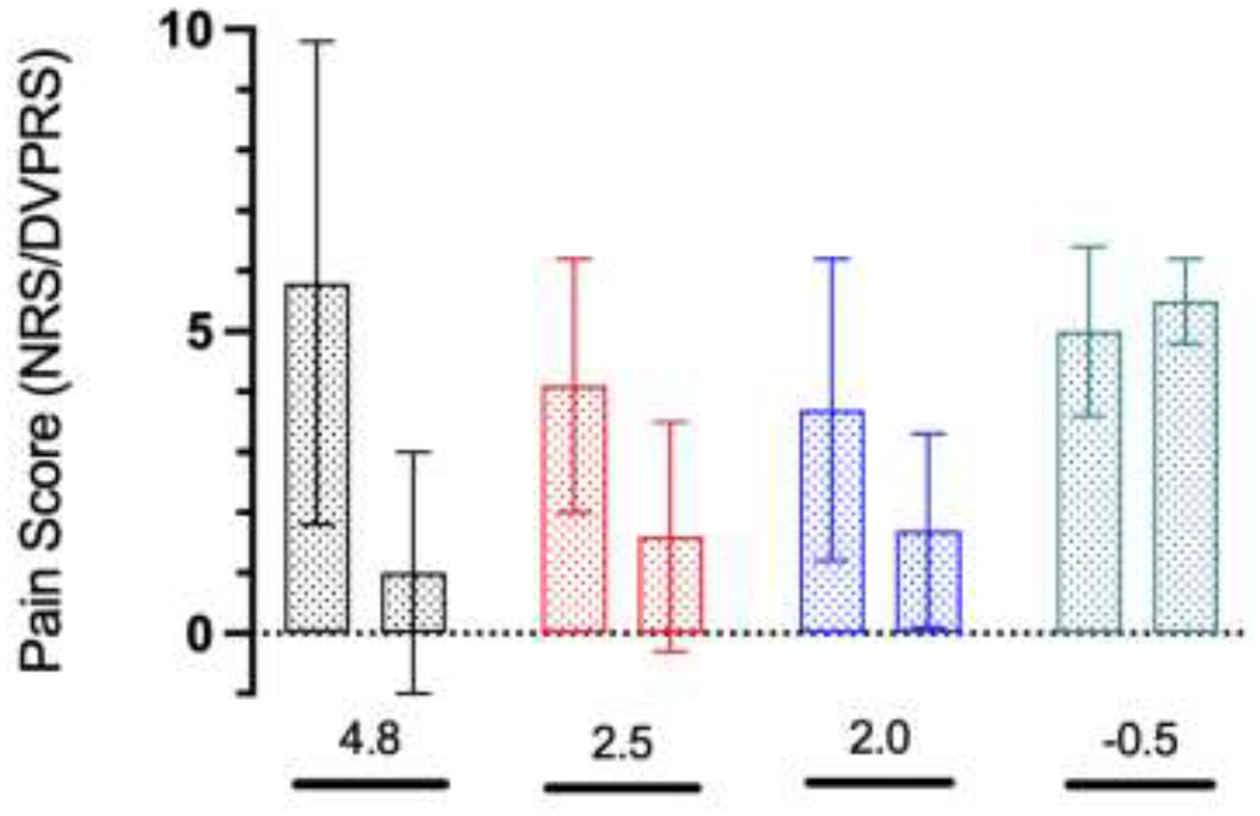
Pain scores per sketch category at early postoperative and follow-up periods, mean (SD)
black bar: No Pain (n=4), red bar: Diffuse (n=6), blue bar: Focal (n=8), green bar: Radiating (n=2)
*Mean score change
(GraphPad Prism version 9.5.1 for macOS, GraphPad Software, San Diego, California USA, www.graphpad.com).
Secondary outcome (PROMIS Pain Interference and Pain Intensity)
The secondary outcome was analyzed for the 15 patients who reported PROMIS instruments. Of them, 8 patients were in the FP category, 5 in the DP and 2 in the RP category. The secondary outcome for the NP category was not reported due to the low response rate (25%). The median time between scores was 2.4 months (IQR 1.7 – 4.3). PROMIS Pain Interference and Pain Intensity mean per sketch category at early postoperative and follow-up periods and the mean score change for patients-reported secondary outcomes are represented in Figures 5 and 6, respectively.
Figure 5.
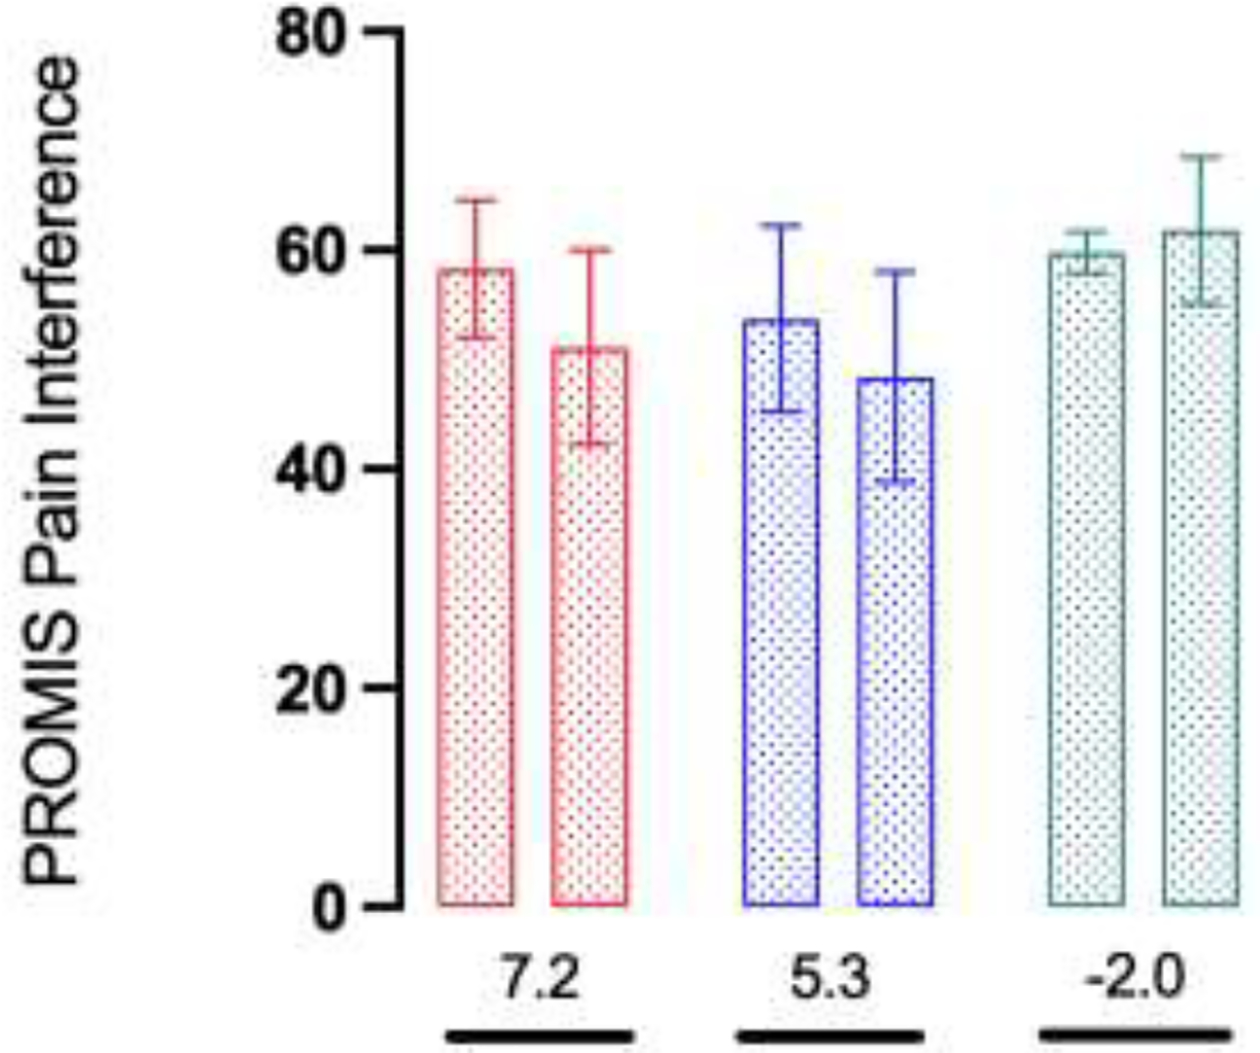
PROMIS pain scores per sketch category at early postoperative and follow-up periods, mean (SD)
red bar: Diffuse (n=5), blue bar: Focal (n=8), green bar: Radiating (n=2)
*Mean score change
(GraphPad Prism version 9.5.1 for macOS, GraphPad Software, San Diego, California USA, www.graphpad.com).
Figure 6.
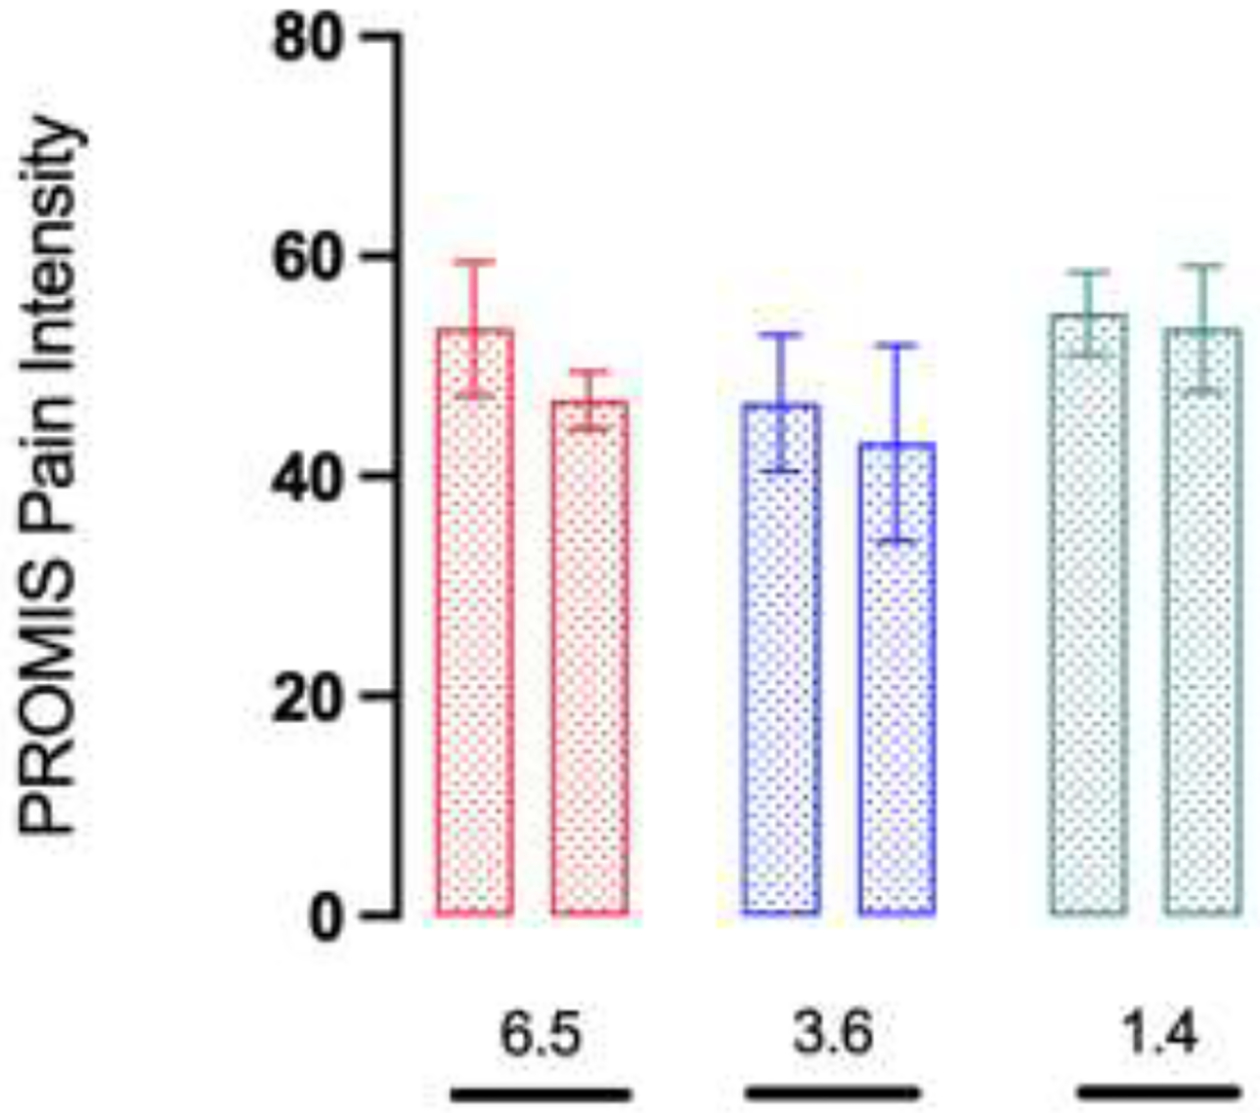
PROMIS pain scores per sketch category at early postoperative and follow-up periods, mean (SD)
red bar: Diffuse (n=5), blue bar: Focal (n=8), green bar: Radiating (n=2)
*Mean score change
(GraphPad Prism version 9.5.1 for macOS, GraphPad Software, San Diego, California USA, www.graphpad.com).
Discussion
Pain experienced by residual limb patients has been found to be highly patient-dependent, and its interpretation to guide diagnosis and treatment has remained challenging. While certain pain measurement tools have been validated and globally accepted methods for use in clinical practice, they do not assess qualitative aspects of pain which may be an important contribution during the informed decision-making process.24,25 Other validated and non-validated tools have added items to improve their performance but required clinical examination items often decrease ease and likelihood of scale completion.26 Moreover, the lack of a gold standard metric for pain assessment has justified the introduction of new tools to improve the performance of the existing scales.25 Pain sketches’ internal validation was the first step and the primary objective of this study. Four categories representing pain distribution were defined and demonstrated consistency across the physicians who blindly assessed the sketches. Pain sketches were determined to be reliable in this setting, and they were easy and efficient to apply. Patients completed the form in less than 5 minutes, and the veracity of the findings may obviate aspects of the clinical examination. Moreover, pain sketches have the potential to be categorized into different patterns of pain distribution. They elucidate qualitative characteristics of pain that can be a valuable supplement to track pain in these patients.
For this reason, we analyzed the progression of postoperative pain in a subgroup of patients who completed a sketch at the early postoperative period (< 3 months). Although high variability between patients might be associated with the tissue healing process, the average time between the amputation and onset of nerve-related pain has been reported to be around 11.6 weeks.27 For these patients, involved nerves had not regenerated completely, and the effect of TMR was not yet manifest. For these patients, involved nerves had not regenerated completely, and the effect of TMR was not yet manifest. Previous studies with a minimum follow-up time of 3 months reported lower pain in TMR patients compared to traditional amputees based on numerical pain scales.5,9,28,29 The scores reported in TMR patients are similar to those reported for patients in the NP, DP, and FP categories and differ from those reported in the RP category.5,13 This finding shows the potential of pain sketches in differentiating pain experienced by patients and complementing numerical scores with a qualitative description of pain.
For the secondary outcome, our results demonstrated pain improvement for the DP and FP categories. For the RP category, PROMIS Pain Interference and Pain Intensity were not congruent. One reason might be that PROMIS instruments analyze different aspects of living with pain that could tend toward variable changes over time.2 A limitation of analyzing the secondary outcome in the NP category could be improved with a larger sample size.
There are potential hypotheses for the differences in the progression of pain among patients in each sketch category. Patients in the NP category may have intermittent painful sensations that were not present or not easy to perceive and represent on the sketch. This finding could be the reason why some patients reported pain scores of >0.0 but wrote “no pain” on the sketch. Regardless, the authors believe it is reasonable to include the NP patients in the analysis, since they are a considerable group within the total cohort. Future studies should investigate whether similar sketches can achieve comparable results and determine whether additional instructions or sketch categories will improve pain assessment in these patients.
We hypothesized that pain in the form of PLP and RLP is mainly embodied by the DP and FP categories. All the sketches that resemble PLP in which patients represented pain in the limb no longer present were included in these categories. Previous studies comparing TMR, and general amputee cohorts demonstrated less PLP and RLP after TMR, which might explain the improvement of pain observed in these categories after primary TMR.5,9,28,29
Pain scores from patients in the FP category remained higher compared to those of the NP and DP categories. One reason for this finding could be that the focal area they marked in the sketch had a distinct source of pain (i.e., mechanical) for which TMR had limited effect.
Radiating pain may arise from nerve entrapment, root avulsion, or radiculopathy, and is not often typical of neuroma-related pain.24 Patients in the RP category underwent limb salvage procedures secondary to open fractures, extensive tissue damage, and infection. A potential explanation for such patients developing radiating pain might be intraneural changes and edema along the nerve (i.e., double crush phenomenon) that TMR was not able to completely address.
These findings reinforce the benefit of introducing tools for pain morphology assessment. Further studies using amputee databases are being conducted to determine the progression of pain in patients with longstanding major limb amputations and different pain morphologies.
Prior literature supports the limitation of self-reported pain scores in reporting pain outcomes in this setting.2,9–11 Such scores typically represent a snapshot, and may change over the course of hours or days after the reported score. While the authors agree that pain is highly subjective, this limitation is difficult to overcome. Furthermore, the lack of a gold standard method supports our proposal that pain sketches should be considered a pre- and postoperative pain assessment parameter.
A previous study reported factors related to neuropathic pain following lower extremity amputation.30 Our sample size limited a subgroup analysis based on these factors that would reduce confounders. However, given the good inter-rater reliability of the sketches, the concept can be applied to larger cohorts allowing statistical inferences regarding pain morphology in residual limb patients.
Pain sketches are an important adjunctive tool utilized for pain assessment and patient education in our ICAN program, while aiding patients in expressing complex pain conditions. A specific pain distribution within an anatomical location could aid in better defining and reporting pain outcomes. The topic of pain sketches has been reported in recent studies by Gfrerer et al. (for headaches and migraines) and Hüllemann et al. (for radiculopathies). These studies evaluated the use of pain sketches to describe pain patterns and guide treatment.14,15 These observations reinforce the benefit of introducing new modalities for nerve-related pain disorders assessment. Next to quantifying pain using numerical scales, sketches may enhance pain interpretation and guide management. Adding objective data (e.g., X-rays, magnetic resonance imaging findings) to guide surgery and identify potential sources of pain needs to be explored.
Conclusions
This study reported the application of pain sketches in distinguishing among various pain morphologies with good interrater reliability in a cohort of patients who underwent primary TMR. The differences in pain progression observed in patients within different sketch categories demonstrated the ability of this modality to complement unidimensional (e.g., NRS) and multidimensional (e.g., PROMs) numerical scales for pain evaluation. Future studies with larger sample sizes could analyze and externally validate the value of pain sketches to benefit a broader population of patients (e.g., secondary TMR, non-amputee) with nerve-related pain.
Acknowledgements:
We thank Andy Park for creating the illustrations of the pain sketches. Gomez-Eslava et al. TMR Patients Pain Sketches
Statement of Funding:
This work was in part supported by the Jesse B. Jupiter /Wyss Medical Foundation Endowment. The funder was not involved in the designing, conducting, writing, or decision to publish this study and its manuscript.
Footnotes
Financial Disclosure Statement: Following the PRS Conflict of Interest Disclosure Guidelines, The authors have the following to disclose: Dr. Eberlin is a consultant for AxoGen, Checkpoint and Integra. Dr. Valerio is a consultant for AxoGen, Checkpoint, and Integra. Dr. Heng is a consultant for Zimmer-Biomet, Inc. The other authors have no financial interest to declare.
References
- 1.Smith DG, Ehde DM, Legro MW, Reiber GE, del Aguila M, Boone DA. Phantom limb, residual limb, and back pain after lower extremity amputations. Clin Orthop Relat Res. 1999;(361):29–38. doi: 10.1097/00003086-199904000-00005 [DOI] [PubMed] [Google Scholar]
- 2.Dumanian GA, Potter BK, Mioton LM, et al. Targeted Muscle Reinnervation Treats Neuroma and Phantom Pain in Major Limb Amputees: A Randomized Clinical Trial. Ann Surg. 2019;270(2):238–246. doi: 10.1097/SLA.0000000000003088 [DOI] [PubMed] [Google Scholar]
- 3.Hsu E, Cohen SP. Postamputation pain: epidemiology, mechanisms, and treatment. J Pain Res. 2013;6:121–136. doi: 10.2147/JPR.S32299 [DOI] [PMC free article] [PubMed] [Google Scholar]
- 4.Bowen JB, Wee CE, Kalik J, Valerio IL. Targeted Muscle Reinnervation to Improve Pain, Prosthetic Tolerance, and Bioprosthetic Outcomes in the Amputee. Adv Wound Care (New Rochelle). 2017;6(8):261–267. doi: 10.1089/wound.2016.0717 [DOI] [PMC free article] [PubMed] [Google Scholar]
- 5.Valerio IL, Dumanian GA, Jordan SW, et al. Preemptive Treatment of Phantom and Residual Limb Pain with Targeted Muscle Reinnervation at the Time of Major Limb Amputation. J Am Coll Surg. 2019;228(3):217–226. doi: 10.1016/j.jamcollsurg.2018.12.015 [DOI] [PubMed] [Google Scholar]
- 6.Eberlin KR. Invited Commentary Targeted Muscle Reinnervation: A Significant Advance in the Prevention and Treatment of Post-Amputation Neuropathic Pain. J Am Coll Surg. 2019;228(3):226–227. doi: 10.1016/j.jamcollsurg.2018.12.008 [DOI] [PubMed] [Google Scholar]
- 7.Lans J, Groot OQ, Hazewinkel MHJ, et al. Factors Related to Neuropathic Pain following Lower Extremity Amputation. Plast Reconstr Surg. 2022;150(2):446–455. doi: 10.1097/PRS.0000000000009334 [DOI] [PMC free article] [PubMed] [Google Scholar]
- 8.Ziegler-Graham K, MacKenzie EJ, Ephraim PL, Travison TG, Brookmeyer R. Estimating the prevalence of limb loss in the United States: 2005 to 2050. Arch Phys Med Rehabil. 2008;89(3):422–429. doi: 10.1016/j.apmr.2007.11.005 [DOI] [PubMed] [Google Scholar]
- 9.Souza JM, Cheesborough JE, Ko JH, Cho MS, Kuiken TA, Dumanian GA. Targeted muscle reinnervation: a novel approach to postamputation neuroma pain. Clin Orthop Relat Res. 2014;472(10):2984–2990. doi: 10.1007/s11999-014-3528-7 [DOI] [PMC free article] [PubMed] [Google Scholar]
- 10.Kuiken TA, Barlow AK, Hargrove L, Dumanian GA. Targeted Muscle Reinnervation for the Upper and Lower Extremity. Tech Orthop. 2017;32(2):109–116. doi: 10.1097/BTO.0000000000000194 [DOI] [PMC free article] [PubMed] [Google Scholar]
- 11.O’Brien AL, Jordan SW, West JM, Mioton LM, Dumanian GA, Valerio IL. Targeted Muscle Reinnervation at the Time of Upper-Extremity Amputation for the Treatment of Pain Severity and Symptoms. J Hand Surg Am. 2021;46(1):72.e1–72.e10. doi: 10.1016/j.jhsa.2020.08.014 [DOI] [PubMed] [Google Scholar]
- 12.Hoyt BW, Gibson JA, Potter BK, Souza JM. Practice Patterns and Pain Outcomes for Targeted Muscle Reinnervation: An Informed Approach to Targeted Muscle Reinnervation Use in the Acute Amputation Setting. J Bone Joint Surg Am. 2021;103(8):681–687. doi: 10.2106/JBJS.20.01005 [DOI] [PubMed] [Google Scholar]
- 13.Mioton LM, Dumanian GA, Shah N, et al. Targeted Muscle Reinnervation Improves Residual Limb Pain, Phantom Limb Pain, and Limb Function: A Prospective Study of 33 Major Limb Amputees. Clin Orthop Relat Res. 2020;478(9):2161–2167. doi: 10.1097/CORR.0000000000001323 [DOI] [PMC free article] [PubMed] [Google Scholar]
- 14.Gfrerer L, Hansdorfer MA, Ortiz R, et al. Patient Pain Sketches Can Predict Surgical Outcomes in Trigger-Site Deactivation Surgery for Headaches. Plast Reconstr Surg. 2020;146(4):863–871. doi: 10.1097/PRS.0000000000007162 [DOI] [PMC free article] [PubMed] [Google Scholar]
- 15.Hüllemann P, Keller T, Kabelitz M, Freynhagen R, Tölle T, Baron R. Pain Drawings Improve Subgrouping of Low Back Pain Patients. Pain Pract. 2017;17(3):293–304. doi: 10.1111/papr.12470 [DOI] [PubMed] [Google Scholar]
- 16.Sobti N, Park A, Crandell D, et al. Interdisciplinary Care for Amputees Network: A Novel Approach to the Management of Amputee Patient Populations. Plast Reconstr Surg Glob Open. 2021;9(2):e3384. doi: 10.1097/GOX.0000000000003384 [DOI] [PMC free article] [PubMed] [Google Scholar]
- 17.McHugh ML. Interrater reliability: the kappa statistic. Biochem Med (Zagreb). 2012;22(3):276–282. [PMC free article] [PubMed] [Google Scholar]
- 18.Amtmann D, Cook KF, Jensen MP, et al. Development of A Promis Item Bank to Measure Pain Interference. Pain. 2010;150(1):173–182. doi: 10.1016/j.pain.2010.04.025 [DOI] [PMC free article] [PubMed] [Google Scholar]
- 19.Chen WH, Revicki D, Amtmann D, Jensen M, Keefe F, Cella D. Development and Analysis of PROMIS Pain Intensity Scale. Quality of life research. 2012;20(Suppl 1):18. [Google Scholar]
- 20.Sheikh S, Fishe J, Norse A, et al. Comparing Pain Intensity Using the Numeric Rating Scale and Defense and Veterans Pain Rating Scale in Patients Revisiting the Emergency Department. Cureus. 2021;13(8): e17501. doi: 10.7759/cureus.17501 [DOI] [PMC free article] [PubMed] [Google Scholar]
- 21.Farrar JT, Young JP, LaMoreaux L, Werth JL, Poole MR. Clinical importance of changes in chronic pain intensity measured on an 11-point numerical pain rating scale. Pain. 2001;94(2):149–158. doi: 10.1016/S0304-3959(01)00349-9 [DOI] [PubMed] [Google Scholar]
- 22.Chen CX, Kroenke K, Stump TE, et al. Estimating minimally important differences for the PROMIS pain interference scales: results from 3 randomized clinical trials. Pain. 2018;159(4):775–782. doi: 10.1097/j.pain.0000000000001121 [DOI] [PMC free article] [PubMed] [Google Scholar]
- 23.Purvis TE, Andreou E, Neuman BJ, Riley LH, Skolasky RL. Concurrent Validity and Responsiveness of PROMIS Health Domains Among Patients Presenting for Anterior Cervical Spine Surgery. Spine (Phila Pa 1976). 2017;42(23):E1357–E1365. doi: 10.1097/BRS.0000000000002347 [DOI] [PubMed] [Google Scholar]
- 24.Poppler LH, Mackinnon SE. The Role of the Peripheral Nerve Surgeon in the Treatment of Pain. Neurotherapeutics. 2019;16(1):9–25. doi: 10.1007/s13311-018-00695-z [DOI] [PMC free article] [PubMed] [Google Scholar]
- 25.Hjermstad MJ, Fayers PM, Haugen DF, et al. Studies comparing Numerical Rating Scales, Verbal Rating Scales, and Visual Analogue Scales for assessment of pain intensity in adults: a systematic literature review. J Pain Symptom Manage. 2011;41(6):1073–1093. doi: 10.1016/j.jpainsymman.2010.08.016 [DOI] [PubMed] [Google Scholar]
- 26.Karcioglu O, Topacoglu H, Dikme O, Dikme O. A systematic review of the pain scales in adults: Which to use? Am J Emerg Med. 2018;36(4):707–714. doi: 10.1016/j.ajem.2018.01.008 [DOI] [PubMed] [Google Scholar]
- 27.Geraghty TJ, Jones LE. Painful neuromata following upper limb amputation. Prosthet Orthot Int. 1996;20(3):176–181. doi: 10.3109/03093649609164440 [DOI] [PubMed] [Google Scholar]
- 28.Pet MA, Ko JH, Friedly JL, Mourad PD, Smith DG. Does targeted nerve implantation reduce neuroma pain in amputees? Clin Orthop Relat Res. 2014;472(10):2991–3001. doi: 10.1007/s11999-014-3602-1 [DOI] [PMC free article] [PubMed] [Google Scholar]
- 29.McNamara CT, Iorio ML. Targeted Muscle Reinnervation: Outcomes in Treating Chronic Pain Secondary to Extremity Amputation and Phantom Limb Syndrome. J Reconstr Microsurg. 2020;36(4):235–240. doi: 10.1055/s-0039-1700559 [DOI] [PubMed] [Google Scholar]
- 30.Lans J, Groot OQ, Hazewinkel MHJ, et al. Factors Related to Neuropathic Pain following Lower Extremity Amputation. Plast Reconstr Surg. 2022;150(2):446–455. doi: 10.1097/PRS.0000000000009334 [DOI] [PMC free article] [PubMed] [Google Scholar]


