

Abstract
Previous studies of the protein kinase, ERK2, using NMR and hydrogen-exchange measurements have shown changes in dynamics accompanying its activation by phosphorylation. However, knowledge about the conformational motions involved is incomplete. Here, we examined ERK2 using long conventional molecular dynamics (MD) simulations starting from crystal structures of phosphorylated (2P) and unphosphorylated (0P) forms. Individual trajectories were run for (5 to 25) μs, totaling 727 μs. The results show unexpected flexibility of the A-loop, with multiple long-lived (>5 μs) conformational states in both 2P- and 0P-ERK2. Differential contact network and principal component analyses reveal coupling between the A-loop fold and active site dynamics, with evidence for conformational selection in the kinase core of 2P-ERK2 but not 0P-ERK2. Simulations of 2P-ERK2 show A-loop states corresponding to restrained dynamics within the N-lobe, including regions around catalytic residues. One A-loop conformer forms lasting interactions with the L16 segment, leading to reduced RMSF and greater compaction in the active site. By contrast, simulations of 0P-ERK2 reveal excursions of A-loop residues away from the C-lobe, leading to greater active site mobility. Thus, the A-loop in ERK2 switches between distinct conformations that reflect coupling with the active site, possibly via the L16 segment. Crystal packing interactions suggest that lattice contacts with the A-loop may restrain its structural variation in X-ray structures of ERK2. The novel conformational states identified by MD expand our understanding of ERK2 regulation, by linking the activated state of the kinase to reduced dynamics and greater compaction surrounding the catalytic site.
Keywords: Molecular dynamics, allostery, kinase, activation loop, ERK2
Introduction
The MAP kinases, ERK1 and ERK2, are key effectors in the MAP kinase cascade, a signaling pathway downstream of RAS that is essential for cell proliferation, differentiation, motility, and survival [27, 55]. ERKs are activated by dual phosphorylation of specific threonine and tyrosine residues on the activation loop (A-loop), both catalyzed by upstream MAP kinase kinases 1 and 2 (MKK1/2 aka MEK1/2). MKK1/2 in turn are activated by members of the RAF family of protein kinases in all cells, and by c-MOS in germ cells. The prevalence of oncogenic mutations in RAS and RAF has motivated the successful development of inhibitors towards B/C-RAF and MKK1/2 for the treatment of melanomas and other cancers. Preclinical outcomes show that ERK inhibitors are active towards cancer cells and tumors that are resistant to RAF or MKK inhibitors [17, 38]. Therefore, ERK is an important target whose mechanisms of activation are important to understand [51].
X-ray crystallographic studies of the phosphorylated (2P) and unphosphorylated (0P) states of ERK2 have provided a framework for understanding structural changes associated with kinase activation [8, 69] (Fig. 1). The largest conformational change occurs in the activation loop (A-loop), which contains the phosphorylation sites. Remodeling of the A-loop results in salt bridge interactions between pT183 and pY185 (rat ERK2 numbering throughout) and multiple Arg residues in the kinase N- and C-lobes (Fig. 1A). The reorientation of pY185 opens a proposed recognition site for proline-directed sequence motifs in ERK substrates [8], and a rearrangement of residues N-terminal to the phosphorylation sites (F181, L182) exposes a C-lobe binding site for a hydrophobic docking motif (“DEF”) found in ERK substrates and effectors[29].
Figure 1. Crystal structures of 2P-ERK2 and 0P-ERK2.
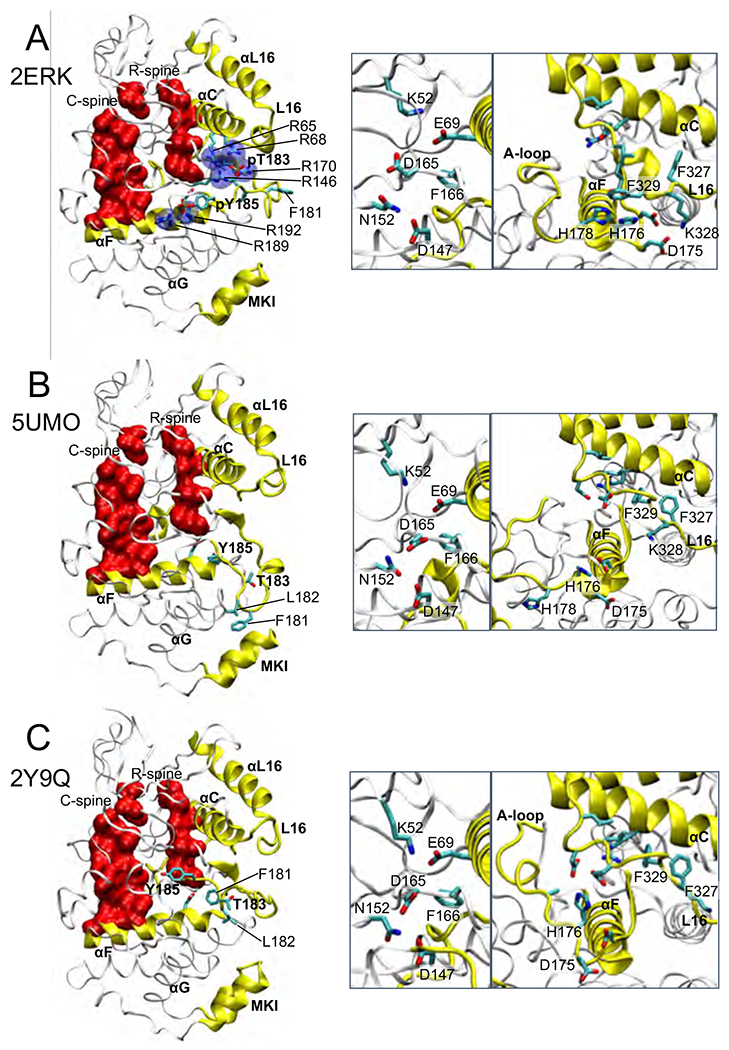
(A) The structure of the 2P-ERK2 apoenzyme, PDBID:2ERK, used as the starting state for all 2P-ERK2 simulations. (B,C) Structures of 0P-ERK2, as (B) apoenzyme, PDBID:5UMO, and (C) a peptide ligand complex, PDBID:2Y9Q, with the peptide removed, were used as starting states for 0P-ERK2 simulations. A third starting state for 0P-ERK2 used PDBID:2ERK after removing the phosphate groups from pT183 and pY185. In 2ERK, pT183 and pY185 phosphorylation sites form salt-bridges with six Arg residues (R65, R68, R146, R170, R189, R192), and side chain interactions are formed between H176 in the A-loop and F329 in the L16 segment. In 5UMO, T183, Y185, and A-loop residues F181 and L182 interact with the C-lobe. Close-up structures show (left panel) positions of active site residues that participate in catalysis, and (right panel) residue contacts between helices αC, αF, and the L16 segment.
Despite these changes in the A-loop, structural differences between the active sites in the crystal structures of 0P-ERK2 and 2P-ERK2 are minimal. This contrasts with other protein kinases, where X-ray structures reveal significant conformational shifts that commonly accompany the switch from active to inactive states [60]. These include rotation of helix αC and consequent disruption of a critical Lys-Glu salt bridge (K52-E69 in ERK2) that coordinates phosphate oxygens in ATP; a “DFG flip” backbone rotation that buries a catalytic Asp residue (D165 in ERK2) needed for Mg2+ coordination; and disrupted alignments of regulatory-spine (R-spine) and catalytic-spine (C-spine) residues involved in nucleotide binding and phosphoryltransfer [12, 24, 34, 66]. Oddly, the positions of these active site residues are largely invariant between the crystal structures of the active 2P and inactive 0P forms of ERK2. Thus, ERK2 can be considered a prototype to investigate regulatory mechanisms in kinases that do not display substantial conformational rearrangements at the active site.
Solution measurements have revealed changes in protein dynamics following ERK2 phosphorylation and activation. Studies using hydrogen-deuterium exchange mass spectrometry (HX-MS) showed that phosphorylation of ERK2 altered the rates of deuterium uptake in localized regions where X-ray structures were invariant [19]. NMR Carr-Purcell-Meiboom-Gill (CPMG) relaxation dispersion measurements of [methyl-13C,1H]-Ile, Leu and Val residues in ERK2 revealed that activation by phosphorylation led to global exchange behavior within the N- and C-lobes and surrounding the active site. This exchange was modeled by an equilibrium between two energetically similar conformational states, named “L” and “R”, that interconvert on a millisecond timescale [64]. Importantly, residues in the ERK2 A-loop were included in the global exchange, and mutations in the A-loop blocked formation of the R-state. These results suggest allosteric coupling between the A-loop and residues surrounding the active site [21]. Furthermore, different ATP-competitive inhibitors of ERK2 displayed conformational selection for the L and R states, shifting the L⇌R equilibrium in opposite directions [43, 49]. These inhibitors induced changes in HX protection within the P+1 segment adjoining the A-loop, confirming coupling from the active site to the A-loop [43]. Together, the results revealed an allosteric mechanism in 2P-ERK2, where the A-loop is not found in a single state but instead interconverts between two or more discrete states that are in turn coupled to motions at the active site. The nature of these states and how they contribute to ERK2 activation are unknown.
Inspired by this solution-phase evidence for a role of dynamics in ERK2 activation, we applied long conventional molecular dynamics simulations to characterize potential motions in ERK2 and their structural framework. The results show multiple long-lived conformations of the A-loop that have not previously been observed by crystallography. Notably, simulations of 2P-ERK2 showed settled conformations of the A-loop that formed variable interactions with the N-lobe and C-lobe, and/or altered the salt-bridges formed by the phosphorylated residues. Simulations of 0P-ERK2 showed new settled states of the A-loop that exposed the Y185 phosphorylation site to solvent. Difference contact network analysis, principal component analysis, and RMSF calculations revealed that movements of the A-loop alter the dynamics of the kinase core and active site residues. The states of 2P-ERK2 were correlated with reduced dynamics and greater compactness of the N-lobe and active site, while states of 0P-ERK2 showed greater N-lobe motions and active site disorganization. The results reveal unexpected flexibility of the A-loop, and a role of the varying conformational states for regulating active site dynamics in a phosphorylation-dependent manner.
Results
Crystal structures of 2P-ERK2 and 0P-ERK2 were used as starting models to explore the motions of the A-loop by MD. The structure of the 2P-ERK2 apoenzyme (PDBID: 2ERK) shows extensive salt-bridge contacts between pT183 and pY185 in the A-loop and Arg residues in the N- and C-lobes (Fig. 1A). In addition, side chain interactions are formed between the A-loop and L16, a C-terminal segment uniquely found in MAP kinases [39]. Following energy minimization, this structure was used as the starting model for active, phosphorylated ERK2 (2erk_2P). The structure of the 0P-ERK2 apoenzyme (PDBID: 5UMO) shows the A-loop in a folded conformation with T183 exposed and Y185 buried (Fig. 1B). Two A-loop residues, F181 and L182, contact the C-lobe in a pocket formed between helix αG and the MAP kinase insert (MKI). The latter is also unique to MAP kinases and has been shown to recognize a docking sequence motif (“docking domain for ERK2, FXF (DEF)”) found in substrates and effectors. A second X-ray structure of 0P-ERK2 complexed with a kinase interaction motif (KIM) peptide (PDBID: 2Y9Q) shows an alternative A-loop conformation, where F181 and L182 are removed from the αG-MKI DEF pocket (Fig. 1C). These were used as starting models for inactive 0P-ERK2 (5umo_0P, 2y9q_0P). A third starting model for 0P-ERK2 was constructed from 2ERK by removing the phosphates from pT183 and pY185 (2erk_0P). Each of these structures show similar positions of active site residues that participate in catalytic turnover (Fig. 1A-C). These include the K52-E69 salt bridge, which hydrogen bonds with Pα and Pβ oxygens in ATP; D165 and N152, which coordinate Mg2+ complexed with ATP; and D147, the general base for phosphoryltransfer.
Long conventional simulations between 10 μs and 25 μs (“1° seeds”) were first performed at varying temperatures. These were followed by multiple short simulations at a single temperature, typically for 5.7 μs (“2° seeds”), each started from different frames derived from 1° seed trajectories. In this way, the simulations combined complementary strategies of long trajectories from a single state, and short runs from many starting states. Nomenclature and details of runs are summarized in Table 1. The accumulated sampling times summed over all seeds reached 369.5 μs for 2P and 357.7 μs for 0P starting models, totaling 727.2 μs.
Table 1. Summary of nomenclature and trajectory sampling.
Each time listed represents that of a single trajectory. For example, 14 additional 2° seeds of 2erk_2P.pY-R65 were each 5.70 μs at 300 K.
| PDBID | State | Starting model |
1° seeds | 2° seeds (300 K) | ||||
|---|---|---|---|---|---|---|---|---|
|
| ||||||||
| T (K) | Seed | MD state | Time (μs) | No. Seeds | Time (μs) | |||
|
| ||||||||
| 2ERK | 2P | 2erk_2p | 285 | 1 | 2erk_2P.pY-R65 | 23.33 | 14 | 5.70 |
|
| ||||||||
| 300 | 1 | 2erk_2P.L16 | 26.98 | - | - | |||
|
| ||||||||
| 300 | 2 | 2erk_2P.solv | 21.60 | 16 | 5.70 | |||
|
| ||||||||
| 315 | 1 | 2erk_2P.solv | 21.58 | - | - | |||
|
| ||||||||
| 315 | 2 | 2erk_2P.solv | 19.50 | - | - | |||
|
| ||||||||
| 330 | 1 | 2erk_2P.MKI | 17.10 | 12 | 5.70 | |||
|
| ||||||||
| 5UMO | 0P | 5umo_0p | 285 | 1 | 5umo_0P.MKI | 23.69 | - | - |
|
| ||||||||
| 300 | 1 | 5umo_0P.MKI | 20.50 | - | - | |||
|
| ||||||||
| 300 | 2 | 5umo_0P.MKI | 20.10 | - | - | |||
|
| ||||||||
| 315 | 1 | 5umo_0P.MKI | 21.80 | - | - | |||
|
| ||||||||
| 315 | 2 | 5umo_0P.FL | 22.50 | 5 | 3 x 6.30 2 x 4.92 |
|||
|
| ||||||||
| 330 | 1 | 5umo_0P.MKI | 14.40 | - | - | |||
|
| ||||||||
| 2ERK | 0P | 2erk_0p | 285 | 1 | 2erk_0P.solv | 23.05 | - | - |
|
| ||||||||
| 300 | 1 | 2erk_0P.solv | 20.99 | - | - | |||
|
| ||||||||
| 2 | 2erk_0P.solv | 20.72 | - | - | ||||
|
| ||||||||
| 315 | 1 | 2erk_0P.Y-αC | 21.79 | 8 | 5.70 | |||
|
| ||||||||
| 2 | 2erk_0P.solv | 19.80 | - | - | ||||
|
| ||||||||
| 330 | 1 | 2erk_0P.solv | 14.40 | - | - | |||
|
| ||||||||
| 2Y9Q | 0P | 2y9q_0P | 300 | 1 | 2y9q_0P.F/Y | 9.90 | - | - |
|
| ||||||||
| 2 | 2y9q_0P.F/Y | 9.90 | - | - | ||||
|
| ||||||||
| 3 | 2y9q_0P.F/Y | 9.90 | - | - | ||||
|
| ||||||||
| 4 | 2y9q_0P.F/Y | 9.90 | - | - | ||||
MD simulations of phosphorylated ERK2
Novel conformational states of the A-loop
Six 1° seeds were started from 2erk_2P and run for (18 to 25) μs at 285 K, 300 K, 315 K, or 330 K (Table 1). In all runs, the A-loop (res. 170-186) deviated from the starting model within (3 to 5) μs as measured by the RMSD of Cα atoms. Typically, the RMSD of the A-loop segment increased to more than 5 Å after the simulations began and remained elevated, only rarely and transiently falling below 3 Å (Fig. 2A-D). By contrast, the rest of the kinase “core” backbone structure (res. 16-169 and 187-348) remained largely unchanged with RMSD below 2.5 Å (Fig. 2A-D). Within the initial period of each trajectory, increases in A-loop RMSD were accompanied by increased fluctuations, measured by RMSF (Fig. 2E-H). But in three 1° seeds, A-loop residues formed new intramolecular interactions with dampened fluctuations to reflect new settled conformations persisting with low RMSF for more than 5 μs (hatched lines, Fig. 2A-C, E-G). These were identified by scanning 1 μs segments of each trajectory for averaged A-loop RMSF less than 1.2 Å. This revealed three distinct “settled states” of the A-loop based on their low RMSF and long lifetimes (> 5 μs), each deviating from the 2ERK crystal structure with RMSD > 5 Å.
Figure 2. RMSD and RMSF plots identify settled states of the A-loop in 1° seed trajectories of 2P-ERK2.

Trajectories corresponding to settled states (denoted by hatched lines) for (A,E) 2erk_2P.L16 (2erk_2P 1° seed 1 at 300 K), (B,F) 2erk_2P.MKI (2erk_2P 1° seed 1 at 330 K), and (C,G) 2erk_2P.pY-R65 (2erk_2P 1° seed 1 at 285 K), as well as (D,H) a representative trajectory where no settled state is reached, 2erk_2P.solv (2erk_2P 1° seed 1 at 315 K). (A-D) Plots of RMSD calculated for Cα atoms in the A-loop (res. 170-186, colors) and kinase core (res. 16-169 and 187-348, black). (E-H) Plots of A-loop RMSF calculated for Cα atoms showing averages and standard deviations for 1 μs segments across each trajectory.
Overlays of the three settled A-loop states (colors) are shown in Fig. 3A-C alongside the 2erk_2P starting model (black). Fig. 3A illustrates the “2erk_2P.L16” conformation, so named because the A-loop moves towards the N-lobe to contact residues in the L16 segment. Here, pT183 and pY185 form salt bridges with the same Arg residues as in 2ERK. However, the N-terminal region of the A-loop deviates from 2ERK, with RMSD ~8 Å (Fig. 2A), due to replacement of side chain contacts between L16 and the A-loop of 2ERK with new contacts (Figs. 1A, 3A). In addition, F181 which is solvent-facing in 2ERK, remodels to contact L16. Such increased contacts between the A-loop and L16 may enhance the stability of the 2erk_2P.L16 fold.
Figure 3. Settled states of the A-loop in 2P-ERK2.

Overlays of A-loop conformers corresponding to settled states of (A) 2erk_2P.L16 (2erk_2P 1° seed 1, 300 K), (B) 2erk_2P.MKI (2erk_2P 1° seed 1, 330 K), (C) 2erk_2P.pY-R65 (2erk_2P 1° seed 1, 285 K), and (D) a representative trajectory with no settled A-loop state, 2erk_2P.solv (2erk_2P 1° seed 1, 315 K). Frames shown are separated by 1 μs and derived from trajectories in Fig. 2. In each panel, the A-loop backbone and pT-E-pY side chains from 2ERK are shown in black and the kinase core is shown in white. Alternative orientations in panels A-C correspond to rotation by ~90° about the vertical axis. In 2erk_2P.L16, the A-loop moves so that F181 which is solvent-facing in 2ERK remodels to contact L16 residues D335, L336, and P337, and P174 replaces H176 in contacts with F329 in L16. In 2erk_2P.MKI, F181 becomes solvent-exposed and engaged in cation-π interactions with R170, while L182 moves into a hydrophobic pocket with P174, Y203, and I207 in helix αF. In 2erk_2P.pY-R65, pY185 breaks its contacts with R189 and R192 in the P+1 loop and forms a new salt-bridge with R65 in helix αC.
The “2erk_2P.MKI” conformation, displayed in Fig. 3B, is so named by the extension of the A-loop towards the MAPK insert (MKI). Such C-lobe interactions are reminiscent of the 5UMO crystal structure (Fig. 1B), except that the pT183-Arg and pY185-Arg salt bridges are formed as in 2ERK. Like 5UMO, the A-loop forms many contacts with the P+1 segment, located between the A-loop and helix αF. However in detail, these contacts are quite different. Notably, F181 and L182, which contact helix αG and MKI in 5UMO, are displaced in 2erk_2P.MKI. Here, F181 and L182 swing away from the C-lobe, leading to solvent-exposure of F181 and movement of L182 into a hydrophobic pocket. Thus, although the A-loop in 2erk_2P.MKI superficially resembles 5UMO, its residue contacts are remodeled to accommodate the phosphorylation of T183 and Y185. Relative to 2erk_2P.L16, greater variation is seen in the pT183 and pY185 side chains of 2erk_2P.MKI, suggesting greater flexibility of the C-terminal region of the A-loop.
The 2erk_2P.pY-R65 conformation, displayed in Fig. 3C, breaks the salt-bridges between pY185 and Arg residues in the P+1 loop, allowing pY185 to move away to form a new salt-bridge with helix αC. In this settled state, the positioning of the phosphorylation motif (pT183-E184-pY185) remains stable, despite the large rotation of the pY185 sidechain. This may be assisted by internal hydrogen bonds formed within a short helical segment at the N-terminus of the A-loop.
The remaining trajectories displayed highly variable, solvent-exposed A-loop conformations (Fig. 2D,H, Fig. 3D). These were designated “2erk_2P.solv” and due to their high RMSF were not considered a distinct settled state. In the 2erk_2P.solv ensemble, pT183 and pY185 both maintained crystallographic Arg salt-bridge interactions, but with occasional side-chain excursions and a highly mobile backbone around the phosphorylation motif (Fig. 3D). Notably, 2erk_2P.solv conformers often appeared before and after each of the three settled states above. This suggests that 2erk_2P.solv constitutes an intermediary ensemble connecting the A-loop settled states.
Mapping trajectory frames to different A-loop conformational states
Multiple frames (typically separated by 300 ns) were extracted from trajectory regions corresponding to the three settled states originating from 2erk_2P. These were used as the starting configurations for “2° seed” simulations, each carried out for 5.7 μs at 300 K. The trajectories were then characterized using the collective fraction of native contacts () associated with each settled state. The term “native contacts” refers to contacts within 4.5 Å between heavy atoms in the A-loop and the kinase core. First, a single frame was selected as the reference for each settled state. Then, values were calculated for each frame across all 1° and 2° trajectories run at 300 K. These were assigned to collections of frames corresponding to each settled state, using > 0.67 as the threshold for acceptance. Any frame below the threshold for all settled states was assigned to 2erk_2P.solv (see Methods).
Fig. 4A,B shows a schematic and example of how the reference frame was selected for 2erk_2P.MKI. 2° seed 43 was chosen as the trajectory with the lowest averaged RMSD from its starting frame. The reference structure was then taken as the frame with the lowest RMSD from the average coordinates across the 2° trajectory. Similarly, reference frames were identified for 2erk_2P.L16 and 2erk_2P.pY-R65. They illustrate the different contacts made by the A-loop to the kinase core between each of the three settled states and 2erk_2P (Fig. 4C-F, red). Likewise, the numbers of contacts made by each residue showed distinct patterns between states, especially at the center of the A-loop (Fig. S1). Examples of values for trajectories are illustrated in Fig. 4G-J. They show how > 0.67 reveals the 2erk_2P.MKI settled state in a 1° seed between (2 to 7) μs and a 2° seed throughout the trajectory (Fig. 4G,H). Thus, enabled the presence of each A-loop settled state to be measured across each trajectory.
Figure 4. Selection of reference structures and plots for settled A-loop states in 2P-ERK2.

(A) Schematic approach for determining reference structures and calculating . (B) An example shows how the reference structure for 2erk_2P.MKI was identified. Coordinates were averaged over a 2° trajectory, and the representative structure was determined from the frame that had A-loop heavy atom coordinates with the lowest RMSD from the averaged coordinates. (C-E) Reference structures for each settled state of 2P-ERK2, rendering A-loop residue sidechains (licorice) and their partner atoms from the kinase core that are within 4.5 Å (red spheres). (F) Corresponding representation of the 2erk_2P starting state. (G-J) Representative trajectories plotting calculated for each 2erk_2P state shown in panels (C-F): (G) 2erk_2P 1° seed 1 at 330 K; (H) 2erk_2P 2° seed 43; (I) 2erk_2P 2° seed 42; (J) 2erk_2P 2° seed 39. and RMSD plots for all 2erk_2P 1° and 2° seed trajectories are provided in Figs. S2 and Figs. S3-S4, respectively. The number of heavy atom contacts with A-loop residues for each reference state are shown in Fig. S1.
Figs. S2, S3, and S4 show and A-loop RMSD calculations for each reference state and the 2erk_2P starting state across all 1° and 2° seed trajectories. In all 1° seeds, for 2erk_2P quickly decayed while RMSD increased, indicating rapid divergence of the A-loop away from the starting state (Fig. S2, grey). This divergence was maintained in all 2° seed trajectories (Figs. S3 and S4, grey). For the most part, there was good agreement between > 0.67 and RMSD < 2 Å in trajectory regions corresponding to settled A-loop states. However in some trajectories, RMSD was low (suggesting movements of the A-loop towards a settled state) even while fell below threshold (e.g. Fig. S2 2erk_2p.300.seed 2, gold, 8 μs to 12 μs). In other trajectories, RMSD was elevated (suggesting movement away from a settled state) even while remained high (e.g. Fig. S2 2erk_2p.285.seed 1, cyan, 13 μs to 17 μs). Thus, appeared to be a more reliable indicator of settled states of the A-loop than RMSD.
Some 1° and 2° seeds revealed switching between A-loop states. For example, decay of 2erk_2P.MKI into 2erk_2P.solv could be observed in a 1° seed and one 2° seed (Fig. 4G,I, gold), but extended over the full trajectory in 11 other 2° seeds (Figs. S3, S4 2erk_2p.300.seeds 3-10, 41, 43, 44, gold). This suggests that 2erk_2P.MKI forms transiently, but with lifetime typically greater than 5 μs. Similarly, 2erk_2P.pY-R65 was maintained for over 7 μs in a 1° seed (Fig. 2C, cyan, 16 μs to 23 μs, Fig. S2 2erk_2p.285.seed 1, cyan), and throughout each of the 2° seeds started from this state (Figs. S3, S4 2erk_2p.300.seeds 11-24, cyan). By contrast, the lifetime of 2erk_2P.L16 was greater than 25 μs across a 1° trajectory (Fig. S2 2erk_2p.300.seed 1, purple), but varied among 2° seeds, with falling below threshold in 10 of 16 cases (Figs. S3, S4, 2erk_2p.300.seeds 25-40, purple). Although in most instances, 2° seeds started from 2erk_2P.L16 decayed to 2erk_2P.solv, in two trajectories the decay was followed by formation of 2erk_2P.pY-R65 (Fig. 4J, purple/cyan; Figs. S3, S4, 2erk_2p.300.seeds 27, 39, purple/cyan). Together, the results show that 2erk_2P.MKI, 2erk_2P.pY-R65, and 2erk_2P.L16 are all thermally accessible and populated in solution, with evidence for transitions to 2erk_2P.solv and between settled states.
Difference contact network analysis reveals variations in the kinase core with A-loop state
Difference contact network analysis (dCNA) was applied in order to determine how other regions of the kinase respond to variations between A-loop conformations. First, A-loop conformational ensembles were accumulated from 1° and 2° seed trajectories run at 300 K using the > 0.67 threshold for each settled state, and assigning frames to 2erk_2P.solv when < 0.67. Next, contact probability matrices were calculated as the fraction of frames in each ensemble with contacting residues, defined by two heavy atoms within 4.5 Å. These matrices were then used to calculate the differences in contact probability for each residue pair between any two ensembles, as described by Hamelberg [13, 63, 67]. Because the contact probability matrix ranges from 0.0 to 1.0, the difference in contact probability between two states ranges from −1.0 (probability decreases, contact is broken), through 0.0 (no difference between two states), to 1.0 (probability increases, contact is formed). Fig. 5A-C illustrates residue pairs with increased (blue) or decreased (red) contact probability between settled state ensembles (summarized in Table S1); the thickness of each bar indicates the magnitude of each probability change, where large magnitude differences are expected for significant conformational changes, and smaller magnitudes suggest small shifts around a single native state.
Figure 5. Difference contact network analyses (dCNA) for settled A-loop states in 2P-ERK2.

Contact probabilities are accumulated for residue-residue pairs when their heavy atoms are within 4.5 Å from each other. All contact probability differences with absolute value ≥ 0.1 are shown, rendered as bars connecting Cα atoms with radii scaled by the magnitude of the probability differences. Contact probabilities that increase or decrease between indicated states are shown in red or blue, respectively, going from (A) 2erk_2P.MKI to 2erk_2P.L16, (B) 2erk_2P.pY-R65 to 2erk_2P.MKI, and (C) 2erk_2P.pY-R65 to 2erk_2P.L16. For clarity, the differences in contacts made with residues in the A-loop are shown in insets, separately from contacts made only between residues in the kinase core. Yellow spheres in inset figures show Cα atoms for pT183 and pY185. (D) Overlay of all three reference structures, showing the displacement of the backbone between 2erk_2P.L16 (purple), 2erk_2P.MKI (gold), and 2erk_2P.pY-R65 (cyan). Side chains highlight selected residues in 2erk_2P.L16 and 2erk_2P.pY-R65. Red arrows highlight major conformational movements of R223 and F226 in the loop between helices αF and αG and pY185 in the A-loop, and W190 in the P+1 segment.
Contacts with A-loop residues showed large magnitude changes (Fig. 5A-C, insets), as expected from the large structural variations between states (Fig. 3A-C). Residues surrounding the pT183 and pY185 phosphorylation sites formed a hub (Fig. 5A-C, insets), reflecting the pronounced changes in contacts to kinase core residues. For example, the red bars between pY185 and R65 in helix αC reflected their closer proximity in 2erk_2P.pY-R65 compared to 2erk_2P.L16 or 2erk_2P.MKI, while blue bars between pT183 and R65 reflected their shift away from each other in 2erk_2P.pY-R65 (Fig. 5B,C, insets). Likewise, bars connecting residues in the A-loop N-terminus and C-lobe indicated closer proximity in 2erk_2P.MKI compared to 2erk_2P.L16 or 2erk_2P.pY-R65 (Fig. 5A,B, insets). These reflected the closer interactions between the A-loop and the P+1, MKI, and αH-αI segments that are unique to 2erk_2P.MKI (Fig. 3B).
Changes in contact probabilities were also apparent between pairs of residues exclusively located outside of the A-loop. Two regions in particular showed systematic differences between states. First, large changes between C-lobe residues were seen upon comparing 2erk_2P.pY-R65 to either 2erk_2P.L16 or 2erk_2P.MKI (Fig. 5B,C). These highlighted large shifts in residues in the loop between helices αF and αG (N222-F226) relative to those in helix αD, helix αG and MKI. Inspection of the reference structures revealed an obvious conformational change in the C-lobe of 2erk_2P.pY-R65 (Fig. 5D, cyan), where helix αG and the αF-αG loop moved towards MKI and away from the hinge and αD-αE loop compared to 2erk_2P.L16 and 2erk_2P.MKI (Fig. 5D, purple and gold). Trajectory overlays showed greater variability in main-chain and side-chain conformers in 2erk_2P.pY-R65, which, notably, drove R223 in the αF-αG loop from a solvent-exposed environment to one that was partially buried next to W190 in the P+1 loop (Fig. 5D, Fig. S5). These conformational movements in the C-lobe can be ascribed to the disruption of salt bridges between pY185 and the P+1 loop residues R189 and R192, which reoriented R189 towards helix αG, thus moving αG and the αF-αG loop towards MKI.
A second region with significant contact probability differences between A-loop settled state ensembles occurred in the N-lobe and active site. In this region, overlays between states showed only minor differences in backbone or side chain positioning (Fig. 6A). Nevertheless, a cluster of blue bars within the N-lobe revealed increased contacts in 2erk_2P.L16 compared to 2erk_2P.pY-R65 or 2erk_2P.MKI (Fig. 5A,C). These blue bars connected active site residues involved in ATP binding and phosphoryltransfer, including the Gly loop (G32, A33), β3 (K52), αC (Y62, E69) and the β9/DFG motif (D165, F166, G167). Examples illustrated in Fig. 6B show probability densities exhibiting their shifts between different A-loop ensembles. Thus, K52-E69 toggles between 2.9 Å and 4.5 Å with 2erk_2P.L16 mostly centered around an intact salt bridge, and 2erk_2P.pY-R65 shifted towards a disrupted one (Fig. 6B). Y34-G167, which reports contacts between the Gly loop and DFG, showed a dominant population around 4.2 Å in 2erk_2P.L16 which shifted towards 6 Å in 2erk_2P.pY-R65 and 2erk_2P.MKI. Similarly, shifts to longer distance were seen in A33-Y62, which reports contacts between the Gly loop and helix αC. Together, these findings reveal larger populations with Gly loop closure and compactness between active site residues in the 2erk_2P.L16 ensemble. At the same time, red bars indicated greater separation between the DFG and HRD motifs in 2erk_2P.L16 (Fig. 5A,C). Here, 2erk_2P.L16 showed increased distances between residues D146 (catalytic base) and D165 or N152 (Mg2+-coordinating) compared to 2erk_2P.pY-R65 or 2erk_2P.MKI (Fig. 6B).
Figure 6. Differences in regional dynamics between settled A-loop states in 2P-ERK2.

(A) Overlay of reference structures for 2erk_2P.L16 (purple) and 2erk_2P.pY-R65 (cyan), highlighting residues within the active site. (B) Probability densities for distances between residue pairs; each curve integrates to 1.0 for the region shown. Shifts in probability density reveal shortened distances involving catalytic residues in the K52-E69 salt bridge, the HRD motif (D147), and the DFG motif (D165, G167), and lengthened distances between HRD (D147, N152) and DFG (D165) motifs in 2erk_2P.L16 compared to other states. (C) Differences in RMSF between states, normalized to the 2erk_2P.L16 settled state (horizontal purple line). (D-F) Overlays of frames (every 250 ns) showing the regions of the A-loop and L16 segment for settled states (D) 2erk_2P.L16 (2erk_2P 2° seed 29), (E) 2erk_2P.MKI (2erk_2P 2° seed 43), and (F) 2erk_2P.pY-R65 (2erk_2P 2° seed 13).
In summary, dCNA revealed changes in contact between spatially clustered residues between different states of the A-loop. These reflected obvious conformational shifts that resulted from the movement of pY185 towards helix αC in 2erk_2P.pY-R65, disrupting its interactions with the P+1 loop and resulting in the movement of helix αG and the αF-αG loop towards MKI. At the same time, systematic changes in distance occurred in 2erk_2P.L16, which reflected greater compactness around conserved motifs involved in ATP binding and a shift towards greater opening around the catalytic base.
These results together with the absence of major conformational differences within the N-lobe suggested that changes in dynamics might contribute to residue compactness, such that 2erk_2P.L16 represents a more rigid, less dynamic mode of the active site than 2erk_2P.MKI or 2erk_2P.pY-R65. Inspection of root mean square fluctuations (RMSF) supported such changes in dynamics. Fig. 6C shows changes in fluctuations of Cα atom coordinates normalized to those of 2erk_2P.L16 (Fig. 6C, purple horizontal line centered at zero). As expected from Fig. 3, RMSF around the A-loop was largest for 2erk_2P.solv compared to other states (Fig. 6C, black), lowest for 2erk_2P.MKI (Fig. 6C, gold), and comparable between 2erk_2P.pY-R65 and 2erk_2P.L16. By contrast, RMSF values in 2erk_2P.MKI, 2erk_2P.pY-R65 and 2erk_2P.solv were systematically higher within the conserved regions of the N-lobe that form the ATP binding site and R-spine (Gly loop, helix αC, β3-β4-β5) (Fig. 6C, gold, cyan, black). Therefore, the shift towards compactness between N-lobe residues observed by dCNA is associated with more restrained dynamics in 2erk_2P.L16 compared to the other states.
The interactions between the A-loop and kinase core suggest an explanation for the unique ability of 2erk_2P.L16 to modulate distal N-lobe regions. Multiple contacts formed between the A-loop and L16 segment in 2erk_2P.L16 (e.g., P174-F329, F181-P337) were absent in 2erk_2P.MKI or 2erk_2P.pY-R65 (Fig. 6D-F). These resulted in a restrained L16 loop with reduced dynamics compared to the other states, as apparent from RMSF plots and trajectory overlays (Fig. 6C,D). As a result, F327 in L16 packs against hydrophobic residues in helix αC, which in turn are part of a network of hydrophobic residues surrounding K52-E69 and DFG (Fig. S6). By contrast, larger movements of F327 in 2erk_2P.MKI and 2erk_2P.pY-R65 disrupted the interactions between L16 and the N-lobe (Fig. 6E,F). Thus, the reduced motions of L16 in 2erk_2P.L16 may explain the lower fluctuations and greater compaction in elements of the Gly loop, helix αC, and β3-β4-β5 compared to other states. This suggests that mutual interactions with L16 could allow the A-loop conformation to control the dynamics of essential residues in the active site.
Simulations of unphosphorylated ERK2
Conformational ensembles of the unphosphorylated A-loop
0P-ERK2 was examined using MD approaches similar to those described for 2P-ERK2. Three starting states were used, corresponding to the X-ray structure of the unphosphorylated apoenzyme (5UMO; starting state 5umo_0P, Fig. 1B), the structure of 2P-ERK2 (2ERK) after replacing pT183 and pY185 with unphosphorylated Thr and Tyr (2erk_0P, Fig. 1A), and a structure of 0P-ERK2 complexed with a kinase interaction motif (KIM) docking peptide (2Y9Q) after removing the peptide ligand (2y9q_0P, Fig. 1C).
Primary trajectories showed multiple A-loop conformations with low RMSF and lifetimes > 5 μs (Fig. 7). Two distinct states were observed in 1° seeds started from 5umo_0P. One state, named “5umo_0P.MKI”, largely preserved the fold seen in the 5UMO crystal structure, with F181 anchored to the C-lobe and Y185 buried within the P+1 loop (Fig. 7A). Here, L182 was also anchored to the C-lobe, exposing T183 to solvent, as in 5UMO. The RMSD of the A-loop remained within (3 to 4) Å from the starting state, while the kinase core backbone remained within 2 Å. After identifying a reference frame for 5umo_0P.MKI (Fig. S7A), and RMSD values were calculated across all 1° trajectories (Fig. S8A,B, green). The 5umo_0P.MKI conformation was observed in five of six 1° seed trajectories started from 5umo_0P, where > 0.67 and RMSD < 2 Å relative to its reference frame.
Figure 7. RMSD and RMSF plots identify settled states of the A-loop in 0P-ERK2.

RMSD and RMSF plots for Cα atoms, and overlay of frames corresponding to A-loop settled states, for (A) 5umo_0P.MKI (5umo_0P 1° seed 1 at 300 K), (B) 5umo_0P.FL (5umo_0P 1° seed 2 at 315 K), (C) a representative example of a seed that fails to form a settled state, 2erk_0P.solv (2erk_0P 1° seed 1 at 300), (D) 2erk_0P.Y-αC (2erk_0P 1° seed 1 at 315 K), and (E) 2y9q_0P.F/Y (2y9q_0P 1° seed 3 at 300 K). RMSD plots are shown for the A-loop (res. 170-186, colors) and kinase core (res. 16-169 and 187-348, black). RMSF plots show averages and standard deviations of the A-loop RMSF for 1 μs segments across each trajectory. Overlays of A-loop conformers show frames separated by 1 μs for each entire trajectory. For the two novel states (panels B,D), the settled states are shown by frames in color, and the frames outside the settled states are shown in gray. and RMSD plots are provided for all 0P-ERK2 1° and 2° seed trajectories in Figs. S8 and S9, respectively.
A second state appeared in the remaining 1° seed started from 5umo_0P, reaching a new settled conformation with average A-loop RMSF < 1.5 Å between (22 to 27) μs of the trajectory (Fig. 7B, Fig. S8 5umo_0p.315.seed 2, salmon). Here, interactions of F181 and L182 with the C-lobe were broken, exposing F181 and Y185 to solvent (Fig. 7B). This new state was therefore named “5umo_0P.FL” and was used to initiate multiple 2° seeds (Fig. S9 5umo_0p.300.seeds 3-7, salmon). After defining the reference states for 5umo_0P.MKI and 5umo_0P.FL (Fig. S7A,B), comparisons showed that once the 5umo_0P.FL A-loop conformation formed, it never returned to 5umo_0P in any 1° or 2° seed (Fig. S8 5umo_0p.315.seed 2, Fig. S9 5umo_0p.300.seeds 3-7, salmon).
In 1° seeds starting from 2erk_0P, most trajectories immediately deviated from the initial conformation, leading to a largely disordered A-loop with RMSD > 5 Å and average A-loop RMSF > 2 Å, which was named “2erk_0P.solv” (Fig. 7C). However, one 1° seed reached a settled state where the average A-loop RMSF decreased to < 1.2 Å after 7 μs and persisted for the remainder of the trajectory (Fig. 7D, Fig. S8 2erk_0p.315.seed 1, maroon). In this new A-loop conformation, the main chain around the T-E-Y phosphorylation motif rotates, moving Y185 towards helix αC. Here Y185 remains solvent exposed, burying F181 into a pocket formed between HRD, P+1 and αF (Fig. 7D). This state was named “2erk_0P.Y-αC” (Fig. S7C). Multiple 2° seeds retained this conformer, which was clearly distinct from all others (Fig. S9 2erk_0p.300.seeds 3-10, maroon). Finally, 1° seeds starting from 2y9q_0P retained the A-loop conformation seen in the 2Y9Q X-ray structure (Fig. 7E), where F181 and L182 interactions with the C-lobe were disrupted, displacing Y185 to solvent. This state was named “2y9q_0P.F/Y” (Fig. S7D). RMSD and measurements showed that all 1° trajectories largely remained in the 2y9q_0P.F/Y state (Fig. S8 2y9q_0p.300.seeds 1-4, teal), therefore 2° seeds were not performed.
Together, these results revealed considerable conformational variation in the A-loop of 0P-ERK2. Importantly, each of the starting models accessed settled A-loop states with substantial residue exposure to solvent (5umo_0P.FL, 2erk_0P.Y-αC, 2y9q_0P.F/Y), as well as a disordered state (2erk_0P.solv). This was particularly significant for residue Y185, whose phosphorylation by MKK1/2 is kinetically favored over T183 [18]. Although the buried conformation of Y185 in the 5UMO crystal structure has always obfuscated the experimentally observed order of phosphorylation, the latter can be readily explained by the MD results demonstrating multiple conformations of the A-loop with solvent exposure of Y185.
A-loop states of 0P- and 2P-ERK2 have differential effects on the kinase core
Upon examining different states of 0P-ERK2 by dCNA (Fig. 8), the largest red and blue bars reflected conformational differences in the A-loop and proximal regions of the kinase core. Thus, 5umo_0P.MKI showed increased contacts of the A-loop with P+1, helix αG, and MKI in the C-lobe, compared to 2erk_0P.Y-αC and 2y9q_0P.F/Y (Fig. 8A,B). These reflected major conformational changes in F181 and L182 in the A-loop and Y203 in the P+1 segment, each which formed or disrupted many heavy atom contacts between states.
Figure 8. Difference contact network analyses (dCNA) for settled A-loop states in 0P-ERK2.

Contact probabilities are calculated and displayed as described in Fig. 5. Shown are contact differences going from (A) 5umo_0P.MKI to 2erk_0P.Y-αC, (B) 5umo_0P.MKI to 2y9q_0P.F/Y, (C) 2erk_0P.Y-αC to 2y9q_0P.F/Y, and (D) 5umo_0P.MKI to 5umo_0P.FL. For clarity, the contact differences involving A-loop residues are shown in insets, separately from those made only between kinase core residues. Yellow spheres in inset figures show Cα atoms for T183 and Y185.
Outside of the A-loop region, differences in residue contacts were less extensive between settled states of 0P-ERK2 than 2P-ERK2. For example, conformational changes in the C-lobe between the reference structures of 0P-ERK2 (Fig. S7A-D) were smaller than those seen in 2erk_2P.pY-R65 (Fig 5D, Fig. S5). Furthermore, the systematic shifts in contact probabilities that reflected compaction within the N-lobe in 2erk_2P.L16 (Fig. 5A,C, Fig 6B) were largely absent between different 0P states (Fig. 8). Thus, for the most part, dCNA differences between 0P-ERK states were localized to the A-loop and regions in proximity. This contrasted with 2P-ERK2, where conformational variants of the A-loop were associated with perturbations at distal N-lobe regions.
A more dynamic state in 5umo_0P.MKI is formed by removing A-loop residues F181 and L182 from the αG-MKI pocket
The 5umo_0P.FL settled state was an exception to the observations above. Here, dCNA bars revealed substantial disruption of contacts between N-lobe residues in helix αC and the active site compared to 5umo_0P.MKI (Fig. 8D). Transitioning from 5umo_0P.MKI to 5umo_0P.FL consistently reduced contacts throughout the active site region and enhanced contacts to the MKI. This resulted in enhanced dynamics of 5umo_0P.FL, which we examined in greater detail.
In order to more closely examine the transition from 5umo_0P.MKI to 5umo_0P.FL we plotted the distances between C-lobe residue L232 (helix αG) and A-loop residues F181 and L182 for all 1° seeds of 5umo_0P (Fig. 9). Both residues begin stably situated in the αG-MKI pocket, which forms the binding site for DEF docking motifs. Surprisingly, F181 transiently leaves and rebinds the pocket in all trajectories, exiting stably in one seed only after 14 μs (Fig. 9A, Fig. 7B, Fig. S8 5umo_0p.315.seed 2). By contrast, L182 remains in the αG-MKI pocket in all 1° trajectories except this seed, where it follows the F181 excursion, fluctuating briefly at 15 μs, before stably transitioning away (Fig. 9B). The RMSF of the A-loop increases sharply (Fig. 7B) and then decreases as the loop settles into its new state, with L182 buried near Y185. The results show that 5umo_0P.MKI accommodates transient excursions of F181 away from the C-lobe, until a point where L182-C-lobe contacts are disrupted, leading to cooperative movements of the A-loop to form the 5umo_0P.FL state. This provides novel insight into the importance of contacts formed by L182 in controlling the movements of the A-loop.
Figure 9. Dynamics of the A-loop and kinase core in the 5umo_0P.FL trajectory.

Overlays of 1° seed trajectories, each starting from 5umo_0P. Distances between residues (A) F181 in the A-loop and L232 in the C-lobe, and (B) L182 in the A-loop and L232. Plots show frames every 12.5 ns. (C-E) Difference contact network analyses (dCNA) showing contact probability differences between three regions of the trajectory where 5umo_0P.FL appears (5umo_0P 1° seed 2 315 K), corresponding to time windows in Regions I (10 μs to 14 μs), II (14 μs to 17 μs) and III (17 μs to 33 μs).
This transition to the new A-loop state was explored further by examining the time dependence of dCNA, comparing three regions of the 1° seed trajectory (Fig. 9C-E). dCNA comparing the first 4 μs (Region I) to the next 3 μs (Region II) reveals the disruption of contacts between the A-loop and C-lobe (red bars), and closer interactions between helix αC, L16, and the active site (blue bars) (Fig. 9C). Completing the transition, dCNA comparing Region II to Region III reveals reduced contacts throughout the kinase core, and new contacts formed with the MKI (Fig. 9D). Overall, the dCNA between Region I to Region III reflects changes in contact similar to those between 5umo_0P.MKI and 5umo_0P.FL (Fig. 8D).
Interestingly, contacts formed and broken appeared to fluctuate between the dCNA for Regions I vs II and for Regions II vs III (Fig. 9C,D), implying transient movements in localized regions of the kinase core. The fluctuations, in part, reflected large movements of helix αC, as measured by 80°-120° shifts in the pseudo-dihedral angle (φ) between helices μC and αE (Fig. 10A,B). Further separation of this trajectory into eight regions based on φ revealed large variations in contacts by dCNA (Fig. S10A-G). Time-dependent shifts in red and blue bars revealed that the fluctuations in conformation involved the DFG and HRD motifs and helix αC, which rapidly exchanged as φ increased or decreased. By contrast, conformational fluctuations were more restrained in trajectories of 2erk_2p, as illustrated for the 1° seed for 2erk_2P.MKI (Fig. S11A-C, Fig. 4G, Fig. S2 2erk_2p.330.seed 1). Here, φ ranged between 90°-105° and time-dependent dCNA reflected changes in contacts that were fewer and lower in magnitude (thinner red and blue bars) compared to the 5umo_0P.FL trajectory.
Figure 10. Variations in dihedral angles and domain separation in different A-loop states of 2P-ERK2 and 0P-ERK2.

(A) The pseudo-dihedral angle between helices αC and αE (φ) is shown schematically for the 2erk_2P.MKI reference structure. (B) Fluctuations in φ vs time across the 1° trajectory containing 5umo_0P.FL (5umo_0p seed 2 at 315 K). (C,D) Probability densities for φ are shown for different A-loop states in (C) 2P-ERK2 and (D) 0P-ERK2. (E) Probability densities for the distance between Q60 and Y231 in different A-loop states of 2P-ERK2 and 0P-ERK2. (F-H) Representative frames illustrating variations in structure in 5umo_0P.FL.
Variations in interdomain movements between 0P- and 2P-ERK2
The pseudo-dihedral angle between helices αC and αE has been used to report domain movements in ERK2 by measuring the degree of rotation between N- and C-lobes [4, 43]. Plots of φ for trajectories starting from 2erk_2P showed a probability distribution that was narrower for 2erk_2P.L16 and broader for 2erk_2P.pY-R65 or 2erk_2P.MKI, and broadened even further in 2erk_2P.solv (Fig. 10C). This is consistent with a greater degree of N-lobe compaction in 2erk_2P.L16 compared to other states. In addition, the magnitude of φ decreased in 2erk_2P.pY-R65 relative to 2erk_2P.L16, reflecting a shift of helix αC inwards, due to salt-bridge formation between pY185 and R65. The magnitude of φ increased in 2erk_2P.MKI relative to 2erk_2P.L16, reflecting movement of helix αC outwards, due to disruption of A-loop interactions with the N-lobe.
By contrast, the pseudo-dihedral angles were systematically lower in magnitude in nearly all trajectories of 0P-ERK2, with probability densities more comparable to 2erk_2P.pY-R65 than 2erk_2P.L16 or 2erk_2P.MKI (Fig. 10D). The distribution was shifted to higher values for 5umo_0P.MKI compared to 2erk_0P.Y-αC and 2y9q_0P.F/Y, a trend similar to that observed for 2erk_2P.MKI compared to the other 2erk_2p states. The most dramatic shift in the distribution was observed for 5umo_0P.FL, which shifted φ to higher angle with significantly broadened probability density. As noted above, the dihedral angle for each frame varied considerably when plotted over the course of the 1° seed trajectory where 5umo_0P.FL appeared (Fig. 10B), even after the A-loop reached its settled conformation (Fig. 7B). Density plots of the distance between Q60 and Y231 which measures N- and C-lobe separation (Fig. 10E), as well as frames captured during this trajectory (Fig. 10F-H) illustrate the large rotations of helix αC underlying this variation. Together, the results reveal broader motions within the kinase core in states of 0P-ERK2 compared to 2P-ERK2, and especially large backbone motions in 5umo_0P.FL.
Variations in RMSF and active site residue distances between 0P- and 2P-ERK2
RMSF values for Cα atoms were examined for the different states of 0P-ERK2 (Fig. 11A). Each state was normalized to 2erk_2P.L16, in order to directly compare them to the RMSF plots in 2P-ERK2 (Fig. 6C). Outside of the A-loop and MKI segments, most states of 0P-ERK2 (5umo_0P.MKI, 2erk_0P.Y-αC, and 2y9q_0P.F/Y) showed RMSF values that were largely comparable across the kinase (Fig. 11A). The exception again was 5umo_0P.FL, which displayed RMSF values elevated far above the others, revealing increased motions in all regions of the enzyme. Importantly, larger fluctuations in the N-lobe and the L16 segment were observed in all forms of 0P-ERK2 relative to 2erk_2P.L16, and were comparable to fluctuations in 2erk_2P.pY-R65 and 2erk_2P.MKI (Fig. 6C). Although the L16 segments in these states appeared organized, greater variability in L16 side chain interactions with the N-lobe (e.g. F327) were apparent (Fig. 11B-E). The results are consistent with a model in which disrupting interactions of the A-loop with L16 elevates the RMSF in key regions of the N-lobe, enabling conformations of the A-loop to control dynamics within the active site. Overall, the range of motions in 0P-ERK2 appeared systematically enhanced relative to 2P-ERK2.
Figure 11. Differences in regional dynamics between settled A-loop states in 0P-ERK2.

(A) Differences in RMSF between states, normalized to the 2erk_2P.L16 settled state (horizontal purple line). (B-E) Overlays of frames (every 250 ns) showing regions of the A-loop and L16 segment for settled states (B) 5umo_0P.MKI (5umo_0P 1° seed 1 300 K), (C) 5umo_0P.FL (5umo_0P 2° seed 4 300 K), (D) 2erk_0P.Y-αC (2erk_0P 1° seed 1 315 K), and (E) 2y9q_0P.F/Y (2y9q_0P 1° seed 3 300 K). (F) Overlay of reference structures for 5umo_0P.MKI (green) and 2erk_0P.Y-αC (maroon), highlighting residues within the active site, as in Fig. 6A. (G) Probability densities for distances between residue pairs; each curve integrates to 1.0 for the region shown. Shifts in probability density reveal longer distances involving catalytic residues in states from 0P-ERK2, referenced to 2erk_2P.L16.
Accordingly, density plots revealed lengthening of distances between N-lobe residue pairs in all 0P states relative to 2erk_2P.L16 (Fig. 11F,G). Thus, relative to 2erk_2P.L16, the K52-E69 salt bridge shifted to longer distances in 5umo_0P.MKI, 2erk_0P.Y-αC, 2y9q_0P.F/Y, and 5umo_0P.FL, while Y34-G167, A33-Y62, and K52-D165 lengthened in all 0P states. Notably, the probability densities for 5umo_0P.MKI, 2erk_0P.Y-αC, and 2y9q_0P.F/Y were similar to those for 2erk_2P.pY-R65 (Fig. 6B, Fig. 11G). Residue pairs in 5umo_0P.FLwere even more strongly separated, revealing larger conformational fluctuations, including for example Y34-G167 distances between 10 Å and 15 Å, corresponding to an autoinhibited state with Y34 folded beneath the Gly loop (Fig. 10G). Overall, residue contacts in the active site showed greater disruption in the A-loop states of 0P-ERK2 compared to 2P-ERK2.
In summary, the results from MD reveal substantial differences between A-loop states sampled by 0P- and 2P-ERK2. In all simulations of 2P-ERK2, the A-loop moves away from the 2ERK X-ray structure, forming settled conformers with variable contacts to the kinase core. The differences between these contacts lead to differences in dynamics in regions surrounding the ATP binding site, and suggest dynamic restraints introduced through A-loop interactions with the L16 segment. By contrast, simulations of 0P-ERK2 maintain starting conformations and introduce new ones. Many of these settled states deviate from the 5UMO X-ray structure, resulting in disrupted A-loop contacts with MKI and solvent-exposure of Y185. Importantly, the 0P states reflect a lower degree of organization and greater fluctuations within the N-lobe, compared to 2P-ERK2.
Free energy surfaces reveal allosteric coupling between the A-loop and kinase core in 2P-ERK2.
The dCNA and subsequent structural distribution analysis revealed distinct effects on the core of the enzyme due to different settled states of the A-loop for 2P-ERK2. Principal component analysis (PCA) was carried out to further examine the role of the A-loop on the kinase core dynamics. The first 100 principal components (PCs) were determined for the enzyme core backbone atoms for both 0P and 2P sets of 300 K trajectory frames (see Materials and Methods). The PC subspace of 0P and 2P were similar. In 2P, the first and second PCs (PC1_2P and PC1_2P, Fig. S12A) corresponded to interdomain twisting and opening/closing, respectively. In 0P, the first two PCs (Fig. S12B) appeared qualitatively similar but in the opposite order. The first two PCs accounted for 0.35 and 0.52 of the total variance for 2P and 0P states, respectively. Overall, a larger number of PCs were required to capture the majority of the variance for 2P-compared to 0P-ERK2 (Fig. S13), suggesting a narrower range of collective motions in the inactive enzyme.
Probability distributions were estimated in the space of the first two PCs, generated from all trajectory frames together, or from just the frames corresponding to each A-loop state. The probability distribution for 2P-ERK2 separated into three regions (Fig. S14A), each corresponding to one of the stable states (2erk_2P.L16, 2erk_2P.MKI, 2erk_2P.pY-R65), while 2erk_2P.solv spread across the area connecting them (Fig. S14B-E). By contrast, the probability distribution for 0P-ERK2 (Fig. S15) was mostly confined to one region with greater overlap between each of the settled states (Fig. S15B-E). The exception was 5umo_0P.FL, which showed a wider distribution (Fig. S15F). Free energy surfaces were then calculated from each of the probability distributions (Fig. 12). These revealed that the three distinct energy wells in 2P-ERK2 differed by less than 1 , and were lower than the free energy of 2erk_2P.solv by less than 2 (Fig. 12A). As expected, the states were energetically similar and separated by low energy barriers. Importantly, the 2P-ERK2 free energy surface shows that the kinase core is allosterically coupled to conformations of the A-loop. By contrast, the confinement of stable states in 0P-ERK2 to a single energy well provides no mechanism for A-loop modulated allosteric conformational selection (Fig. 12B). This explains how conformational selection[10, 68] by active site inhibitors can perturb the A-loop in 2P-ERK2 but not 0P-ERK2.
Figure 12. Free energy surface estimates in the space of the first two principal components for 2P- and 0P-ERK2.

PCA was carried out on the core backbone coordinates for all frames collected at 300 K (frames in each seed saved every 2.5 ns) separately for 2P- and 0P-ERK2. (A,B) The free energy surfaces were calculated from the probability density estimated using histograms of frame projections onto the corresponding PCs for (A) 2P-ERK2 (Fig. S12A) and (B) 0P-ERK2 (Fig. S12B). Colors indicate units of with contour lines drawn for every 0.25 increment up to 3.00 .
Crystal structures of 0P- and 2P-ERK2 reveal lattice restraints around the A-loop
Two striking outcomes of the MD analysis were the persistent movements of the A-loop away from the 2ERK starting state in all trajectories of 2P-ERK2, and the significant variations of the A-loop in 5umo_0P.FL and other 0P settled states. Sang et al. [54] have proposed that crystal packing interactions stabilize the A-loop conformation in the 5UMO crystal structure. Furthermore, recent MD simulations of p38α MAP kinase [26] and Abl kinase [3] also found large variations in solution-phase A-loop conformations, and established a role of crystal packing in stabilizing/selecting A-loop conformers based on simulations of the crystal environment. In fact, anisotropic displacement parameters (ADP) derived from an ensemble of myoglobin structures were found to agree well with the positional variance of the solution NMR ensemble, but were suppressed by crystal contacts [23]. Therefore, we explored the conformational diversity of ERK2 in more detail, using a structural survey of RCSB PDB entries. We would expect MD simulations that included the crystal environment to maintain contacts observed by X-ray diffraction even at elevated temperatures, as observed in the above-mentioned studies [3, 26].
Table S2 and Suppl Dataset S1 summarize ten 2P-ERK2 and 167 0P-ERK2 crystal structures, along with RSCB metadata and crystal contacts formed with the A-loop or MKI. These totalled 186 chain entries, treating each chain within the asymmetric unit as an independent entry in keeping with the parametric treatment (coordinates, occupancies, and temperature factors) by the crystallographer.
Crystal contacts in the 2P-ERK2 apoenzyme (2ERK) are shown in Fig. 13A, highlighting lattice atoms within 5 Å of heavy atoms in the structure. Except for 2ERK, all 2P-ERK2 structures were ligand-bound to a small molecule or polypeptide. In four of five ligand-bound structures (5V60, 6OPG, 6OPH, 6OPK), the resolved A-loop was modeled by the same solvent-exposed conformation described in 2ERK. Like 2ERK, each structure displayed multiple crystal contacts with A-loop residues P174-F181, regardless of space group. The exception was 6OPI, a structure of 2P-ERK2 bound to an ATP-competitive inhibitor, in which the A-loop was disordered in a space accessible to solvent. Thus, the prevalence of crystal contacts in the majority of 2P-ERK2 structures suggest stabilization of the A-loop by lattice interactions, which may explain why all MD trajectories rapidly moved the A-loop away from the X-ray structure (Fig. 2). Notably, a crystal structure of 2P-ERK2 complexed with the ERK DEF docking motif on PEA15 (death effector domain (DED), PDBid: 4IZA) showed the A-loop protected from solvent by multiple PEA15-DED interactions [32]. Here, the A-loop conformation broke the canonical salt bridge between pY185, R189 and R192, allowing pY185 to move away from the C-lobe and interact with R65 on helix αC (Fig. S16). The similarity between this A-loop conformer and that of 2erk_2P.pY-R65 further supports the latter as an accessible state that can accommodate ligand interactions with the DEF docking site.
Figure 13. Crystal contacts with the A-loop in X-ray structures of ERK2.

Structures of (A) 2ERK, (B) 5UMO, and (C) 2Y9Q, with the ERK2 asymmetric unit rendered in white cartoon, and atoms from protein neighbors within 5 Å shown as black spheres. Alternative orientations correspond to rotation by ~90° about the vertical axis.
In the 5UMO crystal structure of 0P-ERK2, Y185 is buried in a pocket formed by I196 (in P+1), I207 (αF), and R146 (HRD), and stabilized by interactions of F181 and L182 with L232 and Y261 in the helix αG-MKI pocket. Fig. 13B highlights crystal lattice contacts with A-loop atoms in 5UMO. These reveal extensive contacts between residues in the αG-MKI pocket and 16 atoms on neighboring ERK2 molecules. Notably, the size of the pocket for F181 and L182 is extended by crystal contacts with Y315 and P317 from an ERK2 neighbor. At the same time, the A-loop residues preceding F181 (H178-T179-G180) are in close proximity to side chain atoms in T157 and T158 from a second ERK2 neighbor. By computing the intersection between the crystal contacts in 5UMO against those in all other entries, we observed 112 entries that retained ≥ 75% of the same contact pairs, all sharing the same spacegroup (P1211) and A-loop conformation, and only one with a partially unresolved A-loop (Suppl. Dataset S1). Seven more entries displayed the same A-loop conformation, except with different lattice contacts to the A-loop and a different space group (P21212). Two other entries (4QTE, 6G54, space group P3221) displayed the same A-loop conformation, but with multiple lattice contacts to the MKI. Therefore, the majority of 0P-ERK2 structures shared crystal contacts in the regions surrounding the A-loop and αG-MKI pocket that might be expected to stabilize the observed A-loop conformation.
By contrast, in 36 PDB entries (Suppl. Dataset S1) the A-loop of 0P-ERK2 was partially or completely disordered (e.g. 5K4I, 4QTA, 6OTS). Of these, only one (4XOY) displayed F181 and L182 interactions with MKI that were similar to those in 5UMO. In all others, interactions between the A-loop and its canonical binding site in 5UMO were replaced, either by other residues within the kinase core or by crystal contacts with a neighboring molecule. In 29 cases, crystal contacts with the MKI distorted the αG-MKI pocket, precluding interactions with with F181 and L182 (e.g. 2Y9Q, Fig. 13C).
In summary, crystal packing interactions appear to strongly influence the A-loop conformations of both 2P-ERK2 and 0P-ERK2, either by stabilizing intramolecular interactions of the A-loop with the kinase core, or by interfering with them. Together, they support the indications by MD of variable A-loop conformations as reasonable representations of solution behavior.
Discussion
In this study, extended conventional molecular dynamics simulations reveal unexpected conformational heterogeneity of the A-loop in both 2P- and 0P-ERK2. At least three settled states of the A-loop can be observed in 2P-ERK2, each diverging appreciably from the starting 2ERK crystal structure. At least four states can be observed in 0P-ERK2, three of which disrupt canonical A-loop interactions with the C-lobe in the 5UMO crystal structure. Importantly, the different A-loop states are associated with distinct effects within the kinase core, including variations in the range of motions in the active site. Overall, 2P-ERK2 shows greater dynamic restraint and compactness between conserved residues in the N-lobe and active site, in contrast to 0P-ERK2 which shows a higher level of disorganization. Significantly, PCA reveals that the coupling between settled A-loop states and the kinase core differ between enzyme forms, by showing clear conformation selection driven by states of the A-loop for 2P-ERK2 but not 0P-ERK2. Our findings suggest that dual phosphorylation at T183 and Y185 serve in part to restrain N-lobe dynamics in the active form of ERK2, which may assist in catalytic turnover through accessing distinct dynamic states. The results from MD support conclusions reached from NMR relaxation dispersion and HX-MS experiments, that motions of the A-loop can be coupled to motions at the active site.
In 2P-ERK2, the A-loop conformation varies widely between the three settled states. One forms multiple side chain contacts from the A-loop to the N-lobe and L16 segment (2erk_2P.L16), while another forms strong contacts with the C-lobe and MKI (2erk_2P.MKI). The third conformation (2erk_2P.pY-R65) breaks the salt-bridges between pY185 and R189/R192, allowing pY185 to interact with helix αC, and R189 to shift the loop between helices αF and αG. In 0P-ERK2, two states remain similar to their starting crystal structures (5umo_0P.MKI, 2y9q_0P.F/Y), while two others move the A-loop to very different conformations (5umo_0P.FL, 2erk_0P.Y-αC). Noteworthy is 5umo_0P.FL, which disrupts the contacts between A-loop residues F181 and L182 and the helix αG-MKI pocket. Its trajectory (Fig. 9A,B) shows how F181 undergoes reversible excursions away from the pocket while L182 remains docked, and how the new settled A-loop forms once L182 moves away from the C-lobe. The disruption of F181 and L182 contacts in this trajectory, as well as in 2y9q_0P.F/Y and 2erk_0P.Y-αC, moves Y185 away from its buried position in 5UMO and exposes it to solvent. This may explain why Y185 appears more inaccessible than T183 in the crystal structure, yet is kinetically favored for phosphorylation by MKK1/2 [18].
Such behavior suggests the importance of F181 and L182 in remodeling the A-loop. Like 0P-ERK2, these residues also control A-loop states in 2P-ERK2. Thus, the A-loop in 2erk_2P.pY-R65 involves interactions of L182 with R170 and Y203, while 2erk_2P.MKI involves L182 interactions with Y203, P174, A172 and T179, in each case exposing F181 to solvent. In 2erk_2P.L16, F181 forms contacts with the L16 loop, exposing L182 to solvent. Interestingly, 2° seed trajectories show decay of the 2erk_2P.L16 state more often than 2erk_2P.MKI or 2erk_2P.pY-R65. Conceivably, L182 may be an important contributor to the lifetime of the settled states and a driver for conformational exchange, where breaking or making contacts with this residue underlies A-loop remodeling.
These novel settled states of 2P- and 0P-ERK2 highlight the advantages of using extended conventional MD simulations to explore conformational changes. Previous MD studies on 0P-ERK2 [31, 54], carried out using trajectory lengths of (0.5 to 1) αs, showed no major changes in the A-loop from the initial crystal structures, even when hundreds of parallel runs were conducted totalling to 2 ms [54]. In our simulations, 1 μs was never long enough to capture deviations from the initial state into new settled states. The longer continuous individual trajectory run times, together with a change of the water model from TIP3P [22] to OPC [56] in our study, as suggested by Tian et al. [61], may have helped alleviate biases introduced by crystal lattice contacts in the starting models.
Also advantageous were new structural analysis tools to classify states and identify them across multiple trajectories. To achieve this, we used the varying fluctuations of the loop as an intuitive identifier and then applied a “native contact” parameter (Q), originally developed for protein folding, to refine and separate. The application allowed large collections of frames to be separated as a function of A-loop conformation. In doing so, it established an important role of the A-loop on the dynamics of the kinase core, by revealing correlations between active site residue distances, RMSF, and states of the A-loop using dCNA. While the active sites in all three settled states of 2P-ERK2 remained structured, uniformly longer distances and larger fluctuations were seen in 0P-ERK2, increasing to levels as high as RMSF > 3 Å in trajectories of 5umo_0P.FL. In addition, PCA plots revealed clear regional separation for dynamics of the kinase core corresponding to the three settled A-loop states in 2P-ERK2 but little or no separation for the states of 0P-ERK2. Together, the results reveal coupling between the conformational states of the A-loop and the dynamics in the active site for 2P-ERK2.
Our results suggest that dual phosphorylation of the A-loop organizes the conformational landscape so that formation of A-loop settled states modulates the active state of ERK2. ERK2 is unusual in that large conformational changes within the active site are not obvious from X-ray crystal structures or our MD trajectories of 2P- and 0P-ERK2. Other MD investigations of protein kinases benefit from large conformational variations present in their starting models: X-ray structures that have been categorized as ”active” or ”inactive”. Despite these differences in available model space and the longer A-loop in ERK2, our results and those for other kinases (e.g. p38α MAPK, Src, [26, 34]) are in agreement that the A-loop accesses multiple conformations in both inactive and active states. Overall however, the conformational variations in active site elements (e.g. helix αC, DFG, Gly loop) appear more restricted in ERK2 than other kinases. For example, in the states observed by our study, none fall outside the range of DFG-in conformers observed in other enzymes (Fig. S17). While enhanced sampling techniques may expand the conformational space available to these elements, the evidence so far suggests that ERK2 is an enzyme whose 60,000-fold increase in phosphoryl-transfer efficiency upon activation is largely regulated at the level of dynamics.
Our MD results expand the structural understanding of dynamics in ERK2 inferred from solution measurements. Previous NMR relaxation dispersion studies of 2P-ERK2 demonstrated conformational exchange of the A-loop between thermally accessible states, designated “R” and “L” that differed by only 3.3 kJ/mol (0.8 kcal/mol) and had an interconversion rate of 300 s−1 [64]. Furthermore, both NMR and HX-MS experiments revealed coupling between the A-loop and the active site, based on mutations in the A-loop that blocked exchange within the active site, and ATP-competitive inhibitors that altered hydrogen-deuterium exchange adjacent to the A-loop [21, 43]. Although multiple “long-lived” conformational states in our simulations might undergo exchange, the (10 to 100) μs timescale implied by the trajectories is faster than the millisecond timescale associated with L⇌R exchange. Most likely, the conformational states observed in this study are not the only ones that exist in 2P-ERK2. Instead, we propose that the R state in 2P-ERK2 represents an ensemble of organized states with relatively restrained active site dynamics, while the L state in 0P-ERK2 is represented by a more disorganized set of states. The latter includes 5umo_0P.FL, which disrupts the catalytic salt bridge, K52-E69, and shifts K52-D165 and D147-D165 towards longer distances apart (Fig. 11G), although remaining within the conformational space defined by DFG-in (Fig. S17)[37, 60]. Finally, the lack of conformational exchange in 0P-ERK2 seen by NMR [64] is consistent with the patterns of disorganization between contacts in dCNA analyses of 5umo_0P.FL (Fig. 9C-E, Fig. 10F-H), and the restricted conformational modes seen by PCA (Fig. S15).
The functional importance of A-loop dynamics is an emerging concept in the kinase field [42]. Like ERK2, solution measurements of other kinases have revealed multiple substates of the A-loop available to both active and inactive forms [15, 16, 26, 33, 50, 65]. In Aurora A, single molecule fluorescence quenching and Forster resonance energy transfer (FRET) experiments show shifts in A-loop populations between active, open vs inactive, closed states, which are respectively coupled to DFG-in vs DFG-out conformations [15, 16, 50]. Conformational selection for the open A-loop by Aurora A inhibitors correlates with binding of an allosteric activator, TPX2. This suggests that the availability of A-loop substates in the unphosphorylated Aurora A enables its binding and activation by TPX2. Similarly, site-directed spin labeling EPR measurements of CDK2 reveal heterogeneous populations of the A-loop in open vs closed states, which correlate with helix αC-in vs αC-out conformations [33]. Transient formation of the open A-loop conformation enables allosteric recognition and binding of cyclin A to promote CDK2 activation [33]. The Abl tyrosine kinase provides a third example, where type II kinase inhibitors promote conformation selection for a DFG-out/A-loop-closed configuration. This in turn disrupts SH3-linker interactions leading to detachment of the SH3-SH2 domains and disassembly of kinase domain interactions [58].
In the same way, conformational variants of the A-loop in ERK2 might expand the range of substrates or effectors that bind directly to the A-loop or indirectly to distal allosteric sites. For example, the disruption of pY185 salt bridges with R189/R192 in 2erk_2P.pY-R65 allows pY185 to migrate away and pair with R65 in helix αC. The same movement is seen in the crystal structure of 2P-ERK2 complexed with PEA15, along with disruption of the pT183-R65 salt bridge due to PEA15 residue interactions (Fig. S16) [32]. Thus, structural and flexibility changes near pY185 and the MKI might affect recognition by substrates and effectors, especially those that bind the DEF docking site. This suggests that plasticity of the A-loop fold should also be considered in models for substrate binding. For example, the explanation of why DEF ligands such as ELK1 show reduced binding to 0P-ERK2 [7] might be reevaluated to include A-loop flexibility. Likewise, the assumption that the DEF binding site is created only when the enzyme is phosphorylated [29] may be incorrect. Malleability of the A-loop also has implications for QM/MM models of catalysis, which up to now have inferred proximity of pY185 to substrate in the pre-chemistry conformation ensemble [14, 62].
The suggestion by our study that motions within the ATP-binding site can be coupled to A-loop motions may inform our understanding of binding and dissociation rates for nucleotides and small-molecule inhibitors [59]. Rigidification of target enzymes has been associated with slow-onset/slow-offset inhibition [41]. In Abl kinase, metadynamics was used to show how a resistance mutation could alter protein flexibility and shorten the residence time of imatinib [57]. In ERK2, the inhibitors Vertex-11e and SCH772984 have been shown to modulate the conformational equilibrium between the R and L states, in a manner associated with differences in the dissociation rate constant [49]. Furthermore, conformational selection by these ERK inhibitors has been shown to modulate the rate of 2P-ERK2 dephosphorylation by MAPK phosphatase 3 (MKP3/DUSP6) [43], providing a way for ATP-competitive inhibitors to control ERK inactivation by regulating exchange between A-loop populations. The ability of active ERK2 to control the flexibility of the active site by toggling between multiple conformations of the A-loop presents an intriguing new behavior to exploit for drug design.
In addition to the regulation of enzyme turnover, our findings of new A-loop conformations for 2P-ERK2 could have implications for alternative functions of ERK2. Even in its “kinase-dead” mutant state (K52R), 2P-ERK2 has been reported to allosterically activate other enzymes and bind DNA in a manner that requires dual phosphorylation [25, 46], suggesting that the A-loop fold might accommodate noncatalytic functions of ERK2. Together, these observations suggest that A-loop motions in ERK2 could help explain its multifunctional properties and broad recognition of substrates and effectors.
Materials and Methods
Preparation of structural models
Heavy-atom models of the phosphorylated (2P) and the unphosphorylated (0P) forms of ERK2 were constructed from crystal structures PDBid 2ERK, 5UMO, and 2Y9Q using HackaMol [45]. All crystal water molecules were removed. Starting states from these structures after energy minimization, described below, are referred to as 2erk_2P, 5umo_0P, and 2y9q_0P throughout; a third form of 0P-ERK2 (2erk_0P) was constructed by removing the two phosphate groups from the 2erk_2P model. Amino acid sequences for all models were referenced to that of 2ERK, omitting the first five residues in the protein sequence (MAAAA) because they were unresolved in the crystal structure. The 2Y9Q sequence was converted from the human sequence to rat, by renumbering residues (resids) and introducing a single V44L mutation using Chimera [44]; the alternative location (altloc) setting “A” was selected for all residues with multiple occupancies, which was relevant only for 2Y9Q. Missing N- and C-terminal residues of 5UMO (resids 11-14 and 355-358) and 2Y9Q (resids 6, 357 and 358) were grafted from the 2ERK structure using superposition to neighboring backbone atoms. Residues were named according to the AMBER forcefield, with protonation states assigned (by name) for pH 7. Histidine was determined to be the only ambiguous residue. The singly protonated His (HIE and HID) and doubly protonated His (HIP) forms were assigned by searching for non-carbon neighbors within 3 Å of the ND1 and NE2 atoms. Potential ring flips (HIE vs HID) during crystal modeling were considered but determined to be unnecessary; all His assignments (with the exception of H178 in 2erk_2P) were manually inspected and applied identically to all models. In each model, H139 was assigned as HIP, due to its proximity to D208. The H178 residue was assigned as HIP in 2erk_2P, due to an observed salt-bridge with E332, and assigned as HIE in 5umo_0P, 2y9q_0P, and 2erk_0P. Overall, each model contained 353 amino acids, with 5umo_0P, 2y9q_0P, and 2erk_0P being chemically identical, and 2erk_2P adding phosphates to residues T183 and Y185.
The Amber LEaP program was used to construct the starting points for each model. Each model was treated with the ff19SB force field [61] and immersed in a truncated octahedral box of OPC water molecules [56]; the edge of the box was set to satisfy a minimum of 12 Å from any protein atom. Phosphorylated residue parameters were loaded (from leaprc.phosaa19SB) as described in the Amber20 manual. Each state was neutralized with Na+ (5 ions for 2erk_2P and 2 ions each for 5umo_0P, 2y9q_0P, and 2erk_0P). A NaCl concentration of ~150 mmol/L was imposed by adding 54 Na+ and 54 Cl− ions (using the Amber LEaP addIonsRand function); the Na+ and Cl− ions were treated with the Li/Merz monovalent ion parameters for the OPC water model (frcmod.ions1lm_126_hfe_opc) [56]. There were 15,565; 15,576; 15,555; and 15,571 water molecules for 2erk_2P, 5umo_0P, 2y9q_0P, and 2erk_0P, respectively.
Molecular dynamics simulations
All calculations were carried out using the GPU-enabled CUDA version of the pmemd executable (pmemd.cuda) in AMBER Version 20 [9, 28, 53]. For 2erk_2P, 5umo_0P, and 2erk_0P, two independent production runs were carried out at 300 K and 315 K, and one run was carried out at 285 K and 330 K. Each of these consisted of (15 to 27) μs of continuous simulation and are referred to as “1° seeds”. For 2y9q_0P, four independent seeds were run independently at 300 K for 9.9 μs of continuous simulation. Nonbonded interactions were treated using a 9 Å cutoff; long-range van der Waals interactions were approximated using the Amber2020 default setting (vdwmeth = 1); long-range electrostatics were calculated using the particle mesh Ewald method [11]. The SHAKE algorithm was applied to all bonds including hydrogen to allow the 2 fs timestep [36, 52]. All starting points (2erk_2P, 5umo_0P, 2y9q_0P, and 2erk_0P) were minimized with a 10.0 kcal/mol/Å2 (1 kcal/mol/Å2 = 418.4 kJ/mol/nm2) restraint on all protein atoms using up to 15,000 steps of steepest descent. Heating and equilibration were carried out in a series of steps: first, each system was heated to 285 K for 2 ns and then run at 285 K for another 7 ns with the temperature maintained using a Langevin thermostat with a collision frequency of 5 ps−1. Next, a series of NPT equilibration steps were used to gradually reduce the protein-position restraints in four 10 ns steps; the first step retained the 10.0 kcal/mol/Å2 (1 kcal/mol/Å2 = 418.4 kJ/mol/nm2) position restraint on all protein atoms, and the next three steps applied restraints to the protein backbone atoms only, at 10 kcal/mol/Å2, 1 kcal/mol/Å2, and 0.1 kcal/mol/Å2 (1 kcal/mol/Å2 = 418.4 kJ/mol/nm2). Each system was run without restraints at 285 K for another 310 ns and then brought up to the production temperatures in 5 K increments each for 5 ns (285 K → 290 K → 295 K → 300 K → 305 K → 310 K → 315 K → 320 K → 325 K → 330 K). For 2y9q_0P, four seeds were run independently at 285 K and then heated to 300 K in 5 K increments for 5 ns. For 2erk_2P, 5umo_0P, and 2erk_0P, the additional production runs at 300 K and 315 K were equilibrated with a slightly different protocol, where the system was brought up to 300 K during the initial heating stage, and the 315 K runs were started from the 300 K runs after 10 μs, raising the temperature in 5 K increments for 5 ns. All NPT production runs used a Langevin thermostat with a collision frequency of 5 ps−1 to maintain the temperature, and a Monte Carlo barostat with a coupling constant of 2 ps to maintain the pressure at 1.01325 bar.
Additional seeds were run at 300 K, initiated from activation loop conformational states observed in the ten 1° seed production runs described above. The initial coordinates for each new seed were taken from restart files corresponding to the temporal region of the A-loop conformation; generally, the initial configuration of each consecutive new seed was taken from restart files separated by 300 ns with respect to the original trajectory. These are referred to as “2° seeds”. For 2erk_2P, eight 2° seeds were started from a long-lived conformation found in the 1° seed at 330 K; 14 seeds were started from a conformation at 285 K; and 8 seeds were started from a conformation at 300 K. For 5umo_0P, five 2° seeds were started from a conformation at 315 K where the A-loop deviated from the X-ray structure. For 2erk_0P, 8 seeds were started from a conformation at 315 K. Each 2° seed for 2erk_2P and 2erk_0P was run for 5.70 μs while the secondary seeds for 5umo_0P ranged between 4.92 and 6.30 μs. There were no 2° seeds run for 2y9q_0P. The total accumulated production sampling for all forms of ERK2, summed over all temperatures (285 K to 330 K) and seeds was 727 μs (Table 1).
In general, for both 1° and 2° seeds, each trajectory was run continuously, 300 ns at a time, and saved every 100 ps (i.e., every 50,000 steps). File system problems corrupted frames for 13 individual, 300 ns trajectories of the 1° seeds (7 in March 2021 and 6 in June 2021). The skipbadframes function of CPPTRAJ [48] was used to remove these frames with respect to integrity checks on all 353 protein residues (“check :1-353 skipbadframes” where resid 1 in the models corresponds to resid 6 for the canonical 2ERK sequence). There was no issue apparent for the restart files. Examples in Fig. S18A show total energy plots at different temperatures before and after restarts. For visualization (in VMD) and analysis, all trajectories were stripped of water and NaCl, downsampled to 2.5 ns between frames, and aligned to the respective, state-appropriate minimized 2erk_2P and 2erk_0P structures using the C, CA, and N backbone atoms excluding the activation loop (resids 170 to 186) and the ten residues at the N- and C-termini (resids 6-15 and 349-358).
Activation loop conformer search and classification via native contacts
Long-lived (≥ 5 μs) activation loop conformations were identified in the simulations that started from 2erk_2P and 2erk_0P. These were found by splitting each 1° seed trajectory into 1 μs segments and calculating the RMSF of the activation loop Cα atoms (resids 170-186) for each segment. Any contiguous segment ≥ 5 μs with an average A-loop RMSF ≤ 1.2 Å was indexed as a ”settled” A-loop conformer. New 2° seed trajectories at 300 K (described above) were initiated from frames in these segments. These criteria worked well for 2erk_2P and 2erk_0P, but were not relevant for the majority of 5umo_0P and 2y9q_0P runs, where the A-loop remained close to their crystallographic conformations with low RMSD. The additional A-loop conformation discovered in seed 2 for 5umo_0P at 315 K (5umo_0P.FL) was ≤ 1.23 Å for two 2 μs segments connected by a 1 μs segment with an average RMSF of < 1.5 Å ; the selection criteria were relaxed slightly for 5umo_0P.FL due to clearly settled region (Fig. 7B).
The A-loop conformation reference structures were defined using coordinate averaging, followed by minimization of the RMSD from the averaged structure to identify the reference frame for the trajectory. Secondary seed trajectories exhibiting the A-loop conformer for the length of the trajectory were used for 2erk_2P and 2erk_0P due to the presence of multiple A-loop conformers across seeds; the single seed with the lowest averaged A-loop RMSD (from the starting frame) was used to calculate the averaged protein structure. For the 5umo_0P and 2y9q_0P states, all 300 K seeds were used to calculate the averaged protein structure, which was then used to scan all trajectories for the reference frame.
The collective fraction of native contacts for the activation loop, was used to quantify and further refine the long-lived conformational states according to the following equation [6]:
| (1) |
where N is the number of atom-atom pairs (within 4.5 Å) between residues in the A-loop (resids 170-186) and the remainder of the protein in the reference structure (excluding neighboring resids 169 and 187); r0 is the distance for a given reference pair of atoms; and r(t) is the corresponding distance at any time t in the trajectory ( and ). Intuitively, ranges from 0 to 1. In Eq. 1, for , a contact distance will contribute ~ 1 to the sum while the sampled distance is less than the reference distance (i.e., the contact is present); the contribution drops to 0.5 as the sampled distance lengthens to 1.8 times the distance, and then further lengthening reduces the contribution to zero (i.e., the contact is not present). The sharpness of the transition is governed by the β parameter. Summing over all contacts and normalizing by the preceding 1/N yields a value between 0 (no reference contacts present) to 1 (all reference contacts present).
For time-independent analyses, all trajectories (1° and 2° seeds) at 300 K were combined and aligned to either the 2erk_2P or 2erk_0P structures, and then split into A-loop conformational state collections using a threshold for of 0.67. This threshold was selected as a conservative estimate based on visual inspection of the charts; if a frame fell below this threshold for all 2P (or 0P) reference structures, it was added to the 2erk_2P.solv (2erk_0P.solv) collection.
The calculated values for each settled state provided effective frame separation for all trajectories. For any overlapping frames (i.e. > 0.67 for more than one conformer) precedence was given to states in the order 2erk_2P.MKI, 2erk_2P.L16, then 2erk_2P.pY-R65. There were a small number of overlapping frames compared to the total (115,046) between 2erk_2P.pY-R65 and the other two states (125 and 296 overlapping frames with 2erk_2P.L16 and 2erk_2P.MKI, respectively). There were 0 overlapping frames between 2erk_2P.L16 and 2erk_2P.MKI.
Naming and color palette for conformational states
Here we summarize naming of initial states and branched A-loop conformational states used in MD simulations of 0P-ERK2 and 2P-ERK2. The names used for all 1° and 2° seeds combine the starting PDBid and the phosphorylation state in lowercase (2erk_2P, 5umo_0P, 2y9q_0P, and 2erk_0P). The resulting A-loop conformational states are enumerated as follows:
2P: 2erk_2P.MKI, 2erk_2P.L16, 2erk_2P.pY-R65, and 2erk_2P.solv
0P: 5umo_0P.MKI, 2erk_0P.Y-αC, 2y9q_0P.F/Y, 5umo_0P.FL, and 2erk_0P.solv
The color palette for the A-loop states was designed using an online resource [40] to be accessible for colorblind readers, and is provided in Fig. S18B.
Contact Map Analysis
MDAnalysis[35] was used to calculate the residue-residue contact matrices for trajectory segments (for time-dependent contact analysis) and for the state collections described above (for state-dependent contact analysis). For each frame, all distances (≤ 4.5 Å) between heavy atoms for residue pairs were calculated using the capped_distances method from the MDAnalysis Distances library. A contact between residues was counted once if any heavy atom pair was within the cutoff distance. The cutoff distance 4.5 Å was used based on recent validation studies [67]. The contact matrices had 353 rows and columns and were very sparse. For time-dependent analyses, the sparse matrices were saved for each 300 ns trajectory segment (over 2,400 segments) and indexed in a data frame. For state-dependent analyses, a single contact matrix was saved for each state frame collection.
Differences between residue-residue contact probability matrices were used to compare associated changes between states or regions of the trajectories. The associated contact probability matrices were computed from the residue-residue contact matrices normalized by the total number of frames (diagonal elements of the matrix), and accumulated across multiple trajectory segments. Two states were compared by subtracting the contact probability matrix for the initial state from that of the final state. Bar analysis R functions from the Bio3D difference contact network analysis (dCNA) project repository (https://bitbucket.org/xinqyao/dcna/src/master/) were used to generate VMD visualizations for residue-residue contact probability differences [13, 63, 67]. In the visualizations, probability differences less than 0.1 were ignored; blue (red) bars corresponded to increased (decreased) contact probability changes, going from the initial state to the final state; and the radius of the bar was proportional to the magnitude of the difference.
Fig. S19 compares the dCNA bar plots using frames (saved every 0.100 ns) and to bar plots generated from down-sampled trajectories (saved every 2.5 ns) 5umo_0P.MKI, 2y9q_0P.F/Y, and 2erk_0P.Y-αC. The quantitative agreement (Fig. S19) validated the use of the down-sampled trajectories, which were more convenient.
Structural Analysis
MDAnalysis was used to collect data frames of structural measurements for each down-sampled frame (2.5 ns between frames for continuous runs) over all states, seeds, and temperatures. Consistent with the bar analysis described above, the minimum heavy-atom distance between residue pairs was used to measure the separation between residues. Using the minimum heavy-atom distance has the advantage of simplifying the information encoded in measuring the distance; the caveat is that the identities of the atoms associated with the distance may change from frame to frame. In addition to residue-pair distances, the pseudo-dihedral angle between helices αC (resids 62-75) and αE (resids 120-140) was calculated for each frame. Two vectors, centered on the Cα atoms for each helix and scaled to the length of the helix (computed as the distance between the first and last Cα atom), were used to generate the four points for the dihedral angle.
Principal component analysis and free energy landscape projection for the kinase core
MDAnalysis was used to carry out principal component analysis (PCA)[2, 20] of the enzyme-core backbone atoms, which excludes residues in the A-loop (resids 170 to 186) and at the N- and C-termini (resids 6-15 and 349-358). PCA was carried out separately for 2P- and 0P-ERK2 simulations, using all 300 K trajectory frames (saved every 2.5 ns within each seed); these totalled 115046 (2P) and 78404 (0P) frames. The root mean square inner product (RMSIP) was used to compare the PC subspaces between 2P- and 0P-ERK2 simulations.[1, 30] The free energy surfaces were estimated in the space of the first two principal components (PC1, PC2) for each system. Two-dimensional (2D) histograms were accumulated one point at a time from each trajectory frame by projecting the frame displacement vector (deviations of core backbone atom coordinates from the mean coordinates) onto PC1 and PC2. We used 128 bins to span −80 to 80 in each PC dimension. Each 2D histogram was converted to a 2D probability estimate, by normalizing the histogram to sum to one. Each 2D free energy surface was calculated from the corresponding probability estimate,
| (2) |
relative to the maximal probability bin (). The free energy is in units of . Where possible, regions of the free energy surface were assigned to settled states of the loop using 2D histograms generated for each state. The 2D image was smoothed using the multidimensional Gaussian filter provided by the SciPy ndimage module.
RCSB Survey
All Protein Databank X-ray crystal structures corresponding to the MAPK1 gene were identified using the Search API of the RCSB (Research Collaboratory for Structural Bioinformatics, https://search.rcsb.org)[5]. The Data API of the RCSB (https://data.rcsb.org/) was then used to retrieve the corresponding metadata containing sequence information (human or rat) in order to use the sequence information referenced to rat; other information was also cached (included bound ligands, resolution, and space-group). Queries of both APIs were carried out with the user agent provided by the Perl Mojolicious web framework (mojolicious.org). The structural data were collected in November 2021.
HackaMol Perl scripts were used to carry out the analysis of the crystal structures. The coordinates of the crystal contacts within 25 Å of the asymmetric unit were reintroduced by applying the symmetry information contained in each PDB file. A translated CrysFML [47] subroutine was used for transformations between Cartesian and fractional coordinates. The crystal coordinates were all stored as chain X in the output PDB to simplify the selection of atom groups. The crystal contacts within 5 Å of specific residues including the A-loop (resids 168-186) and the MAPK insert (resids 254-259) were determined. Only the ATOM record names (and phosphorylated residues, if present) were used in the crystal contact analyses (i.e., all water or other HETATM cosolutes were ignored). PDB files containing erroneous residue numbering with respect to the listed organism were manually identified and corrected. For PDB files with multiple independent chains of the ERK2 molecule in the asymmetric unit, the crystal contacts included all other chains identified, along with crystal neighbors (e.g. in 4QP1, the chain A crystal contacts included those from chains B and X; the chain B crystal contacts included those from chains A and X).
Supplementary Material
Acknowledgments
LMP and NGA were supported by NIH award R35GM136392 (NGA). All simulations were carried out on NIST/MML GPU clusters CTCMS, Nisaba, and Simba. We are grateful to Andrew Reid, NIST, who maintains the CTCMS resources, and to Chris Muzny, NIST, who facilitated the simulation work on Nisaba and Simba, and provided valuable assistance identifying a filesystem storage solution for housing and accessing the associated large quantities of data. We are also indebted to Xin-qiu Yao, Georgia State University, for help adapting the dCNA workflow to accommodate sparse matrices.
Footnotes
Declaration of Interest: None
Use of AI and AI-assisted technology: None
CRediT Author Statement: Laurel Pegram: Conceptualization, Methodology, Software, Validation, Formal analysis, Writing - Original Draft, Review & Editing, Visualization; Demian Riccardi: Conceptualization, Methodology, Software, Validation, Formal analysis, Resources, Data Curation, Writing - Original Draft, Review & Editing, Visualization, Funding acquisition; Natalie Ahn: Conceptualization, Validation, Formal analysis, Writing - Original Draft, Review & Editing, Visualization, Supervision, Funding acquisition.
Supplemental Materials
In support of the results presented here, reference structures, analysis dataframes, dCNA visualization states, trajectory seeds (downsampled at 2.5 ns between frames stripped of solvent, total over 290,000 frames) and scripts used for analysis are available for download from https://data.nist.gov/od/id/mds2-2988. All 0P and 2P structures are aligned to the 2erk_0p and 2erk_2p minimized structures, respectively. The energy-minimized structure for 2erk_2p is very similar to that of 2erk_0p (backbone RMSD is 0.01 Å) and the crystal structure (2ERK, backbone RMSD is 0.06 Å).
This article is, in part, a contribution of NIST, and is not subject to copyright in the United States for the authors. Trade names are provided only to specify the source of information and procedures adequately and do not imply endorsement by the National Institute of Standards and Technology. Similar products by other developers may be found to work as well or better.
References
- 1.Amadei A, Ceruso MA, & Di Nola A (1999). On the convergence of the conformational coordinates basis set obtained by the essential dynamics analysis of proteins’ molecular dynamics simulations. Proteins Struct. Funct. Bioinf 36 (4), 419–424. [PubMed] [Google Scholar]
- 2.Amadei A, Linssen AB, & Berendsen HJ (1993). Essential dynamics of proteins. Proteins Struct. Funct. Bioinf 17 (4), 412–425. [DOI] [PubMed] [Google Scholar]
- 3.Ayaz P, Lyczek A, Paung Y, Mingione VR, Iacob RE, de Waal PW, Engen JR, Seeliger MA, Shan Y, & Shaw DE (2023). Structural mechanism of a drug-binding process involving a large conformational change of the protein target. Nat. Commun 14 (1), 1885. [DOI] [PMC free article] [PubMed] [Google Scholar]
- 4.Barr D, Oashi T, Burkhard K, Lucius S, Samadani R, Zhang J, Shapiro P, MacKerell AD, & van der Vaart A (2011). The importance of domain closure for the auto-activation of ERK2. Biochemistry 50 (37), 8038–8048. [DOI] [PMC free article] [PubMed] [Google Scholar]
- 5.Berman HM (2000). The Protein Data Bank. Nucleic Acids Res. 28 (1), 235–242. [DOI] [PMC free article] [PubMed] [Google Scholar]
- 6.Best RB, Hummer G, & Eaton WA (2013). Native contacts determine protein folding mechanisms in atomistic simulations. Proc. Natl. Acad. Sci. USA 110 (44), 17874–17879. [DOI] [PMC free article] [PubMed] [Google Scholar]
- 7.Burkhard KA, Chen F, & Shapiro P (2011). Quantitative analysis of ERK2 interactions with substrate proteins: Roles for kinase docking domains and activity in determining binding affinity. J. Biol. Chem 286 (4), 2477–2485. [DOI] [PMC free article] [PubMed] [Google Scholar]
- 8.Canagarajah BJ, Khokhlatchev A, Cobb MH, & Goldsmith EJ (1997). Activation mechanism of the MAP kinase ERK2 by dual phosphorylation. Cell 90 (5), 859–869. [DOI] [PubMed] [Google Scholar]
- 9.Case D, Belfon K, Ben-Shalom I, Brozell S, Cerutti D, Cheatham T, Iii V, Cruzeiro T, Darden R, Duke G, Giambasu M, Gilson H, Gohlke A, Goetz, Harris S, Izadi S, Izmailov K, Kasavajhala A, Kovalenko R, Krasny T, Kurtzman T, Lee S, Legrand P, Li C, Lin J, Liu T, Luchko R, Luo V, Man K, Merz Y, Miao O, Mikhailovskii G, Monard H, Nguyen A, Onufriev F, Pan S, Pantano R, Qi D, Roe A, Roitberg C, Sagui S, Schott-Verdugo J, Shen C, Simmerling N, Skrynnikov J, Smith J, Swails R, Walker J, Wang L, Wilson R, Wolf X, Wu Y, Xiong Y, Xue D, York P, & Kollman (2020). Amber 2020, University of California, San Francisco. [Google Scholar]
- 10.Cui Q & Karplus M (2008). Allostery and cooperativity revisited. Protein Sci. 17 (8), 1295–1307. [DOI] [PMC free article] [PubMed] [Google Scholar]
- 11.Darden T, York D, & Pedersen L (1993). Particle mesh Ewald: An N log( N ) method for Ewald sums in large systems. J. Chem. Phys 98 (12), 10089–10092. [Google Scholar]
- 12.De Bondt HL, Rosenblatt J, Jancarik J, Jones HD, Morgan DO, & Kim S-H (1993). Crystal structure of cyclin-dependent kinase 2. Nature 363 (6430), 595–602. [DOI] [PubMed] [Google Scholar]
- 13.Doshi U, Holliday MJ, Eisenmesser EZ, & Hamelberg D (2016). Dynamical network of residue–residue contacts reveals coupled allosteric effects in recognition, catalysis, and mutation. Proc. Natl. Acad. Sci. USA 113 (17), 4735–4740. [DOI] [PMC free article] [PubMed] [Google Scholar]
- 14.Ghose R. (2019). Nature of the pre-chemistry ensemble in mitogen-activated protein kinases. J. Mol. Biol 431 (2), 145–157. [DOI] [PubMed] [Google Scholar]
- 15.Gilburt JA, Sarkar H, Sheldrake P, Blagg J, Ying L, & Dodson CA (2017). Dynamic equilibrium of the Aurora A kinase activation loop revealed by single-molecule spectroscopy. Angew. Chem 129 (38), 11567–11572. [DOI] [PMC free article] [PubMed] [Google Scholar]
- 16.Gilburt JAH, Girvan P, Blagg J, Ying L, & Dodson CA (2019). Ligand discrimination between active and inactive activation loop conformations of Aurora-A kinase is unmodified by phosphorylation. Chem. Sci 10 (14), 4069–4076. [DOI] [PMC free article] [PubMed] [Google Scholar]
- 17.Hatzivassiliou G, Liu B, O’Brien C, Spoerke JM, Hoeflich KP, Haverty PM, Soriano R, Forrest WF, Heldens S, Chen H, et al. (2012). ERK inhibition overcomes acquired resistance to MEK inhibitors. Mol. Cancer Ther 11 (5), 1143–1154. [DOI] [PubMed] [Google Scholar]
- 18.Haystead TA, Dent P, Wu J, Haystead CM, & Sturgill TW (1992). Ordered phosphorylation of p42mapk by MAP kinase kinase. FEBS Lett. 306 (1), 17–22. [DOI] [PubMed] [Google Scholar]
- 19.Hoofnagle AN, Resing KA, Goldsmith EJ, & Ahn NG (2001). Changes in protein conformational mobility upon activation of extracellular regulated protein kinase-2 as detected by hydrogen exchange. Proc. Natl. Acad. Sci. USA 98 (3), 956–961. [DOI] [PMC free article] [PubMed] [Google Scholar]
- 20.Ichiye T & Karplus M (1991). Collective motions in proteins: a covariance analysis of atomic fluctuations in molecular dynamics and normal mode simulations. Proteins Struct. Funct. Bioinf 11 (3), 205–217. [DOI] [PubMed] [Google Scholar]
- 21.Iverson DB, Xiao Y, Jones DN, Eisenmesser EZ, & Ahn NG (2020). Activation loop dynamics are coupled to core motions in extracellular signal-regulated kinase-2. Biochemistry 59 (29), 2698–2706. [DOI] [PMC free article] [PubMed] [Google Scholar]
- 22.Jorgensen WL, Chandrasekhar J, Madura JD, Impey RW, & Klein ML (1983). Comparison of simple potential functions for simulating liquid water. J. Chem. Phys 79 (2), 926–935. [Google Scholar]
- 23.Kondrashov DA, Zhang W, Aranda R IV, Stec B, & Phillips GN Jr., (2008). Sampling of the native conformational ensemble of myoglobin via structures in different crystalline environments. Proteins Struct. Funct. Bioinf 70 (2), 353–362. [DOI] [PubMed] [Google Scholar]
- 24.Kornev AP, Haste NM, Taylor SS, & Ten Eyck LF (2006). Surface comparison of active and inactive protein kinases identifies a conserved activation mechanism. Proc. Natl. Acad. Sci. USA 103 (47), 17783–17788. [DOI] [PMC free article] [PubMed] [Google Scholar]
- 25.Kung J & Jura N (2016). Structural basis for the non-catalytic functions of protein kinases. Structure 24 (1), 7–24. [DOI] [PMC free article] [PubMed] [Google Scholar]
- 26.Kuzmanic A, Sutto L, Saladino G, Nebreda AR, Gervasio FL, & Orozco M (2017). Changes in the free-energy landscape of p38α MAP kinase through its canonical activation and binding events as studied by enhanced molecular dynamics simulations. eLife 6, e22175. [DOI] [PMC free article] [PubMed] [Google Scholar]
- 27.Lavoie H, Gagnon J, & Therrien M (2020). ERK signalling: a master regulator of cell behaviour, life and fate. Nat. Rev. Mol. Cell Biol 21 (10), 607–632. [DOI] [PubMed] [Google Scholar]
- 28.Le Grand S, Götz AW, & Walker RC (2013). SPFP: Speed without compromise—A mixed precision model for GPU accelerated molecular dynamics simulations. Comput. Phys. Commun 184 (2), 374–380. [Google Scholar]
- 29.Lee T, Hoofnagle AN, Kabuyama Y, Stroud J, Min X, Goldsmith EJ, Chen L, Resing KA, & Ahn NG (2004). Docking motif interactions in MAP kinases revealed by hydrogen exchange mass spectrometry. Mol. Cell 14 (1), 43–55. [DOI] [PubMed] [Google Scholar]
- 30.Leo-Macias A, Lopez-Romero P, Lupyan D, Zerbino D, & Ortiz AR (2005). An analysis of core deformations in protein superfamilies. Biophys. J 88 (2), 1291–1299. [DOI] [PMC free article] [PubMed] [Google Scholar]
- 31.Lopez ED, Burastero O, Arcon JP, Defelipe LA, Ahn NG, Marti MA, & Turjanski AG (2020). Kinase activation by small conformational changes. J. Chem. Inf. Model 60 (2), 821–832. [DOI] [PMC free article] [PubMed] [Google Scholar]
- 32.Mace PD, Wallez Y, Egger MF, Dobaczewska MK, Robinson H, Pasquale EB, & Riedl SJ (2013). Structure of ERK2 bound to PEA-15 reveals a mechanism for rapid release of activated MAPK. Nat. Commun 4 (1), 1681. [DOI] [PMC free article] [PubMed] [Google Scholar]
- 33.Majumdar A, Burban DJ, Muretta JM, Thompson AR, Engel TA, Rasmussen DM, Subrahmanian MV, Veglia G, Thomas DD, & Levinson NM (2021). Allostery governs Cdk2 activation and differential recognition of CDK inhibitors. Nat. Chem. Biol 17 (4), 456–464. [DOI] [PMC free article] [PubMed] [Google Scholar]
- 34.Meng Y & Roux B (2014). Locking the active conformation of c-Src kinase through the phosphorylation of the activation loop. J. Mol. Biol 426 (2), 423–435. [DOI] [PMC free article] [PubMed] [Google Scholar]
- 35.Michaud-Agrawal N, Denning EJ, Woolf TB, & Beckstein O (2011). MDAnalysis: A toolkit for the analysis of molecular dynamics simulations. J. Comp. Chem 32 (10), 2319–2327. [DOI] [PMC free article] [PubMed] [Google Scholar]
- 36.Miyamoto S & Kollman PA (1992). Settle: An analytical version of the SHAKE and RATTLE algorithm for rigid water models. J. Comp. Chem 13 (8), 952–962. [Google Scholar]
- 37.Modi V & Dunbrack RL (2019). Defining a new nomenclature for the structures of active and inactive kinases. Proc. Natl. Acad. Sci. USA 116 (14), 6818–6827. [DOI] [PMC free article] [PubMed] [Google Scholar]
- 38.Morris EJ, Jha S, Restaino CR, Dayananth P, Zhu H, Cooper A, Carr D, Deng Y, Jin W, Black S, et al. (2013). Discovery of a novel ERK inhibitor with activity in models of acquired resistance to BRAF and MEK inhibitors. Cancer Discov. 3 (7), 742–750. [DOI] [PubMed] [Google Scholar]
- 39.Nguyen T, Ruan Z, Oruganty K, & Kannan N (2015). Co-conserved MAPK features couple D-domain docking groove to distal allosteric sites via the C-terminal flanking tail. PLoS ONE 10 (3), e0119636. [DOI] [PMC free article] [PubMed] [Google Scholar]
- 40.Nichols D. (a). Coloring for Colorblindness. https://davidmathlogic.com/colorblind/#%23332288-%23117733-%2344AA99-%2388CCEE-%23DDCC77-%23CC6677-%23AA4499-%23882255.
- 41.Pan AC, Borhani DW, Dror RO, & Shaw DE (2013). Molecular determinants of drug–receptor binding kinetics. Drug Discovery Today 18 (13-14), 667–673. [DOI] [PubMed] [Google Scholar]
- 42.Pegram LM, Anderson JW, & Ahn NG (2021). Dynamic equilibria in protein kinases. Curr. Opin. Struct. Biol 71, 215–222. [DOI] [PMC free article] [PubMed] [Google Scholar]
- 43.Pegram LM, Liddle JC, Xiao Y, Hoh M, Rudolph J, Iverson DB, Vigers GP, Smith D, Zhang H, Wang W, Moffat JG, & Ahn NG (2019). Activation loop dynamics are controlled by conformation-selective inhibitors of ERK2. Proc. Natl. Acad. Sci. USA 116 (31), 15463–15468. [DOI] [PMC free article] [PubMed] [Google Scholar]
- 44.Pettersen EF, Goddard TD, Huang CC, Couch GS, Greenblatt DM, Meng EC, & Ferrin TE (2004). UCSF Chimera - A visualization system for exploratory research and analysis. J. Comp. Chem 25 (13), 1605–1612. [DOI] [PubMed] [Google Scholar]
- 45.Riccardi D, Parks JM, Johs A, & Smith JC (2015). HackaMol: An object-oriented modern Perl library for molecular hacking on multiple scales. J. Chem. Inf. Model 55 (4), 721–726. [DOI] [PubMed] [Google Scholar]
- 46.Rodríguez J & Crespo P (2011). Working Without Kinase Activity: Phosphotransfer-Independent Functions of Extracellular Signal–Regulated Kinases. Sci. Signaling 4 (196). [DOI] [PubMed] [Google Scholar]
- 47.Rodríguez-Carvajal J & González-Platas J (2005). CrysFML: a library to develop crystallographic programs in Fortran 95. Powder diffraction examples. Acta Crystallogr., Sect. A: Found. Crystallogr 61 (a1), c22–c22. [Google Scholar]
- 48.Roe DR & Cheatham TE (2013). PTRAJ and CPPTRAJ: Software for processing and analysis of molecular dynamics trajectory data. J. Chem. Theory Comput 9 (7), 3084–3095. [DOI] [PubMed] [Google Scholar]
- 49.Rudolph J, Xiao Y, Pardi A, & Ahn NG (2015). Slow inhibition and conformation selective properties of extracellular signal-regulated kinase 1 and 2 inhibitors. Biochemistry 54 (1), 22–31. [DOI] [PMC free article] [PubMed] [Google Scholar]
- 50.Ruff EF, Muretta JM, Thompson AR, Lake EW, Cyphers S, Albanese SK, Hanson SM, Behr JM, Thomas DD, Chodera JD, & Levinson NM (2018). A dynamic mechanism for allosteric activation of Aurora kinase A by activation loop phosphorylation. eLife 7, e32766. [DOI] [PMC free article] [PubMed] [Google Scholar]
- 51.Ryan MB, Der CJ, Wang-Gillam A, & Cox AD (2015). Targeting RAS-mutant cancers: Is ERK the key? Trends Cancer 1 (3), 183–198. [DOI] [PMC free article] [PubMed] [Google Scholar]
- 52.Ryckaert J-P, Ciccotti G, & Berendsen HJ (1977). Numerical integration of the cartesian equations of motion of a system with constraints: molecular dynamics of n-alkanes. J. Comp. Phys 23 (3), 327–341. [Google Scholar]
- 53.Salomon-Ferrer R, Götz AW, Poole D, Le Grand S, & Walker RC (2013). Routine microsecond molecular dynamics simulations with AMBER on GPUs. 2. Explicit solvent particle mesh Ewald. J. Chem. Theory Comput 9 (9), 3878–3888. [DOI] [PubMed] [Google Scholar]
- 54.Sang D, Pinglay S, Wiewiora RP, Selvan ME, Lou HJ, Chodera JD, Turk BE, Gümüş ZH, & Holt LJ (2019). Ancestral reconstruction reveals mechanisms of ERK regulatory evolution. eLife 8, e38805. [DOI] [PMC free article] [PubMed] [Google Scholar]
- 55.Seger R & Krebs EG (1995). The MAPK signaling cascade. FASEB J. 9 (9), 726–735. [PubMed] [Google Scholar]
- 56.Sengupta A, Li Z, Song LF, Li P, & Merz KM (2021). Parameterization of monovalent ions for the OPC3, OPC, TIP3P-FB, and TIP4P-FB water models. J. Chem. Inf. Model 61 (2), 869–880. [DOI] [PMC free article] [PubMed] [Google Scholar]
- 57.Shekhar M, Smith Z, Seeliger MA, & Tiwary P (2022). Protein flexibility and dissociation pathway differentiation can explain onset of resistance mutations in kinases. Angew. Chem. Int. Ed 61 (28), e202200983. [DOI] [PMC free article] [PubMed] [Google Scholar]
- 58.Skora L, Mestan J, Fabbro D, Jahnke W, & Grzesiek S (2013). NMR reveals the allosteric opening and closing of Abelson tyrosine kinase by ATP-site and myristoyl pocket inhibitors. Proc. Natl. Acad. Sci. USA 110 (47), E4437–E4445. [DOI] [PMC free article] [PubMed] [Google Scholar]
- 59.Stachowski TR & Fischer M (2022). Large-scale ligand perturbations of the protein conformational landscape reveal state-specific interaction hotspots. J. Med. Chem 65 (20), 13692–13704. [DOI] [PMC free article] [PubMed] [Google Scholar]
- 60.Taylor SS, Meharena HS, & Kornev AP (2019). Evolution of a dynamic molecular switch. IUBMB Life 71 (6), 672–684. [DOI] [PMC free article] [PubMed] [Google Scholar]
- 61.Tian C, Kasavajhala K, Belfon KAA, Raguette L, Huang H, Migues AN, Bickel J, Wang Y, Pincay J, Wu Q, & Simmerling C (2020). ff19SB: Amino-acid-specific protein backbone parameters trained against quantum mechanics energy surfaces in solution. J. Chem. Theory Comput 16 (1), 528–552. [DOI] [PubMed] [Google Scholar]
- 62.Turjanski AG, Hummer G, & Gutkind JS (2009). How mitogen-activated protein kinases recognize and phosphorylate their targets: A QM/MM study. J. Am. Chem. Soc 131 (17), 6141–6148. [DOI] [PMC free article] [PubMed] [Google Scholar]
- 63.Vu PJ, Yao X-Q, Momin M, & Hamelberg D (2018). Unraveling allosteric mechanisms of enzymatic catalysis with an evolutionary analysis of residue–residue contact dynamical changes. ACS Catal. 8 (3), 2375–2384. [Google Scholar]
- 64.Xiao Y, Lee T, Latham MP, Warner LR, Tanimoto A, Pardi A, & Ahn NG (2014). Phosphorylation releases constraints to domain motion in ERK2. Proc. Natl. Acad. Sci. USA 111 (7), 2506–2511. [DOI] [PMC free article] [PubMed] [Google Scholar]
- 65.Xie T, Saleh T, Rossi P, & Kalodimos CG (2020). Conformational states dynamically populated by a kinase determine its function. Science 370 (6513), eabc2754. [DOI] [PMC free article] [PubMed] [Google Scholar]
- 66.Xu W, Doshi A, Lei M, Eck MJ, & Harrison SC (1999). Crystal structures of c-Src reveal features of its autoinhibitory mechanism. Mol. Cell 3 (5), 629–638. [DOI] [PubMed] [Google Scholar]
- 67.Yao X-Q, Momin M, & Hamelberg D (2018). Elucidating allosteric communications in proteins with difference contact network analysis. J. Chem. Inf. Model 58 (7), 1325–1330. [DOI] [PubMed] [Google Scholar]
- 68.Yuan Y, Deng J, & Cui Q (2022). Molecular dynamics simulations establish the molecular basis for the broad allostery hotspot distributions in the tetracycline repressor. J. Am. Chem. Soc 144 (24), 10870–10887. [DOI] [PMC free article] [PubMed] [Google Scholar]
- 69.Zhang F, Strand A, Robbins D, Cobb MH, & Goldsmith EJ (1994). Atomic structure of the MAP kinase ERK2 at 2.3 A resolution. Nature 367 (6465), 704–711. [DOI] [PubMed] [Google Scholar]
Associated Data
This section collects any data citations, data availability statements, or supplementary materials included in this article.