. 2020 Apr 12;147(8):dev184655. doi: 10.1242/dev.184655

Fig. 3.

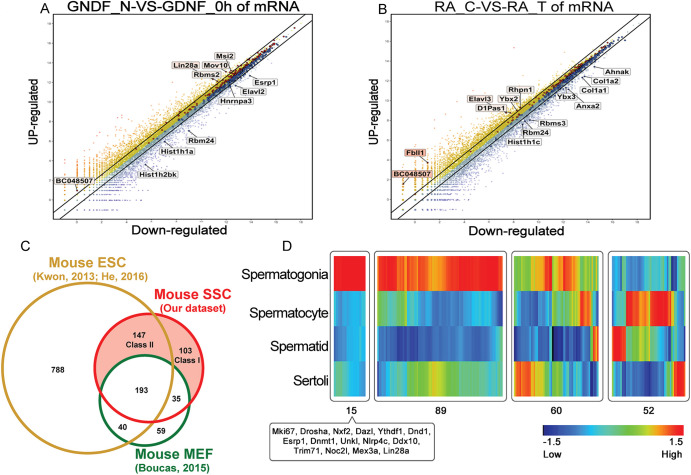
Fig. 3. Expression profiles of mRBPome-captured proteins in undifferentiated spermatogonia. (A,B) Scatter plots of gene expression for candidate RBPs in undifferentiated spermatogonia in response to GDNF (A) or RA (B) signaling as measured by microarray analysis (taken from Wang et al., 2017). Each dot represents individual gene identifiers with upregulated genes shown in yellow/red and downregulated genes shown in blue. (C) Venn diagram comparing undifferentiated spermatogonial mRBPome-captured proteins (labeled as SSC here) with mRBPome-captured proteins in MEFs (taken from Boucas et al., 2015) and mouse ESCs (Kwon et al., 2013; He et al., 2016). (D) Heatmap depiction of gene expression levels for candidate undifferentiated spermatogonia mRBPome-captured proteins in different mouse testicular cell types.

Expression profiles of mRBPome-captured proteins in undifferentiated spermatogonia. (A,B) Scatter plots of gene expression for candidate RBPs in undifferentiated spermatogonia in response to GDNF (A) or RA (B) signaling as measured by microarray analysis (taken from Wang et al., 2017). Each dot represents individual gene identifiers with upregulated genes shown in yellow/red and downregulated genes shown in blue. (C) Venn diagram comparing undifferentiated spermatogonial mRBPome-captured proteins (labeled as SSC here) with mRBPome-captured proteins in MEFs (taken from Boucas et al., 2015) and mouse ESCs (Kwon et al., 2013; He et al., 2016). (D) Heatmap depiction of gene expression levels for candidate undifferentiated spermatogonia mRBPome-captured proteins in different mouse testicular cell types.