

Abstract
Objective
To investigate the potential correlation between piwi-like RNA-mediated gene silencing 1 (PIWIL1) polymorphisms and susceptibility to epithelial ovarian cancer (EOC).
Methods
A case–control study was conducted to evaluate the susceptibility of EOC using multinomial logistic regression analysis. The study analyzed the relationship between five functional single nucleotide polymorphisms (SNPs) in the PIWIL1 gene and EOC risk. Genotyping of 288 cases and 361 healthy samples from South China was identified using a TaqMan assay. Odds ratios (ORs) and 95% confidence intervals (CIs) were calculated to estimate the relationship between the five selected SNPs and EOC susceptibility.
Results
Among the five SNPs analyzed, the rs10848087 G > A and rs7957349 G > C variants significantly increased the susceptibility of EOC, rs10773771 C > T was associated with a decreased risk of EOC, while the rs35997018 and rs1106042 variants were not in Hardy–Weinberg equilibrium (p < 0.05). The rs10848087 G > A was significantly associated with increased risk of EOC in individuals with metastasis, FIGO stage I and III, low and high pathological grade, tumor numbers ≤ 3 and > 3, tumor size > 3 cm and ≤ 3 cm, pregnant more than 3 times, pre-menopausal status, and strong positive expression of ER (estrogen receptor), PR (progesterone receptor), PAX8 (paired-box 8), wild-type p53 (tumor protein 53), WT1 (Wilm’s tumor gene), P16 (cyclin-dependent kinase inhibitor 2A). In addition, rs10848087 G > A enhanced the EOC risk of cases with negative/mild positive expression of wild p53 and Ki67, and with or without mutant p53 expression. The rs7957349 G > C variant was linked to an increased risk of EOC in subgroups with certain characteristics, including age equal or less than 53 years, metastasis, clinical stage I, low pathological grade, tumor number, tumor size, pregnant times, post-menopause, pre-menopause, and strong positive expression of wild p53 and Ki67 (Antigen identified by monoclonal antibody Ki-67), as well as without mutant p53 expression. The rs10773771 CT/TT alleles were identified to have a protective effect on EOC in women aged 53 years or older, as well as in cases with metastasis, advanced clinical stage, high pathological grade, multiple tumors, tumor size equal to or less than 3 cm, history of pregnancy, post-menopausal status, and strong positive expression of ER, PR, wild-type p53, PAX8, WT1, P16, and Ki67. Furthermore, rs10773771 CT/TT also showed a protective effect in patients with negative or mildly positive expression of PR, PAX8, wild-type p53, WT1, and P16, as well as positive expression of mutant p53. Compared to the reference haplotype GCG, individuals harboring haplotypes GTG were found to have a significantly decreased susceptibility to EOC. PIWIL1 was significantly expressed in the thyroid, pituitary, and adrenal glands with rs7957349 CC alleles.
Conclusions
PIWIL1 rs10848087 and rs7957349 were associated with increased risk of EOC, while rs10773771 may have a protective effect against EOC. These genetic variants may serve as potential biomarkers for EOC susceptibility in the South China population.
Supplementary Information
The online version contains supplementary material available at 10.1186/s12885-023-11651-2.
Keywords: Epithelial ovarian cancer, PIWIL1, PiRNA, Susceptibility, Polymorphism
Introduction
Ovarian cancer is the second most common cause of gynecologic cancer death in women worldwide [1]. There are three major types of ovarian cancer-epithelial, germ cell, and sex cord-stromal tumors. Epithelial ovarian cancer (EOC) is a highly heterogeneous phenotype with five major histotypes for invasive disease-high-grade serous, low-grade serous, endometrioid, clear cell, and mucinous histotype [2]. It accounts for approximately 3.4% and 4.7% of new cancer cases and deaths among women worldwide [3]. Unfortunately, due to the lack of specific clinical manifestations and mature screening techniques in the early stage, most EOC cases are already diagnosed in the late stage (advanced III-IV), and cancer has already spread and metastasized in the abdominal cavity [4]. As a result, approximately 70% of cases have reached the late stage without early warning symptoms [5]. The 5-year survival rate for this disease is around 45% [6], which is relatively low due to poor pathological features resulting in limited clinical efficacy [7].
Early diagnosis is an optimal strategy for enhancing the dismal survival rates associated with ovarian cancer. If the disease is detected at early stages (IA and IB), characterized by small or localized tumors, approximately 93% of patients can achieve a five-year survival rate after diagnosis [8, 9]. Diagnostic testing for symptomatic individuals includes physical examination and radiological imaging techniques such as transvaginal ultrasound (TVUS). However, there are currently no available screening strategies for asymptomatic women to detect ovarian cancer in its early stages. The most promising screening tools presently include the cancer antigen 125 (CA125) blood test and TVUS [10, 11]. Additionally, human epididymis protein 4 (HE4) has been investigated as a potential biomarker for ovarian cancer screening; however, further studies are warranted [10]. The medical and surgical treatment strategies for epithelial ovarian cancer in women are continuously evolving. In recent years, significant progress has been achieved, supported by groundbreaking clinical trials. Although the treatment of primary epithelial ovarian cancer still involves a combination of surgery and systemic therapy, there is now a standardization of more intricate surgical procedures and novel therapeutic approaches [12, 13]. Cytotoxic chemotherapy and maximal surgical efforts remain the mainstream approach; however, targeted therapies are increasingly being utilized as well, while new data have raised questions regarding the role of surgery in women with recurrent disease [14, 15]. Poly-ADP-ribose polymerase inhibitors have demonstrated improved progression-free survival rates in both first-line and recurrent patients, leading to their increasing utilization [16]. The recent classification based on genetic alterations further emphasizes the recommendation for germline genetic testing in all women diagnosed with epithelial ovarian cancer [17–20], while new drug approvals driven by biomarker analysis suggest potential benefits from somatic molecular testing as well.
PIWIL1, piwi-like RNA-mediated gene silencing 1, a member of the PIWI subfamily of Argonaute proteins, is involved in stem cell self-renewal, RNA silencing, and translational regulation in various organisms. PIWIL1 may, as an oncogene, be overexpressed in multiple types of tumors, such as gastric cancer [21], lung cancer [22], hepatocellular carcinoma [4], pancreatic adenocarcinoma [23], and endometrial cancer [24]. PIWIL1 Knocking out the PIWIL1 gene (PIWIL1-KO) has significantly reduced gastric cancer cell proliferation, migration, metastasis, and tumorigenesis [21, 25]. In pancreatic ductal adenocarcinomas, Feng Li et al. [26] discovered that human PIWIL1 functions as an oncoprotein, activating the anaphase-promoting complex/cyclosome E3 complex in the absence of piRNAs, this complex targets a critical cell adhesion-related protein to enhance PDAC metastasis. Cheng et al. [27] observed that the RASSF1C-PIWI-piRNA pathway promotes lung cancer cell growth and progression and suggests that PIWIL1 protein is abnormally expressed in various types of cancer, making it a potential biomarker and therapeutic target. Wen et al. [28] reveal that Piwil serves as a crucial regulator gene in germ cell division during gonadal development and is closely associated with germ cell differentiation. A total of 219, 256, and 234 piRNAs were detected in normal ovary, endometrioid, and serous ovarian cancer samples, respectively. The functional analysis of the predicted targets of differentially expressed piRNAs revealed their potential to modulate key processes and pathways involved in ovarian oncogenesis [29]. However, it is important to note that these findings are just the tip of the iceberg, as the relationships between the piRNA pathway and ovarian cancer progression have not yet been extensively studied.
Additionally, allele-specific DNA methylation differences at regulatory sites of genes involved in piRNA regulation have been linked to impaired spermatogenesis [30]. While a single-nucleotide polymorphisms study (SNPs) has shown that the GG genotype and G allele of rs28416520 within the PIWIL1 gene promoter CpG 67 region are associated with an increased risk of gastric cancer [31], the impact of SNPs of PIWIL1 gene on EOC risk has not been studied.
The predominant histological subtypes of ovarian cancer encompass high-grade serous carcinoma, low-grade serous carcinoma, endometrioid carcinoma, clear cell carcinoma, and mucinous carcinoma. Nuclear antigens comprise cell cycle-associated proteins (such as P16 and Ki-67), tumor suppressor gene products (such as p53 and WT1), and steroid hormone receptors (such as ER and PR). Notably, the expression patterns of WT1, ER, PR, mutant P53, and wild-type P53 can effectively discriminate between different types of ovarian cancer [32, 33]. PAX8 can be used to distinguish primary ovarian cancer from metastatic cancer [34, 35]. Additionally, PAX8 can serve as a useful tool in distinguishing primary ovarian cancer from metastatic cancer [34, 35]. In the context of ovarian cancer prognosis analysis, increased expression of p16 and Ki67 has been associated with more aggressive tumor growth patterns and poorer clinical outcomes [36]. These aforementioned markers have been employed in our stratification analysis.
Given the evidence that the PIWIL1 gene promoted tumorigenesis, we conducted a three-center case–control study to explore the association between genetic variations in the PIWIL1 gene and the risk of EOC in southern Chinese women.
Materials and methods
Patients and healthy controls
A total of 288 EOC patients and 361 healthy controls, ranging from 20 to 88 years old, were recruited from Guangzhou Women and Children's Medical Center, Shunde Hospital of Southern Medical University, and The First Affiliated Hospital of Jinan University between 2016 and 2022. The diagnosis was confirmed by two pathologists independently, and tumors were classified according to the WHO Classification of Tumors of the female genital tract [37]. All participants in this study provided written informed consent, and the Ethics Committee of Guangzhou Women and Children's Medical Center (117A01) and Shunde Hospital of Southern Medical University (KYLS20220903) approved the research. The experiments were conducted by the Declaration of Helsinki. The demographic characteristics of all participants are presented in Table S1. The PIWIL1 gene SNPs rs10848087 G > A, rs7957349 G > C, and rs10773771 C > T were stratified based on various factors including age, metastasis, clinical stage, pathological grade, tumor number, tumor size, pregnancy history, menopausal status, and expression levels of ER, PR, PAX8, wild-type p53, mutant p53, WT1, P16, and Ki67 (refer to Table 2 for details).
Table 2.
Stratification analysis of PIWIL1 polymorphisms with EOC susceptibility
| Variables | rs10848087 G > A | Adjusted ORa | Pa | rs7957349 G > C | Adjusted ORa | Pa | rs10773771 C > T | Adjusted ORa | Pa | |||
|---|---|---|---|---|---|---|---|---|---|---|---|---|
| (cases/controls) | (95% CI) | (cases/controls) | (95% CI) | (cases/controls) | (95% CI) | |||||||
| GG/GA | AA | GG/GC | CC | CC | CT/TT | |||||||
| Age, years | ||||||||||||
| > 53 | 112/347 | 7/3 | 3.060 (0.720–13.010) | 0.1298 | 103/340 | 12/13 | 2.445 (0.832–7.186) | 0.1040 | 51/130 | 45/223 | 0.390 (0.221–0.688) | 0.0012 |
| ≤ 53 | 129/347 | 5/3 | > 999.999(< 0.001, > 999.999) | 0.9754 | 121/340 | 14/13 | 3.399 (1.387–8.326) | 0.0074 | 55/130 | 61/223 | 0.729 (0.467–1.139) | 0.1656 |
| Metastasis | ||||||||||||
| Yes | 84/347 | 6/3 | 8.919 (2.141–37.165) | 0.0027 | 78/340 | 11/13 | 3.622 (1.542–8.511) | 0.0031 | 41/130 | 39/223 | 0.529 (0.322–0.870) | 0.0121 |
| No | 140/347 | 5/3 | 4.232 (0.981–18.253) | 0.0530 | 131/340 | 14/13 | 2.752 (1.250–6.058) | 0.0119 | 59/130 | 65/223 | 0.624 (0.411–0.947) | 0.0267 |
| Clinical stage | ||||||||||||
| 1 | 55/347 | 3/3 | 7.301 (1.348–39.537) | 0.0211 | 47/340 | 11/13 | 5.870 (2.428–14.191) | < 0.0001 | 18/130 | 27/223 | 0.814 (0.427–1.552) | 0.5329 |
| 2 | 41/347 | 2/3 | 5.983 (0.962–37.200) | 0.0550 | 41/340 | 4/13 | 2.452 (0.760–7.919) | 0.1336 | 17/130 | 22/223 | 0.736 (0.376–1.441) | 0.3715 |
| 3 | 84/347 | 4/3 | 6.490 (1.403–30.022) | 0.0167 | 79/340 | 5/13 | 1.680 (0.576–4.903) | 0.3424 | 46/130 | 36/223 | 0.433 (0.264–0.709) | 0.0009 |
| 4 | 24/347 | 1/3 | 4.902 (0.490–49.086) | 0.1763 | 21/340 | 2/13 | 2.480 (0.524–11.746) | 0.2522 | 10/130 | 12/223 | 0.684 (0.286–1.634) | 0.3923 |
| Pathological grade | ||||||||||||
| low | 70/347 | 3/3 | 5.908 (1.143–30.546) | 0.0341 | 65/340 | 8/13 | 3.033 (1.200–7.664) | 0.0190 | 23/130 | 28/223 | 0.672 (0.369–1.224) | 0.1942 |
| high | 148/347 | 9/3 | 6.718 (1.770–25.493) | 0.0051 | 143/340 | 11/13 | 1.976 (0.852–4.581) | 0.1125 | 71/130 | 71/223 | 0.563 (0.378–0.839) | 0.0048 |
| Tumor number | ||||||||||||
| single | 73/347 | 3/3 | 5.443 (1.016–29.161) | 0.0479 | 70/340 | 11/13 | 4.063 (1.719–9.634) | 0.0014 | 28/130 | 30/223 | 0.586 (0.332–1.034) | 0.0652 |
| multiple | 108/347 | 4/3 | 4.602 (1.008–21.012) | 0.0488 | 94/340 | 9/13 | 2.490 (1.028–6.029) | 0.0432 | 53/130 | 49/223 | 0.520 (0.332–0.815) | 0.0043 |
| Tumor size | ||||||||||||
| > 3 cm | 63/347 | 4/3 | 6.503 (1.381–30.615) | 0.0178 | 57/340 | 7/13 | 3.019 (1.137–8.018) | 0.0266 | 26/130 | 24/223 | 0.523 (0.287–0.953) | 0.0343 |
| ≤ 3 cm | 158/347 | 7/3 | 5.523 (1.392–21.912) | 0.0151 | 146/340 | 17/13 | 3.024 (1.421–6.434) | 0.0041 | 74/130 | 67/223 | 0.503 (0.337–0.751) | 0.0008 |
| Pregnant times | ||||||||||||
| ≤ 3 | 104/347 | 7/3 | 7.386 (0.650–29.486) | 0.0046 | 96/340 | 14/13 | 3.768 (1.697–8.368) | 0.0011 | 45/130 | 49/223 | 0.609 (0.383–0.969) | 0.0363 |
| > 3 | 137/347 | 5/3 | 4.725 (1.096–20.367) | 0.0373 | 128/340 | 12/13 | 2.359 (1.039–5.354) | 0.0402 | 61/130 | 67/223 | 0.532 (0.348–0.813) | 0.0036 |
| Pausimenia | ||||||||||||
| post-menopause | 177/347 | 7/3 | 3.601 (0.861–15.066) | 0.0793 | 159/340 | 19/13 | 3.020 (1.394–6.544) | 0.0051 | 80/130 | 72/223 | 0.485 (0.323–0.728) | 0.0005 |
| pre-menopause | 64/347 | 5/3 | 6.172 (1.437–26.516) | 0.0144 | 65/340 | 7/13 | 3.163 (1.106–9.048) | 0.0317 | 26/130 | 34/223 | 0.860 (0.485–1.523) | 0.6048 |
| ER expression | ||||||||||||
| negtive/mild positive | 34/347 | 1/3 | .0792 (0.370–38.864) | 0.2617 | 32/340 | 3/13 | 2.262 (0.602–8.507) | 0.2269 | 14/130 | 12/223 | 0.455 (0.202–1.025) | 0.0575 |
| strong positive | 67/347 | 3/3 | 6.232 (1.202–32.300) | 0.0293 | 63/340 | 4/13 | 1.546 (0.484–4.936) | 0.4622 | 37/130 | 24/223 | 0.355 (0.202–0.625) | 0.0003 |
| PR expression | ||||||||||||
| negtive/mild positive | 34/347 | 1/3 | 3.526 (0.354–35.080) | 0.2823 | 32/340 | 3/13 | 2.418 (0.653–8.948) | 0.1860 | 17/130 | 14/223 | 0.466 (0.222–0.981) | 0.0443 |
| strong positive | 38/347 | 2/3 | 6.584 (1.048–41.362) | 0.0444 | 37/340 | 4/13 | 2.771 (0.857–8.961) | 0.0887 | 20/130 | 15/223 | 0.428 (0.211–0.868) | 0.0187 |
| PAX8 expression | ||||||||||||
| negtive/mild positive | 28/347 | 1/3 | 4.394 (0.435–44.426) | 0.2099 | 27/340 | 1/13 | 0.945 (0.118–7.555) | 0.9572 | 18/130 | 8/223 | 0.245 (0.103–0.583) | 0.0015 |
| strong positive | 62/347 | 3/3 | 5.885 (1.164–30.005) | 0.0330 | 62/340 | 2/13 | 0.840 (0.185–3.822) | 0.8219 | 34/130 | 26/223 | 0.427 (0.244–0.748) | 0.0029 |
| Wild p53 expression | ||||||||||||
| negtive/mild positive | 59/347 | 4/3 | 6.172 (1.773–37.671) | 0.0071 | 57/340 | 3/13 | 1.383 (0.381–5.017) | 0.6217 | 33/130 | 29/223 | 0.502 (0.291–0.868) | 0.0136 |
| strong positive | 182/347 | 8/3 | 4.717 (1.210–18.395) | 0.0255 | 167/340 | 23/13 | 3.460 (1.693–7.072) | 0.0007 | 73/130 | 77/223 | 0.603 (0.407–0.893) | 0.0116 |
| Mutant p53 expression | ||||||||||||
| Yes | 112/347 | 5/3 | 5.723 (1.326–24.700) | 0.0194 | 110/340 | 7/13 | 1.624 (0.626–4.211) | 0.3190 | 57/130 | 46/223 | 0.450 (0.287–0.706) | 0.0005 |
| No | 129/347 | 7/3 | 5.969 (1.496–23.817) | 0.0114 | 114/340 | 19/13 | 4.254 (20.19–8.963) | 0.0001 | 49/130 | 60/223 | 0.700 (0.451–1.085) | 0.1108 |
| WT1 expression | ||||||||||||
| negtive/mild positive | 34/347 | 1/3 | 3.712 (0.366–37.673) | 0.2674 | 33/340 | 3/13 | 2.320 (0.622–8.652) | 0.2102 | 20/130 | 9/223 | 0.240 (0.105–0.549) | 0.0007 |
| strong positive | 74/347 | 6/3 | 10.408 (2.511–43.135) | 0.0012 | 75/340 | 4/13 | 1.426 (0.450–4.518) | 0.5467 | 38/130 | 34/223 | 0.491 (0.293–0.825) | 0.0072 |
| P16 expression | ||||||||||||
| negtive/mild positive | 36/347 | 1/3 | 3.506 (0.346–35.542) | 0.2885 | 34/340 | 3/13 | 2.251 (0.603–8.402) | 0.2272 | 20/130 | 11/223 | 0.294 (0.135–0.641) | 0.0021 |
| strong positive | 66/347 | 7/3 | 12.751 (3.190–50.966) | 0.0003 | 64/340 | 6/13 | 2.424 (0.884–6.644) | 0.0854 | 31/130 | 29/223 | 0.530 (0.305–0.922) | 0.0247 |
| ki67 expression | ||||||||||||
| negtive/mild positive | 36/347 | 3/3 | 10.378 (1.947–55.310) | 0.0061 | 34/340 | 3/13 | 2.252 (0.606–8.375) | 0.2257 | 11/130 | 13/223 | 0.540 (0.276–1.484) | 0.2985 |
| strong positive | 81/347 | 3/3 | 4.598 (0.905–23.371) | 0.0659 | 76/340 | 9/13 | 3.126 (1.286–7.602) | 0.0119 | 43/130 | 34/223 | 0.445 (0.269–0.736) | 0.0016 |
aAdjusted for age and gender
SNP selection and genotyping
Five SNPs (rs10848087 G > A, rs35997018 T > C, rs10773771 C > T, rs7957349 G > C, and rs1106042 G > A) were selected from the NCBI dbSNP database (http://www.ncbi.nlm.nih.gov/projects/SNP) based on previously described criteria [38]. The potential functions of these SNPs were evaluated using the SNPinfo online server (http://snpinfo.niehs.nih.gov/snpfunc.htm). Genomic DNA from patient samples was extracted using the TIANamp DNA Kit (Tiangen, Beijing, China) from paraffin-embedded tissue. In contrast, genomic DNA from controls was extracted from peripheral blood specimens using the TIANamp Blood DNA Kit (Tiangen, Beijing, China). DNA purity and concentration were measured using a UV absorption spectrophotometer (Nano Drop Technologies Inc.). Genotyping analysis was conducted using TaqMan PCR master mix and ABI Prism 7900HT genetic detection system through real-time PCR [39]. A random selection of 5% samples was used as positive and negative controls to ensure the accuracy of genotyping results.
Statistical analyses
We conducted a χ2 test to evaluate the heterogeneity of genotypes and ages between patients and controls. We assessed the association between SNP and ovarian cancer risk using a generalized linear regression model and calculated crude and adjusted odds ratios (ORs) and 95% confidence intervals (CIs). A χ2 chi-square test was performed to evaluate deviation from Hardy–Weinberg equilibrium (HWE) among the control group [40]. All statistical tests were conducted using SAS software (Version 9.4; SAS Institute, Cary, NC, U.S.A.), with a two-sided P-value of < 0.05 considered significant.
Results
Association of PIWIL1 genes SNPs and EOC risk
In this study, five PIWIL1 gene SNPs (rs10848087 G > A, rs35997018 T > C, rs10773771 C > T, rs7957349 G > C, and rs1106042 G > A) were genotyped in 288 EOC samples and 361 age-matched healthy controls. The study found that three SNPs (rs10848087 G > A, rs10773771 C > T, and rs7957349 G > C) were in Hardy–Weinberg equilibrium (p > 0.05). However, the rs35997018 and rs1106042 variants were not (p < 0.05). Single-locus analysis was conducted to examine the relationship between rs10848087 G > A, rs10773771 C > T, rs7957349 G > C and EOC risk. The results revealed that rs10848087 AA (adjusted OR = 5.654, 95% CI = 1.562–20.464, p = 0.0083) and rs7957349 CC (adjusted OR = 2.984, 95% CI = 1.491–5.972, p = 0.002) variants significantly increased the susceptibility of EOC. On the other hand, rs10773771 CC (adjusted OR = 0.573, 95% CI = 0.404–0.812, p = 0.0018) was associated with a decreased risk of EOC (Table 1). Location of PIWIL1 gene polymorphisms that may influence cancer risk (Fig. 1).
Table 1.
Logistic regression analysis of associations between PIWIL1 polymorphisms and EOC susceptibility
| Genotype | Cases | Controls | Pa | Crude OR | P | Adjusted OR | Pb |
|---|---|---|---|---|---|---|---|
| (N = 288) | (N = 391) | (95% CI) | (95% CI) b | ||||
| rs10848087 G > A (HWE = 0.810) | |||||||
| GG | 202 (79.84) | 284 (81.14) | 1.00 | 1.00 | |||
| GA | 39 (15.42) | 63 (18.00) | 0.849 (0.551–1.309) | 0.4584 | 0.830 (0.536–1.285) | 0.4022 | |
| AA | 12 (4.74) | 3 (0.86) | 5.485 (1.531–19.653) | 0.0089 | 5.368 (1.486–19.385) | 0.0103 | |
| Additive | 0.0085 | 1.261 (0.897–1.775) | 0.1823 | 1.232 (0.872–1.741) | 0.2370 | ||
| Dominant | 51 (20.16) | 66 (18.86) | 0.6901 | 1.087 (0.723–1.633) | 0.6891 | 1.054 (0.697–1.593) | 0.8042 |
| Recessive | 241 (95.26) | 347 (99.14) | 0.0025 | 5.759 (1.608–20.627) | 0.0072 | 5.654 (1.562–20.464) | 0.0083 |
| rs35997018 T > C (HWE = 0.040) | |||||||
| TT | 129 (54.43) | 170 (48.57) | 1.00 | 1.00 | |||
| TC | 102 (43.04) | 159 (45.43) | 0.752 (0.547–1.034) | 0.0793 | 0.773 (0.561–1.066) | 0.1170 | |
| CC | 6 (2.53) | 21 (6.00) | 0.335 (0.132–0.848) | 0.02 | 0.351 (0.138–0.895) | 0.0283 | |
| Additive | 0.0894 | 0.758 (0.569–1.010) | 0.0581 | 0.780 (0.583–1.044) | 0.0946 | ||
| Dominant | 108 (45.57) | 180 (51.43) | 0.1636 | 0.791 (0.568–1.100) | 0.1638 | 0.818 (0.585–1.143) | 0.2396 |
| Recessive | 231 (97.47) | 329 (94.00) | 0.0490 | 0.407 (0.162–1.024) | 0.0562 | 0.423 (0.167–1.074) | 0.0703 |
| rs10773771 C > T (HWE = 0.391) | |||||||
| CC | 106 (50.00) | 130 (36.83) | 1.00 | 1.00 | |||
| CT | 59 (27.83) | 162 (45.89) | 0.336 (0.234–0.484) | < 0.0001 | 0.335 (0.232–0.485) | < 0.0001 | |
| TT | 47 (22.17) | 61 (17.28) | 0.711 (0.461–1.098) | 0.1241 | 0.714 (0.460–1.107) | 0.1317 | |
| Additive | 0.0001 | 0.861 (0.684–1.084) | 0.2021 | 0.854 (0.677–1.077) | 0.1819 | ||
| Dominant | 106 (50.00) | 223 (63.17) | 0.0021 | 0.583 (0.413–0.823) | 0.0022 | 0.573 (0.404–0.812) | 0.0018 |
| Recessive | 165 (77.83) | 292 (82.72) | 0.1524 | 1.364 (0.891–2.087) | 0.1533 | 1.358 (0.884–2.088) | 0.1625 |
| rs7957349 G > C (HWE = 0.289) | |||||||
| GG | 164 (65.60) | 214 (60.62) | 1.00 | 1.00 | |||
| GC | 60 (24.00) | 126 (35.69) | 0.594 (0.415–0.851) | 0.0045 | 0.612 (0.426–0.878) | 0.0077 | |
| CC | 26 (10.40) | 13 (3.68) | 2.495 (1.250–4.979) | 0.0095 | 2.487 (1.239–4.990) | 0.0104 | |
| Additive | 0.0002 | 1.047 (0.805–1.364) | 0.7305 | 1.056 (0.809–1.379) | 0.6892 | ||
| Dominant | 86 (34.40) | 139 (39.38) | 0.2132 | 0.807 (0.576–1.131) | 0.2135 | 0.822 (0.584–1.156) | 0.2594 |
| Recessive | 224 (89.60) | 340 (96.32) | 0.0010 | 3.036 (1.528–6.033) | 0.0015 | 2.984 (1.491–5.972) | 0.0020 |
| rs1106042 G > A (HWE = 0.031) | |||||||
| GG | 216 (76.87) | 259 (73.79) | 1.00 | 1.00 | |||
| GA | 55 (19.57) | 79 (22.51) | 0.934 (0.635–1.373) | 0.7272 | 0.949 (0.643–1.400) | 0.7919 | |
| AA | 10 (3.56) | 13 (3.70) | 1.032 (0.444–2.395) | 0.9424 | 1.005 (0.429–2.353) | 0.9907 | |
| Additive | 0.6572 | 0.889 (0.658–1.201) | 0.4440 | 0.886 (0.654–1.201) | 0.4358 | ||
| Dominant | 65 (23.13) | 92 (26.21) | 0.3733 | 0.847 (0.588–1.221) | 0.3736 | 0.849 (0.587–1.229) | 0.3857 |
| Recessive | 271 (96.44) | 338 (96.30) | 0.9299 | 0.959 (0.414–2.222) | 0.9231 | 0.922 (0.394–2.157) | 0.8508 |
Abbreviations: EOC knee osteoarthritis, HWE Hardy–Weinberg equilibrium, OR odds ratios, CI confidence interval
aχ2 test for genotype distributions between KOA cases and cancer-free controls
bAdjusted for age and gender
Fig. 1.

SNPs location of PIWIL1 gene. The picture shows the SNP sites used in this paper. The polymorphism of the ovarian cancer risk gene are shown in red, and the site that has a protective effect on EOC are shown in blue. Green was not found to be significant
Stratification analysis of rs10848087, rs7957349 and rs10773771 with EOC susceptibility
Genotype rs10848087 AA had a harmful effect on cases with metastasis (adjusted OR = 8.919, 95% CI = 2.141–37.165, p = 0.0027), clinical stage 1 (adjusted OR = 7.301, 95% CI = 1.348–39.537, p = 0.0211), clinical stage 3 (adjusted OR = 6.490,95% CI = 1.403–30.022, p = 0.0167), low pathological grade (adjusted OR = 5.908, 95% CI = 1.143–30.546, p = 0.0341), high pathological grade (adjusted OR = 6.718, 95% CI = 1.770–25.493, p = 0.0051), single tumor (adjusted OR = 5.443, 95% CI = 1.016–29.161, p = 0.0479), multiple tumors (adjusted OR = 4.602, 95% CI = 1.008–21.012, p = 0.0488), tumor size > 3 cm (adjusted OR = 6.503, 95% CI = 1.381–30.615, p = 0.0178), tumor size ≤ 3 cm (adjusted OR = 5.523, 95% CI = 1.392–21.912, p = 0.0151), pregnant times ≤ 3 (adjusted OR = 7.386, 95% CI = 0.650–29.486, p = 0.0046), pregnant times > 3 (adjusted OR = 4.725, 95% CI = 1.096–20.367, p = 0.0373), pre-menopause (adjusted OR = 6.172, 95% CI = 1.437–26.516, p = 0.0144), strong positive ER expression (adjusted OR = 6.232, 95% CI = 1.202–32.300, p = 0.0293), strong positive PR expression (adjusted OR = 6.584, 95% CI = 1.048–41.362, p = 0.0444), strong positive PAX8 expression (adjusted OR = 5.885, 95% CI = 1.164–30.005, p = 0.0330), negative/mild positive wild p53 expression (adjusted OR = 6.172, 95% CI = 1.773–37.671, p = 0.0071), strong positive wild p53 expression (adjusted OR = 4.717, 95% CI = 1.210–18.395, p = 0.0255), mutant p53 expression (adjusted OR = 5.723, 95% CI = 1.326–24.700, p = 0.0194) no mutant p53 expression (adjusted OR = 5.969, 95% CI = 1.496–23.817, p = 0.0114), strong positive WT1 expression (adjusted OR = 10.408, 95% CI = 2.511–43.135, p = 0.0012), strong positive P16 expression (adjusted OR = 12.751, 95% CI = 3.190–50.966, p < 0.001), strong positive Ki67 expression (adjusted OR = 10.378, 95% CI = 1.947–55.310, p = 0.0061).
The rs7957349 CC was also identified to increase the EOC risk in woman with age ≤ 53 years (adjusted OR = 3.399, 95% CI = 1.387–8.326, p = 0.0074), metastasis (adjusted OR = 3.622, 95% CI = 1.542–8.511, p = 0.0031), no metastasis (adjusted OR = 2.752, 95% CI = 1.250–6.058, p = 0.0119), clinical stage 1 (adjusted OR = 5.870, 95% CI = 2.428–14.191, p < 0.0001), low pathological grade (adjusted OR = 3.033, 95% CI = 1.200–7.664, p = 0.0190), single tumor (adjusted OR = 4.063, 95% CI = 1.719–9.634, p = 0.0014), multiple tumors (adjusted OR = 2.490, 95% CI = 1.028–6.029, p = 0.0432), tumor size > 3 cm (adjusted OR = 3.019, 95% CI = 1.137–8.018, p = 0.0266), tumor size ≤ 3 cm (adjusted OR = 3.024, 95% CI = 1.421–6.434, p = 0.0041), pregnant times ≤ 3 (adjusted OR = 3.768, 95% CI = 1.697–8.368, p = 0.0011), pregnant times > 3 (adjusted OR = 2.359, 95% CI = 1.039–5.354, p = 0.0402), post-menopause (adjusted OR = 3.020, 95% CI = 1.394–6.544, p = 0.0051), pre-menopause (adjusted OR = 3.163, 95% CI = 1.106–9.048, p = 0.0317), strong positive wild p53 expression (adjusted OR = 3.460, 95% CI = 1.693–7.072, p = 0.0007), no mutant p53 expression (adjusted OR = 4.254, 95% CI = 20.19–8.963, p = 0.0001), strong positive Ki67 expression (adjusted OR = 3.126, 95% CI = 1.286–7.602, p = 0.0119).
The rs10773771 CT/TT could protect the woman from the risk of EOC on age > 53 years (adjusted OR = 0.390, 95% CI = 0.221–0.688, p = 0.0012), metastasis (adjusted OR = 0.529, 95% CI = 0.322–0.870, p = 0.0121), no metastasis (adjusted OR = 0.624, 95% CI = 0.411–0.947, p = 0.0267), clinical stage 3 (adjusted OR = 0.433, 95% CI = 0.264–0.709, p < 0.001), high pathological grade (adjusted OR = 0.563, 95% CI = 0.378–0.839, p = 0.0048), multiple tumors (adjusted OR = 0.520, 95% CI = 0.332–0.815, p = 0.0043), tumor size ≤ 3 cm (adjusted OR = 0.503, 95% CI = 0.337–0.751, p = 0.0008), pregnant times ≤ 3 (adjusted OR = 0.609, 95% CI = 0.383–0.969, p = 0.0363), pregnant times > 3 (adjusted OR = 0.532, 95% CI = 0.348–0.813, p = 0.0036), post-menopause (adjusted OR = 0.485, 95% CI = 0.323–0.728, p < 0.001), strong positive ER expression (adjusted OR = 0.355, 95% CI = 0.202–0.625, p < 0.001), negative/mild positive PR expression (adjusted OR = 0.466, 95% CI = 0.222–0.981, p = 0.0443), strong positive PR expression (adjusted OR = 0.428, 95% CI = 0.211–0.868, p = 0.0187), negative/mild positive PAX8 expression (adjusted OR = 0.245, 95% CI = 0.103–0.583, p = 0.0015), strong positive PAX8 expression (adjusted OR = 0.427, 95% CI = 0.244–0.748, p = 0.0029), negative/mild wild p53 expression (adjusted OR = 0.502, 95% CI = 0.291–0.868, p = 0.0136), strong positive wild p53 expression (adjusted OR = 0.603, 95% CI = 0.407–0.893, p = 0.0116), mutant p53 expression (adjusted OR = 0.450, 95% CI = 0.287–0.706, p = 0.0005), negative/mild positive WT1 expression (adjusted OR = 0.240, 95% CI = 0.105–0.549, p < 0.001), strong positive WT1 expression (adjusted OR = 0.491, 95% CI = 0.293–0.825, p = 0.0072), negative/mild positive P16 expression (adjusted OR = 0.294, 95% CI = 0.135–0.641, p = 0.0021), strong positive P16 expression (adjusted OR = 0.530, 95% CI = 0.305–0.922, p = 0.0247), strong positive Ki67 expression (adjusted OR = 0.445, 95% CI = 0.269–0.736, p = 0.0016) (Table 2).
Haplotype analysis of PIWIL1 gene SNPs correlated with EOC susceptibility
Our study investigated the association between haplotypes of the PIWIL1 gene SNPs and the risk of EOC. The haplotype containing the wild-type alleles (GCG) was considered the reference group. The haplotype GTG (adjusted OR = 0.688, 95% CI = 0.509–0.926, p = 0.014) was significantly associated with a decreased risk of EOC (Table 3).
Table 3.
Associatioin between inferred haplotypes of the PIWIL1 genes and EOC risk
| Haplotypes | Cases (n = 394) | Controls (n = 698) | Crude OR (95% CI) | Pa | Adjusted OR (95% CI) | Pb |
|---|---|---|---|---|---|---|
| No.% | No.% | |||||
| GCG | 167 (42.39) | 260 (37.25) | 1.000 | 1.000 | ||
| GCC | 46 (11.68) | 90 (12.89) | 0.796 (0.531–1.193) | 0.269 | 0.809 (0.537–1.218) | 0.309 |
| GTG | 111 (28.17) | 246 (35.24) | 0.702 (0.522–0.945) | 0.020 | 0.688 (0.509–0.926) | 0.014 |
| GTC | 21 (5.33) | 33 (4.73) | 0.991 (0.554–1.771) | 0.980 | 1.010 (0.561–1.817) | 0.974 |
| ACC | 21 (5.33) | 28 (4.01) | 1.168 (0.642–2.124) | 0.612 | 1.123 (0.613–2.058) | 0.707 |
| ATC | 1 (0.25) | 0 | - | 0.979 | - | 0.979 |
| ATG | 1 (0.25) | 1 (0.14) | 1.557 (0.097–25.061) | 0.755 | 1.048 (0.065–16.953) | 0.973 |
| ACG | 26 (6.60) | 40 (5.73) | 1.012 (0.595–1.720) | 0.965 | 1.012 (0.592–1.731) | 0.966 |
aThe haplotypes order was rs1061027,rs10848087, rs35997018, rs10773771, rs7957349, rs1106042
bObtained in logistic regression models with adjustment for age and gender
Expression Quantitative Trait Loci (eQTL) analyses
To determine the functional relevance of PIWIL1 rs10848087, rs7957349, and rs10773771, we analyzed released data from GTEx. It revealed that the rs10848087 G > A and rs10773771 C > T were not significantly associated with PIWIL1 expression. However, the rs7957349 CC genotype had high expression in the thyroid, pituitary, and adrenal glands (Fig. 2).
Fig. 2.

The effect of PIWIL1 gene polymorphisms on PIWIL1 expression. PIWIL1 expression with different genotypes in various organs and tissues was analyzed based on the public database GTEx portal. The expression of PIWIL1 with different rs7957349 genotypes was shown in the Thyroid (A), Pituitary (B), and Adrenal (C)
SNP-SNP interaction analysis
The MDR analysis revealed that the best statistically significant interaction model predicting a potential EOC risk was that of order three among polymorphisms rs10848087, rs7957349, and rs10773771, P = 0.2403 (Table 4). The interaction map shows the following interaction order: PIWIL1 gene polymorphisms rs7957349 × rs10773771 > rs10773771 × rs10848087 > rs7957349 × rs10848087 with low values of positive entropy or synergism (-0.36%, -0.99%, -1.43%, respectively, shown in green and blue); low entropy values mean redundancy or even independence (Fig. 3).
Table 4.
Best multifactor dimensionality reduction (MDR) interaction models
| Locus number | Testing Accuracy | CVC | OR | 95% CI | P |
|---|---|---|---|---|---|
| rs10848087, rs7957349 and rs10773771 | 0.5696 | 10/10 | 1.9608 | 0.6329,6.0745 | 0.2403 |
The model was considered as the best model
Fig. 3.
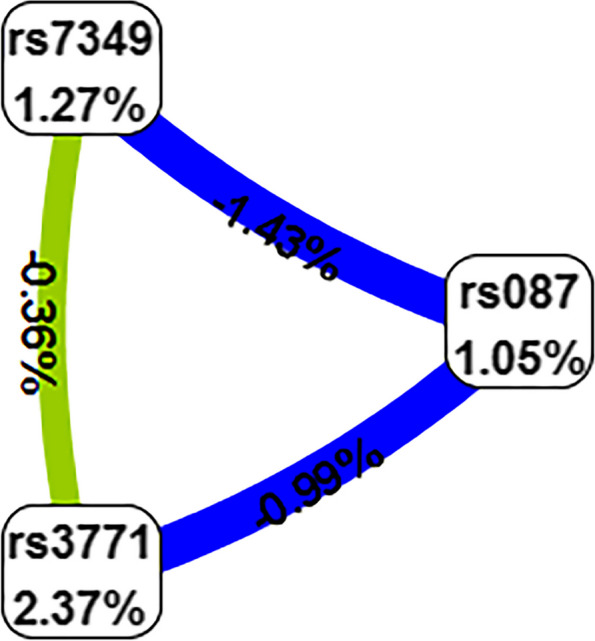
Interaction map for EOC risk. The interaction model describes the percentage of the entropy (information gain) that is explained by each factor or 2-way interaction. Negative entropy (plotted in yellow-green or green) indicates independence or additivity (redundancy)
Discussion
Our study provides epidemiological evidence supporting the role of piRNA processing gene PIWIL1 polymorphisms in determining the risk of EOC in southern Chinese women. Through a case–control study, we discovered the potential association between PIWIL1 gene polymorphisms and the risk of EOC in a population of southern Chinese women. Among the five selected polymorphisms, rs10848087 and rs7957349 were associated with increased EOC risk, while rs10773771 was associated with decreased risk. Our research is to report the association between PIWIL1 gene polymorphisms and EOC.
Recent reports suggest that population-based polygenic risk scores are strongly associate with breast cancer and EOC risks for BRCA1/2 carriers and predict significant differences in absolute risk for women at polygenic risk score distribution extremes [41]. Genetic variation in transmembrane transport genes may be linked to an increased risk of EOC across different histologic subtypes. The disruption of cellular transport, including trace elements, hormones, and small molecules, may play a role in the development of EOC [42]. Common SNPS can appear in both gene-coding regions and non-coding regions. Although the probability of occurrence in the coding region is relatively small, they will affect the function of genes and lead to changes in biological traits, which is of great significance in the study of genetic diseases [43]. SNPs alter the binding site of the transcription factors, thereby, affecting the efficiency of transcription and translation of the gene [44]. Additionally, the widespread expression of Piwi-interacting RNA (piRNA) pathway genes in human EOC suggests their involvement in tumorigenesis [45]. The PIWIL1 gene belongs to the PIWI family of miRNA processing cleaving enzymes, is associated with tumor growth, and is a crucial member of the Argonaute protein family. PIWIL1 can bind with a new class of low scores of non-coding RNA piRNAs, which regulate tumor proliferation, metastasis, invasion, and prognosis [46]. PIWIL1 is a component of ribonucleoprotein complexes and belongs to the evolutionarily conserved PIWI protein family which plays a crucial role in RNA silencing [47]. Studies have reported that increased expression of the PIWIL1 gene is associated with various cancers such as endometrial cancer, cervical squamous cell carcinoma, colon cancer, and hepatocellular carcinoma [48, 49]. Recent studies have evaluated the association between PIWIL1 polymorphisms and the risk of other types of cancers, but no significant associations were observed [50, 51]. Liu et al. found that PIWIL1 rs10773771 CT/CC variant genotypes were associated with a decreased risk of HCC compared to the wild-type TT. The rs10773771 C allele also enhanced the binding of hsa-miR-1264 to the 3'-UTR of PIWIL1. These results suggest that rs10773771 may be linked to HCC by affecting miRNA binding to PIWIL1 [47]. The SNP rs10773771 is located in the 3'-UTR of PIWIL1 [52] and can alter the mRNA secondary structure of PIWIL1. Moreover, rs10773771 can affect the binding of three miRNAs (hsa-miR-1264, hsa-miR-340, hsa-miR-590-3p) to the 3'-UTR of PIWIL1. In a previous study, Liu et al. used reporter gene assays to show that rs10773771 can modify the binding ability of hsa-miR-1264 to the 3'-UTR of PIWIL1 [47]. In Seo's study, the SNP rs10848087 located in the 5'-UTR of PIWIL1 was identified as a high-quality SNV associated with Alzheimer's disease susceptibility genes and significant associations with hippocampal volume (Hv) in vivo AD pathologies [53]. On the other hand, research on the upstream transcript variant PIWIL1 rs7957349 has not been observed recently.
The main strength of our study is its focus on women from South China, which allowed us to gather enough statistical data to identify even minor differences in risk. In this study, we found that the AA genotype of the PIWIL1 rs10848087 was associated with an increased risk of EOC in pre-menopausal women, as well as in patients with stages I and III tumors and metastasis. Specifically, a reduction of both ER and PR has been detected in metastatic tissue [54]. EOC distant metastases account for approximately 16% of cases, with the most common sites being the pleura (33%), liver (26%), and lung (3%) [55]. The role of hormonal receptor status, specifically ER [56] and PR [57] as prognostic parameters in EOC patients has been extensively investigated. However, the reported results are controversial [58]. Our findings suggested that the AA genotype of PIWIL1 rs10848087 was associated with a higher risk of EOC in women with strong positive expression of ER and PR. Nuclear transcriptional regulator p53 plays a crucial role in various cellular processes. By binding to DNA, p53 regulates the expression of numerous target genes to maintain homeostasis and genome integrity. In case of DNA damage, p53 can activate DNA repair proteins, halt cell growth at the G1/S transition for DNA repair, and initiate apoptosis if the DNA damage is irreparable [59]. Given its vital function in tumor suppression, it is not surprising that p53 is frequently mutated in cancer, with TP53 mutations present in over 50% of all types of human cancers. Missense mutations in TP53 are particularly common in ovarian cancer (OC), and early-stage cancers have a significantly higher rate of null mutations compared to late-stage disease [60]. In this study, it was found that the CC genotype of the PIWIL1 rs7957349 variant increased the risk of EOC in women who had strong positive wild p53 expression and no mutant p53 expression. Ki67, encoded by the MKI67 gene, functions as a biological surfactant that disperses mitotic chromosomes. It is commonly used as a proliferation marker in basic research and cancer prognosis [61]. Ki67 is considered a prognostic marker that helps determine the growth fraction of a tumor. Overexpression of Ki67 is associated with malignancy, tumor aggression, poor prognosis, and metastasis [62]. Ki67 is a frequently used tool for evaluating preoperative endocrine in breast cancer [63]. Sehouli's 2019 publication demonstrated that Ki67 is a prognostic factor and a biomarker for predicting therapy outcomes and complete resection in low-grade serous ovarian cancer [64]. However, few studies have evaluated the Ki67 proliferation rate in EOC and the differentiation between histotypes is a frequent problem [65]. Our study revealed that the CC variant of PIWIL1 rs7957349 was significantly expressed in the Thyroid, Pituitary, and Adrenal glands. Additionally, we observed that this variant might augment the susceptibility of EOC in women with strong positive expression of the Ki67 protein. It may be inferred that the CC variant of the PIWIL1 rs7957349 gene has an impact on the glands in women, leading to changes in hormone secretion and an increase in the production of Ki67. This variant can be a diagnostic tool for predicting prognosis and assessing survival rates. This study aims to analyze the correlation between Ki67 expression and PIWIL1 rs7957349 in EOC.
However, limitations of our research include the lack of functional or molecular biology studies to establish the biological significance of the observed associations the small sample size in women, and the presence of rs28416520 was not assessed in the study. The study found that genetic variation in PIWIL1 genes may increase the risk of EOC, particularly in southern Chinese women. However, there is a weakness in the study due to a small sample size of women, and the contribution of genetic and biological differences to EOC among different ethnic groups is still unclear. Nonetheless, given the observed ovarian cancer health disparities globally and in the U.S., further dedicated studies on this topic are necessary [66]. The underlying mechanisms of the identified associations between rs10848087, rs7957349, rs10773771, and EOC also require further investigation.
Our research has shown that genetic variation in PIWIL1 is linked to the risk of EOC. Specifically, we have identified an association between three specific genetic markers (rs10848087, rs7957349, and rs10773771) and EOC in southern Chinese women. These markers can potentially serve as biomarkers for EOC susceptibility and aid in determining appropriate chemotherapeutic options. However, further research is needed to understand the underlying mechanisms involved fully.
Supplementary Information
Additional file 1: Table S1. Clinical characteristics of EOC patients and healthy control subjects.
Additional file 2: Table S2. DNA quality data.
Additional file 3: Table R2. Stratification analysis of PIWIL1 polymorphisms with EOC susceptibility.
Acknowledgements
Thanks to Dr. Shanrong Shu, Department of Gynecology and Obstetrics, The First Affiliated Hospital of Jinan University, kindly supplied EOC tissue samples.
Authors’ contributions
Shanshan Liu wrote the manuscript. Yaping Yan performed the data analysis, Zhizhong Cui, Haipeng Feng, Fengmei Zhong, Ziguang Liu, and Yan Li collected samples; Xiang Ou and Wenjuan Li performed the financial support for the project leading to this publication.
Funding
This work was supported by grants from the Scientific Research Start Plan of Shunde Hospital, Southern Medical University (CRSP2020004).
Hunan Provincial Natural Sciences Foundation of China (2021JJ30751) by Xiang Ou. Scientific Research Project of the Affiliated Changsha Central Hospital, Hengyang Medical School, University of South China (YNKY202304) by Xiang Ou.
Availability of data and materials
The data that support the findings of this study are available from the corresponding author upon reasonable request.
Declarations
Ethics approval and consent to participate
The Ethics Committee of Guangzhou Women and Children's Medical Center (117A01) and Shunde Hospital of Southern Medical University (KYLS20220903) approved the research. All participants signed an informed consent approved by the Institutional Review Board and agreed to participate in the study.
Consent for publication
Not applicable.
Competing interests
The authors declare that they have no conflicts of interest.
Footnotes
Publisher’s Note
Springer Nature remains neutral with regard to jurisdictional claims in published maps and institutional affiliations.
Shanshan Liu and Yaping Yan contributed equally to this work.
Contributor Information
Xiang Ou, Email: xou168@163.com.
Wenjuan Li, Email: lwj12342008@163.com.
References
- 1.Zheng L, Cui C, Shi O, Lu X, Li YK, Wang W, et al. Incidence and mortality of ovarian cancer at the global, regional, and national levels, 1990–2017. Gynecol Oncol. 2020;159(1):239–247. doi: 10.1016/j.ygyno.2020.07.008. [DOI] [PubMed] [Google Scholar]
- 2.Dareng EO, Tyrer JP, Barnes DR, Jones MR, Yang X, Aben KKH, et al. Polygenic risk modeling for prediction of epithelial ovarian cancer risk. Eur J Hum Genet. 2022;30(3):349–362. doi: 10.1038/s41431-021-00987-7. [DOI] [PMC free article] [PubMed] [Google Scholar]
- 3.McCluggage WG, Singh N, Gilks CB. Key changes to the World Health Organization (WHO) classification of female genital tumours introduced in the 5th edition (2020). Histopathology. 2022;80(5):762–78. 10.1111/his.14609. [DOI] [PubMed]
- 4.Zhao Y-M, Zhou J-M, Wang L-R, He H-W, Wang X-L, Tao Z-H, et al. HIWI is associated with prognosis in patients with hepatocellular carcinoma after curative resection. Cancer Nurs Pract. 2012;118(10):2708–17. [DOI] [PubMed]
- 5.Jayson GC, Kohn EC, Kitchener HC, Ledermann JA. Ovarian cancer. Lancet. 2014;384(9951):1376–1388. doi: 10.1016/S0140-6736(13)62146-7. [DOI] [PubMed] [Google Scholar]
- 6.Jane HS, M WE, Susan S, Jiemin M, N AR, U FA, et al. Annual report to the nation on the status of cancer, part I: National cancer statistics. J Cancer. 2020;126(10):2225–49. [DOI] [PMC free article] [PubMed]
- 7.Coscia F, Watters KM, Curtis M, Eckert MA, Chiang CY, Tyanova S, et al. Integrative proteomic profiling of ovarian cancer cell lines reveals precursor cell associated proteins and functional status. Nat Commun. 2016;7:12645. doi: 10.1038/ncomms12645. [DOI] [PMC free article] [PubMed] [Google Scholar]
- 8.Torre LA, Trabert B, DeSantis CE, Miller KD, Samimi G, Runowicz CD, et al. Ovarian cancer statistics, 2018. CA Cancer J Clin. 2018;68(4):284–96. doi: 10.3322/caac.21456. [DOI] [PMC free article] [PubMed] [Google Scholar]
- 9.Siegel RL, Miller KD, Fuchs HE, Jemal A. Cancer Statistics, 2021. CA Cancer J Clin. 2021;71(1):7–33. doi: 10.3322/caac.21654. [DOI] [PubMed] [Google Scholar]
- 10.Hellström I, Raycraft J, Hayden-Ledbetter M, Ledbetter JA, Schummer M, McIntosh M, et al. The HE4 (WFDC2) protein is a biomarker for ovarian carcinoma. Can Res. 2003;63(13):3695–3700. [PubMed] [Google Scholar]
- 11.Jacobs IJ, Menon U, Ryan A, Gentry-Maharaj A, Burnell M, Kalsi JK, et al. Ovarian cancer screening and mortality in the UK Collaborative Trial of Ovarian Cancer Screening (UKCTOCS): a randomised controlled trial. Lancet. 2016;387(10022):945–956. doi: 10.1016/S0140-6736(15)01224-6. [DOI] [PMC free article] [PubMed] [Google Scholar]
- 12.Rauh-Hain JA, Melamed A, Wright A, Gockley A, Clemmer JT, Schorge JO, et al. Overall Survival Following Neoadjuvant Chemotherapy vs Primary Cytoreductive Surgery in Women With Epithelial Ovarian Cancer: Analysis of the National Cancer Database. JAMA Oncol. 2017;3(1):76–82. doi: 10.1001/jamaoncol.2016.4411. [DOI] [PMC free article] [PubMed] [Google Scholar]
- 13.Wright AA, Bohlke K, Armstrong DK, Bookman MA, Cliby WA, Coleman RL, et al. Neoadjuvant chemotherapy for newly diagnosed, advanced ovarian cancer: Society of Gynecologic Oncology and American Society of Clinical Oncology Clinical Practice Guideline. Gynecol Oncol. 2016;143(1):3–15. doi: 10.1016/j.ygyno.2016.05.022. [DOI] [PMC free article] [PubMed] [Google Scholar]
- 14.Walker JL, Brady MF, Wenzel L, Fleming GF, Huang HQ, DiSilvestro PA, et al. Randomized Trial of Intravenous Versus Intraperitoneal Chemotherapy Plus Bevacizumab in Advanced Ovarian Carcinoma: An NRG Oncology/Gynecologic Oncology Group Study. J Clin Oncol. 2019;37(16):1380–1390. doi: 10.1200/JCO.18.01568. [DOI] [PMC free article] [PubMed] [Google Scholar]
- 15.Armstrong DK, Bundy B, Wenzel L, Huang HQ, Baergen R, Lele S, et al. Intraperitoneal cisplatin and paclitaxel in ovarian cancer. N Engl J Med. 2006;354(1):34–43. doi: 10.1056/NEJMoa052985. [DOI] [PubMed] [Google Scholar]
- 16.Norquist BM, Brady MF, Harrell MI, Walsh T, Lee MK, Gulsuner S, et al. Mutations in Homologous Recombination Genes and Outcomes in Ovarian Carcinoma Patients in GOG 218: An NRG Oncology/Gynecologic Oncology Group Study. Clin Cancer Res. 2018;24(4):777–783. doi: 10.1158/1078-0432.CCR-17-1327. [DOI] [PMC free article] [PubMed] [Google Scholar]
- 17.Konstantinopoulos PA, Norquist B, Lacchetti C, Armstrong D, Grisham RN, Goodfellow PJ, et al. Germline and Somatic Tumor Testing in Epithelial Ovarian Cancer: ASCO Guideline. J Clin Oncol. 2020;38(11):1222–1245. doi: 10.1200/JCO.19.02960. [DOI] [PMC free article] [PubMed] [Google Scholar]
- 18.Sun L, Brentnall A, Patel S, Buist DSM, Bowles EJA, Evans DGR, et al. A Cost-effectiveness Analysis of Multigene Testing for All Patients With Breast Cancer. JAMA Oncol. 2019;5(12):1718–1730. doi: 10.1001/jamaoncol.2019.3323. [DOI] [PMC free article] [PubMed] [Google Scholar]
- 19.Kurian AW, Ward KC, Howlader N, Deapen D, Hamilton AS, Mariotto A, et al. Genetic Testing and Results in a Population-Based Cohort of Breast Cancer Patients and Ovarian Cancer Patients. J Clin Oncol. 2019;37(15):1305–1315. doi: 10.1200/JCO.18.01854. [DOI] [PMC free article] [PubMed] [Google Scholar]
- 20.Kurnit KC, Fleming GF, Lengyel E. Updates and New Options in Advanced Epithelial Ovarian Cancer Treatment. Obstet Gynecol. 2021;137(1):108–121. doi: 10.1097/AOG.0000000000004173. [DOI] [PMC free article] [PubMed] [Google Scholar]
- 21.Shi S, Yang ZZ, Liu S, Yang F, Lin H. PIWIL1 promotes gastric cancer via a piRNA-independent mechanism. Proc Natl Acad Sci USA. 2020;117(36):22390–22401. doi: 10.1073/pnas.2008724117. [DOI] [PMC free article] [PubMed] [Google Scholar]
- 22.Dong L, Zehui F, Min D, Chao L, Chonghao X, Juan Z, et al. Effect of RNA interference-related HiWi gene expression on the proliferation and apoptosis of lung cancer stem cells. J Oncol Lett. 2012;4(1):146–50. [DOI] [PMC free article] [PubMed]
- 23.FGL, TG, HT, PM, UK, AU, et al. The stem cell-associated Hiwi gene in human adenocarcinoma of the pancreas: expression and risk of tumour-related death. J Br J Cancer. 2008;99(7):1083–8. [DOI] [PMC free article] [PubMed]
- 24.Chen Z, Che Q, Jiang FZ, Wang HH, Wang FY, Liao Y, et al. Piwil1 causes epigenetic alteration of PTEN gene via upregulation of DNA methyltransferase in type I endometrial cancer. Biochem Biophys Res Commun. 2015;463(4):876–880. doi: 10.1016/j.bbrc.2015.06.028. [DOI] [PubMed] [Google Scholar]
- 25.Gao CL, Sun R, Li DH, Gong F. PIWI-like protein 1 upregulation promotes gastric cancer invasion and metastasis. Onco Targets Ther. 2018;11:8783–8789. doi: 10.2147/OTT.S186827. [DOI] [PMC free article] [PubMed] [Google Scholar]
- 26.Li F, Yuan P, Rao M, Jin CH, Tang W, Rong YF, et al. piRNA-independent function of PIWIL1 as a co-activator for anaphase promoting complex/cyclosome to drive pancreatic cancer metastasis. Nat Cell Biol. 2020;22(4):425–438. doi: 10.1038/s41556-020-0486-z. [DOI] [PubMed] [Google Scholar]
- 27.Ye C, Qian W, Wei J, Yonghua B, Yang Z, Anxing G, et al. Emerging roles of piRNAs in cancer: challenges and prospects. J Aging. 2019;11(21):9932–46. [DOI] [PMC free article] [PubMed]
- 28.Wen X, Wang D, Li X, Zhao C, Wang T, Qian X, et al. Differential expression of two Piwil orthologs during embryonic and gonadal development in pufferfish, Takifugu fasciatus. Comp Biochem Physiol B: Biochem Mol Biol. 2018;219–220:44–51. doi: 10.1016/j.cbpb.2018.03.005. [DOI] [PubMed] [Google Scholar]
- 29.Singh G, Roy J, Rout P, Mallick B. Genome-wide profiling of the PIWI-interacting RNA-mRNA regulatory networks in epithelial ovarian cancers. PLoS ONE. 2018;13(1):e0190485. doi: 10.1371/journal.pone.0190485. [DOI] [PMC free article] [PubMed] [Google Scholar]
- 30.Friemel C, Ammerpohl O, Gutwein J, Schmutzler AG, Caliebe A, Kautza M, et al. Array-based DNA methylation profiling in male infertility reveals allele-specific DNA methylation in PIWIL1 and PIWIL2. Fertil Steril. 2014;101(4):1097–103.e1. doi: 10.1016/j.fertnstert.2013.12.054. [DOI] [PubMed] [Google Scholar]
- 31.Zhenzhen L, Lanting Z, Lihong Z, Juan X, Zhengjiang C. Single nucleotide polymorphism of rs28416520 in Piwil1 gene promoter region is associated with an increased risk of gastric cancer. Nan Fang Yi Ke Da Xue Xue Bao. 2020;40(10):1373–1379. doi: 10.12122/j.issn.1673-4254.2020.10.01. [DOI] [PMC free article] [PubMed] [Google Scholar]
- 32.Cheasley D, Fernandez ML, Köbel M, Kim H, Dawson A, Hoenisch J, et al. Molecular characterization of low-grade serous ovarian carcinoma identifies genomic aberrations according to hormone receptor expression. NPJ precision oncology. 2022;6(1):47. doi: 10.1038/s41698-022-00288-2. [DOI] [PMC free article] [PubMed] [Google Scholar]
- 33.Manu V, Hein TA, Boruah D, Srinivas V. Serous ovarian tumors: Immunohistochemical profiling as an aid to grading and understanding tumorigenesis. Med J Armed Forces India. 2020;76(1):30–36. doi: 10.1016/j.mjafi.2018.06.014. [DOI] [PMC free article] [PubMed] [Google Scholar]
- 34.Ozcan A, Shen SS, Hamilton C, Anjana K, Coffey D, Krishnan B, et al. PAX 8 expression in non-neoplastic tissues, primary tumors, and metastatic tumors: a comprehensive immunohistochemical study. Modern Pathol. 2011;24(6):751–764. doi: 10.1038/modpathol.2011.3. [DOI] [PubMed] [Google Scholar]
- 35.Ozcan A, Liles N, Coffey D, Shen SS, Truong LD. PAX2 and PAX8 expression in primary and metastatic müllerian epithelial tumors: a comprehensive comparison. Am J Surg Pathol. 2011;35(12):1837–1847. doi: 10.1097/PAS.0b013e31822d787c. [DOI] [PubMed] [Google Scholar]
- 36.Němejcová K, Šafanda A, Bártů MK, Michálková R, Drozenová J, Fabian P, et al. A comprehensive immunohistochemical analysis of 26 markers in 250 cases of serous ovarian tumors. Diagn Pathol. 2023;18(1):32. doi: 10.1186/s13000-023-01317-9. [DOI] [PMC free article] [PubMed] [Google Scholar]
- 37.McCluggage WG, Singh N, Gilks CB. Key changes to the World Health Organization (WHO) classification of female genital tumours introduced in the 5th edition (2020). Histopathology. 2022;80(5):762–78. [DOI] [PubMed]
- 38.Wang X, Deng D, Yan Y, Cai M, Liu X, Luo A, et al. Genetic variants in m5C modification core genes are associated with the risk of Chinese pediatric acute lymphoblastic leukemia: A five-center case-control study. Front Oncol. 2022;12:1082525. doi: 10.3389/fonc.2022.1082525. [DOI] [PMC free article] [PubMed] [Google Scholar]
- 39.Zhang M, Zhao Z, Chen S, Liang Z, Zhu J, Zhao M, et al. The Association of Polymorphisms in Base Excision Repair Genes with Ovarian Cancer Susceptibility in Chinese Women: A Two-Center Case-Control Study. J Cancer. 2021;12(1):264–269. doi: 10.7150/jca.49925. [DOI] [PMC free article] [PubMed] [Google Scholar]
- 40.Deng D, Luo A, Li M, Yan Y, Cai M, Liu S, et al. New association between splicing factor-coding gene polymorphisms and the risk of acute lymphoblastic leukemia in southern Chinese children: A five-center case-control study. J Gene Med. 2023;25(4):e3474. doi: 10.1002/jgm.3474. [DOI] [PubMed] [Google Scholar]
- 41.Barnes DR, Rookus MA, McGuffog L, Leslie G, Mooij TM, Dennis J, et al. Polygenic risk scores and breast and epithelial ovarian cancer risks for carriers of BRCA1 and BRCA2 pathogenic variants. Genet Med. 2020;22(10):1653–1666. doi: 10.1038/s41436-020-0862-x. [DOI] [PMC free article] [PubMed] [Google Scholar]
- 42.Chornokur G, Lin HY, Tyrer JP, Lawrenson K, Dennis J, Amankwah EK, et al. Common Genetic Variation In Cellular Transport Genes and Epithelial Ovarian Cancer (EOC) Risk. PLoS ONE. 2015;10(6):e0128106. doi: 10.1371/journal.pone.0128106. [DOI] [PMC free article] [PubMed] [Google Scholar]
- 43.Lou D, Wang J, Wang X. Single nucleotide polymorphisms in the non-coding region of STIM1 gene are associated with Parkinson disease risk in Chinese Han population. Medicine. 2020;99(9):e19234. doi: 10.1097/MD.0000000000019234. [DOI] [PMC free article] [PubMed] [Google Scholar]
- 44.Wang J, Wang X, Zhao M, Choo SP, Ong SJ, Ong SY, et al. Potentially functional SNPs (pfSNPs) as novel genomic predictors of 5-FU response in metastatic colorectal cancer patients. PLoS ONE. 2014;9(11):e111694. doi: 10.1371/journal.pone.0111694. [DOI] [PMC free article] [PubMed] [Google Scholar]
- 45.Lim SL, Ricciardelli C, Oehler MK, Tan IM, Russell D, Grützner F. Overexpression of piRNA pathway genes in epithelial ovarian cancer. PLoS ONE. 2014;9(6):e99687. doi: 10.1371/journal.pone.0099687. [DOI] [PMC free article] [PubMed] [Google Scholar]
- 46.Anzelon TA, Chowdhury S, Hughes SM, Xiao Y, Lander GC, MacRae IJ. Structural basis for piRNA targeting. Nature. 2021;597(7875):285–289. doi: 10.1038/s41586-021-03856-x. [DOI] [PMC free article] [PubMed] [Google Scholar]
- 47.Liu L, An J, Liu J, Wen J, Zhai X, Liu Y, et al. Potentially functional genetic variants in microRNA processing genes and risk of HBV-related hepatocellular carcinoma. Mol Carcinog. 2013;52(Suppl 1):E148–E154. doi: 10.1002/mc.22062. [DOI] [PubMed] [Google Scholar]
- 48.Wang N, Tan HY, Lu Y, Chan YT, Wang D, Guo W, et al. PIWIL1 governs the crosstalk of cancer cell metabolism and immunosuppressive microenvironment in hepatocellular carcinoma. Signal Transduct Target Ther. 2021;6(1):86. doi: 10.1038/s41392-021-00485-8. [DOI] [PMC free article] [PubMed] [Google Scholar]
- 49.Xie K, Zhang K, Kong J, Wang C, Gu Y, Liang C, et al. Cancer-testis gene PIWIL1 promotes cell proliferation, migration, and invasion in lung adenocarcinoma. Cancer Med. 2018;7(1):157–166. doi: 10.1002/cam4.1248. [DOI] [PMC free article] [PubMed] [Google Scholar]
- 50.Lin J, Horikawa Y, Tamboli P, Clague J, Wood CG, Wu X. Genetic variations in microRNA-related genes are associated with survival and recurrence in patients with renal cell carcinoma. Carcinogenesis. 2010;31(10):1805–1812. doi: 10.1093/carcin/bgq168. [DOI] [PMC free article] [PubMed] [Google Scholar]
- 51.Yang H, Dinney CP, Ye Y, Zhu Y, Grossman HB, Wu X. Evaluation of genetic variants in microRNA-related genes and risk of bladder cancer. Can Res. 2008;68(7):2530–2537. doi: 10.1158/0008-5472.CAN-07-5991. [DOI] [PubMed] [Google Scholar]
- 52.Wang M, Gu J, Shen C, Tang W, Xing X, Zhang Z, et al. Association of MicroRNA Biogenesis Genes Polymorphisms with Risk of Large Artery Atherosclerosis Stroke. Cell Mol Neurobiol. 2022;42(6):1801–1807. doi: 10.1007/s10571-021-01057-8. [DOI] [PMC free article] [PubMed] [Google Scholar]
- 53.Seo J, Byun MS, Yi D, Lee JH, Jeon SY, Shin SA, et al. Genetic associations of in vivo pathology influence Alzheimer's disease susceptibility. Alzheimers Res Ther. 2020;12(1):156. doi: 10.1186/s13195-020-00722-2. [DOI] [PMC free article] [PubMed] [Google Scholar]
- 54.Mittica G, Senetta R, Scotto G, Aglietta M, Maggiorotto F, Ghisoni E, et al. Androgen receptor status predicts development of brain metastases in ovarian cancers. Oncotarget. 2017;8(25):41143–41153. doi: 10.18632/oncotarget.17068. [DOI] [PMC free article] [PubMed] [Google Scholar]
- 55.Piura E, Piura B. Brain metastases from ovarian carcinoma. ISRN Oncol. 2011;2011:527453. 10.5402/2011/527453. [DOI] [PMC free article] [PubMed]
- 56.Halon A, Materna V, Drag-Zalesinska M, Nowak-Markwitz E, Gansukh T, Donizy P, et al. Estrogen receptor alpha expression in ovarian cancer predicts longer overall survival. Pathol Oncol Res. 2011;17(3):511–518. doi: 10.1007/s12253-010-9340-0. [DOI] [PMC free article] [PubMed] [Google Scholar]
- 57.Lenhard M, Tereza L, Heublein S, Ditsch N, Himsl I, Mayr D, et al. Steroid hormone receptor expression in ovarian cancer: progesterone receptor B as prognostic marker for patient survival. BMC Cancer. 2012;12:553. doi: 10.1186/1471-2407-12-553. [DOI] [PMC free article] [PubMed] [Google Scholar]
- 58.Voutsadakis IA. Hormone Receptors in Serous Ovarian Carcinoma: Prognosis, Pathogenesis, and Treatment Considerations. Clin Med Insights Oncol. 2016;10:17–25. doi: 10.4137/CMO.S32813. [DOI] [PMC free article] [PubMed] [Google Scholar]
- 59.Latonen L, Laiho M. Cellular UV damage responses–functions of tumor suppressor p53. Biochem Biophys Acta. 2005;1755(2):71–89. doi: 10.1016/j.bbcan.2005.04.003. [DOI] [PubMed] [Google Scholar]
- 60.Bernardini MQ, Baba T, Lee PS, Barnett JC, Sfakianos GP, Secord AA, et al. Expression signatures of TP53 mutations in serous ovarian cancers. BMC Cancer. 2010;10:237. doi: 10.1186/1471-2407-10-237. [DOI] [PMC free article] [PubMed] [Google Scholar]
- 61.Johnston S, Puhalla S, Wheatley D, Ring A, Barry P, Holcombe C, et al. Randomized Phase II Study Evaluating Palbociclib in Addition to Letrozole as Neoadjuvant Therapy in Estrogen Receptor-Positive Early Breast Cancer: PALLET Trial. J Clin Oncol. 2019;37(3):178–189. doi: 10.1200/JCO.18.01624. [DOI] [PubMed] [Google Scholar]
- 62.Mahadevappa A, Krishna SM, Vimala MG. Diagnostic and Prognostic Significance of Ki-67 Immunohistochemical Expression in Surface Epithelial Ovarian Carcinoma. J Clin Diagn Res. 2017;11(2):Ec08–ec12. doi: 10.7860/JCDR/2017/24350.9381. [DOI] [PMC free article] [PubMed] [Google Scholar]
- 63.Ellis MJ, Suman VJ, Hoog J, Goncalves R, Sanati S, Creighton CJ, et al. Ki67 Proliferation Index as a Tool for Chemotherapy Decisions During and After Neoadjuvant Aromatase Inhibitor Treatment of Breast Cancer: Results From the American College of Surgeons Oncology Group Z1031 Trial (Alliance) J Clin Oncol. 2017;35(10):1061–1069. doi: 10.1200/JCO.2016.69.4406. [DOI] [PMC free article] [PubMed] [Google Scholar]
- 64.Sehouli J, Braicu EI, Richter R, Denkert C, Jank P, Jurmeister PS, et al. Prognostic significance of Ki-67 levels and hormone receptor expression in low-grade serous ovarian carcinoma: an investigation of the Tumor Bank Ovarian Cancer Network. Hum Pathol. 2019;85:299–308. doi: 10.1016/j.humpath.2018.10.020. [DOI] [PubMed] [Google Scholar]
- 65.Chen M, Yao S, Cao Q, Xia M, Liu J, He M. The prognostic value of Ki67 in ovarian high-grade serous carcinoma: an 11-year cohort study of Chinese patients. Oncotarget. 2017;8(64):107877–107885. doi: 10.18632/oncotarget.14112. [DOI] [PMC free article] [PubMed] [Google Scholar]
- 66.Cabasag CJ, Fagan PJ, Ferlay J, Vignat J, Laversanne M, Liu L, et al. Ovarian cancer today and tomorrow: A global assessment by world region and Human Development Index using GLOBOCAN 2020. Int J Cancer. 2022;151(9):1535–1541. doi: 10.1002/ijc.34002. [DOI] [PubMed] [Google Scholar]
Associated Data
This section collects any data citations, data availability statements, or supplementary materials included in this article.
Supplementary Materials
Additional file 1: Table S1. Clinical characteristics of EOC patients and healthy control subjects.
Additional file 2: Table S2. DNA quality data.
Additional file 3: Table R2. Stratification analysis of PIWIL1 polymorphisms with EOC susceptibility.
Data Availability Statement
The data that support the findings of this study are available from the corresponding author upon reasonable request.