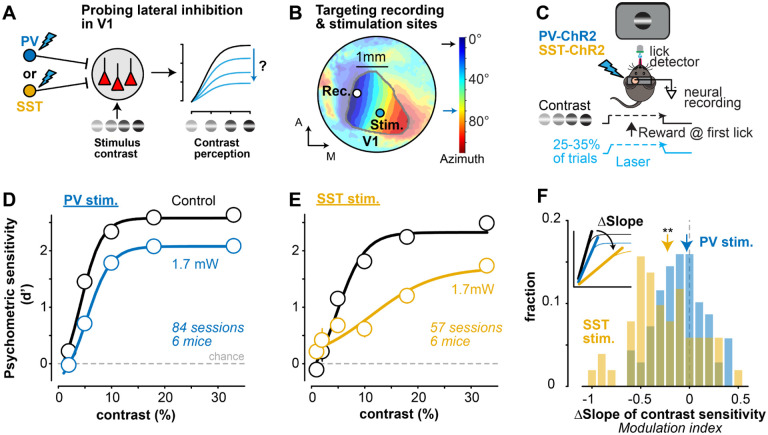
Figure 1. SST lateral inhibition controls the slope of psychometric contrast sensitivity A.
Experimental design to probe how lateral inhibition from PV (blue) or SST (gold) neurons in primary visual cortex (V1) affects neural and perceptual contrast sensitivity.
B. Example hemodynamic response map of horizontal visual space (azimuth, colorbar). Visual field sign (Methods) used to delimit V1 (contour) and target recording sites (0°) and laser stimulation (70°, ~0.8 mm away from recording site) in every experiment. See Fig. S1 for laser spot size (~0.3mm) and recording locations across experiments.
C. SST- or PV-cre x Ai32 channelrhodopsin (ChR2) mice were trained to detect static Gabor gratings (location ) at multiple contrasts (0–33%). PV or SST neurons were activated on 25% or 33% of trials with a laser ramp (1.7mW at peak) during grating appearance. Neural activity was recorded simultaneously from the V1 retinotopic site corresponding to grating location (as in B).
D. Psychometric contrast sensitivity (d’) in PV-ChR2 mice (6 mice, 84 sessions) for interleaved control (black) and PV inhibition trials (blue). Mean ± SEM, fit with a sigmoidal equation (Methods).
E. Same as D for SST-ChR2 mice (6 mice, 57 sessions).
F. SST stimulation significantly decreased the slope of the contrast response curve (−0.23 ± 0.26, median ± MAD; , Wilcoxon signed-rank test), but PV stimulation did not . Change in slope quantified as modulation index (MI), defined as difference between control and laser conditions (inset) divided by sum (see Methods). Histogram shows distributions of Ml calculated per session (same sessions in D, E). Changes not explained by differences in false alarms, pupil dynamics, or other behavioral factors in PV vs SST mice (Fig. S2).

