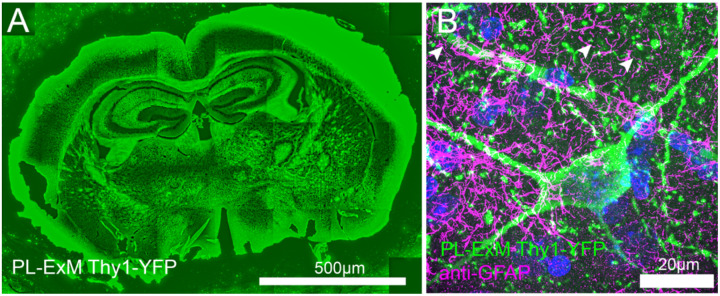
Figure 5. Two-color PL-ExM imaging reveals interactions in mouse brain tissues.
Both images are Airyscan PL-ExM images of 20-μm sections of a mouse brain expressing Thy1-YFP with proximity-labeled Thy1-YFP (green) and immunostained GFAP (magenta). (A) Proximity labeled Thy1-YFP channel of a whole mouse brain slice with. (B) A magnified view of (A) with both proximity labeled Thy1-YFP (green) and immunostained GFAP (magenta). Both mages are maximum intensity projections of z stack. The scale bars are 500 μm for (A) and 20μm for (B). The length expansion factor is 4.0. All scale bars are in pre-expansion units.

