

Abstract
Patient-derived organoid (PDO) models of cancer are a multifunctional research system that better recapitulates human disease as compared to cancer cell lines. PDO models can be generated by culturing patient tumor cells in extracellular basement membrane extracts (BME) and plating as three-dimensional domes. However, commercially available reagents that have been optimized for phenotypic assays in monolayer cultures often are not compatible with BME. Herein we describe a method to plate PDO models and assess drug effects using an automated live-cell imaging system. In addition, we apply fluorescent dyes that are compatible with kinetic measurements to simultaneously quantitate cell health and apoptosis. Image capture can be customized to occur at regular time intervals over several days. Users can analyze drug effects in individual Z-plane images or a Z Projection of serial images from multiple focal planes. Using masking, specific parameters of interest are calculated, such as PDO number, area, and fluorescence intensity. We provide proof-of-concept data demonstrating the effect of cytotoxic agents on cell health, apoptosis and viability. This automated kinetic imaging platform can be expanded to other phenotypic readouts to understand diverse therapeutic effects in PDO models of cancer.
SUMMARY:
Patient-derived tumor organoids are a sophisticated model system for basic and translational research. This methods article details the use of multiplexed fluorescent live-cell imaging for simultaneous kinetic assessment of different organoid phenotypes.
INTRODUCTION:
Patient-derived tumor organoids (PDOs) are rapidly emerging as a robust model system to study cancer development and therapeutic responses. PDOs are three-dimensional (3D) cell culture systems that recapitulate the complex genomic profile and architecture of the primary tumor1,2. Unlike traditional two-dimensional (2D) culture of immortalized cancer cell lines, PDOs capture and maintain intratumoral heterogeneity3,4, making them a valuable tool for both mechanistic and translational research. Although PDOs are becoming an increasingly popular model system, commercially available reagents and analysis methods for cellular effects that are compatible with PDO cultures are limited.
The lack of robust methods to analyze subtle changes in treatment response hinders clinical translation. The gold standard cell health reagent in 3D cultures, CellTiter-Glo 3D, utilizes ATP levels as a determinant of cell viability5,6. While this reagent is a useful for endpoint assays, there are several caveats, most notably the inability to use samples for other purposes after completion of the assay.
Live-cell imaging is a sophisticated form of kinetic microscopy that, when combined with fluorescent reagents, has the capacity to quantify a variety of cell health readouts within PDO models, including apoptosis7–9 and cytotoxicity10. Indeed, live-cell imaging has been integral to high throughput screening of compounds in 2D platforms11,12. Systems such as the Incucyte have made the technology affordable and thus accessible to research groups in a variety of settings. However, application of these systems to analyze 3D cultures is still in its infancy.
Herein we describe a method to assess drug response in PDO models of cancer using multiplexed live-cell imaging (Figure 1). Through analysis of Bright Field images, changes in organoid size and morphology can be kinetically monitored. Furthermore, cellular processes can be simultaneously quantified over time using fluorescent reagents, such as Annexin V Red Dye for apoptosis and Cytotox Green Dye for cytotoxicity. The methods presented are optimized for the Cytation 5 live-cell imaging system, but this protocol may be adapted across different live-cell imaging platforms.
Figure 1: Overview of plating, imaging and analysis protocol.
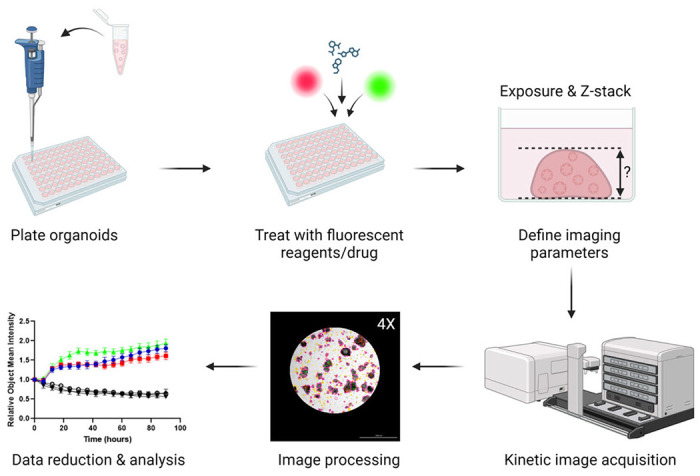
PDOs are plated in a 96-well plate and treated with fluorescent dyes and drugs. Imaging parameters for the experiment (e.g., Exposure, Z-stack) are created in the Gen5 software. Images are acquired by the Cytation 5 and processed in Gen5, and data are exported for further analysis.
PROTOCOL:
Ethics Statement:
Studies using human tumor specimens were reviewed and approved by the University of Iowa Institutional Review Board (IRB), protocol #201809807 and performed in accordance with the ethical standards as laid down in the 1964 Helsinki Declaration and its later amendments. Informed consent was obtained from all subjects participating in the study. Inclusion criteria include a diagnosis of cancer and availability of tumor specimen.
Plating intact PDOs in a 96-well plate.
- Prepare reagents:
- Preheat 96-well plates at 37 °C overnight and thaw BME overnight at 4 °C.
- Prepare full Organoid Culture Media optimized for culturing the cancer type of interest. Specific culture media used for experiments shown herein are provided in Supplemental Table S1.
- Note: Media components may need to be modified for different tumor types. For example, the Organoid Culture Media is supplemented with 100 nM estradiol for gynecologic tumors 13.
- Note: Prepared media is stable at 4 °C for 1 month. For long term storage, aliquot into 50 mL tubes and store at −20 °C.
- Prepare two separate aliquots of Organoid Culture Media at 4 °C and 37 °C.
- For example, if 60 wells are being plated in a 96-well plate, 6 mL of warm Organoid Culture Media and 150 μL of ice-cold Organoid Culture Media is required.
Prepare Organoid Wash Buffer: 1X PBS supplemented with 10 mM HEPES, 1X Glutamax, 5 mM EDTA, and 10 μM Y-27632. Store at 4 °C
- Harvest PDOs cultured in a 24-well plate: All steps should be performed on ice or at 4 °C unless otherwise noted.
- Aspirate media from each well using a vacuum line system.
- Add 500 μL ice-cold Organoid Wash Buffer and gently pipette 2-3X using a 1000 μL pipettor.
- Incubate plate on ice for 10 minutes.
- Transfer the contents of each well to a 50 mL conical tube. To ensure that all the PDOs are in suspension, rinse each well with an additional 300 μL of Organoid Wash Buffer and transfer to the 50 mL conical tube.
- Centrifuge for 5 minutes at 350 x g at 4 °C.
- Aspirate supernatant from BME/organoid pellet using a vacuum line system, leaving ~ 5 mL remaining in tube. Add an additional 20 mL of Organoid Wash Buffer and gently resuspend the pellet using a 10 mL serological pipette.
- Incubate on ice for 10 minutes.
- Centrifuge for 5 minutes at 350 x g at 4 °C.
- Aspirate the supernatant with vacuum line system, taking care not to disrupt the PDO pellet.
- Plating PDOs in a 96-well plate: All steps should be performed on ice unless otherwise noted.
- Resuspend PDO pellet in appropriate amount of ice-cold Organoid Culture Media to create a PDO suspension.
- Note: To calculate the amount of Organoid Culture Media, determine the number of wells to be plated in a 96-well plate, taking into consideration that PDOs are plated in a 5 μL dome in a 1:1 ratio of Organoid Culture Media and BME. For example, when plating one 96-well plate and using only the inner 60 wells, the total amount of PDO suspension needed will be 300 μL: 150 μL Organoid Culture Media and 150 μL BME.
- Note: For models that exhibit optimal growth at different percentages of BME, the ratio of BME:media may be modified in this step, though it is important to standardize the ratio across all assays for each specific model. To account for pipetting error, add 10% volume to each component.
- Count the number of PDOs: Transfer 2.5 μL PDO suspension to an ice-cold 1.5 mL Microcentrifuge tube and mix with 2.5 μL BME. Transfer the 5 μL mixture onto a clean glass microscope slide. Do not coverslip the slide. The mixture will solidify into a dome. Visualize using a Bright Field microscope at 4X. Count the number of PDOs in the 5 μL mixture; the goal is to have roughly 25-50 PDOs per 5 μL dome.
- Note: If the desired density is not achieved in the test mixture, adjust the final volume of the PDO suspension either by adding more Organoid Culture Media or centrifuging the PDO suspension and resuspending the PDO pellet in a lower volume of ice-cold Organoid Culture Media. Regardless of how the PDO suspension is modified in this step, the final ratio of BME:PDO suspension in Step 3 should be 1:1.
- Using a 200 μL pipettor with wide bore tips, carefully mix PDO suspension with an equal amount of BME to achieve a 1:1 ratio of Organoid Culture Media to BME. Avoid bubbles, which will disrupt the integrity of the domes. Transfer contents of 15 mL conical tube to an ice-cold 1.5 mL microcentrifuge tube for easier handling in subsequent steps.
- Using a 20 μL pipettor, seed 5 μL domes into the center of each well of a prewarmed 96-well plate, seeding only the inner 60 wells. To ensure equal distribution of the PDOs, periodically gently pipet the contents of the 1.5 mL tube with a 200 μL pipettor with wide-bore tips.
- After all wells have been seeded, place the lid on the plate and gently invert. Incubate the inverted plate at 37 °C for 20 minutes in the tissue culture incubator to allow domes to solidify.
- Note: Inverting the plate ensures that the BME/Organoid Culture Media dome retains the 3D structure to provide adequate room for PDO formation.
- Flip the plate so that it is sitting with the lid up and incubate for an additional 5 minutes at 37 °C.
Treatments and addition of fluorescent dyes for multiplexing.
While BME domes are solidifying in the 96-well plates, prepare dilutions of fluorescent live-cell imaging reagents. Herein we give specific parameters for multiplexing Annexin V Red Dye and Cytotox Green Dye.
- Fluorescent reagent preparation (Day −1): Calculate the appropriate volume of Organoid Culture Media based on the number of wells to be treated, assuming each well will be treated with 100 μL of dye-dosed media. Dilute dye in pre-warmed Organoid Culture Media to the desired concentration.
- Note: The total amount of media needed will vary depending on the experiment. Add 10% to the final volume to account for pipetting error. For example, to treat the inner 60 wells of a 96-well plate, prepare 6.6 mL of dye-dosed media (Table 1).
Treat each well with 100 μL of 2X dye-dosed Organoid Culture Media.
- Add 200 μL of sterile 1X PBS to the outer empty wells of the plate. Incubate at 37 °C overnight.
- Note: PBS in the peripheral wells decreases evaporation of media from the inner wells.
- Addition of drugs/treatment agents (Day 0): Prepare drugs in pre-warmed Organoid Culture Media at a 2X concentration in a volume of 100 μl per well.
- Note: DMSO can be toxic to cells at high concentrations. A concentration of 0.1% DMSO is not exceeded in our experiments. In addition to drugs, some fluorescent reagents are distributed as a DMSO solution. It is important to account for total DMSO concentration when working with such reagents.
Add 100 μl of 2X treatment media to each well, avoid creating bubbles.
Table 1: Example multiplexing experiment.
Annexin V Red binds exposed phosphatidyl serine on the outer leaflet of apoptotic cell membranes. Cytotox Green integrates into cells with compromised membrane integrity and binds DNA.
| Treatment | # of wells | Media Volume | Annexin | 100 μM Cytotox | ||
|---|---|---|---|---|---|---|
| Dilution | Volume | Dilution | Volume | |||
| Multiplex | 60 | 6.6 mL | 1:400 | 16.5 μL | 200 nM | 13.2 μL |
Setting up imaging parameters.
Launch Gen5 software to begin imaging the 96-well plate.
- Place plate in Cytation 5. Open Gen5 software. Click New Task > Imager Manual Mode. Select Capture Now and input the following settings: Objective (select desired magnification); Filter (select microplate); Microplate format (select number of wells); and Vessel type (select plate type). Click “Use Lid” and “Use slower carrier speed.” Click OK.
- Note for Vessel type: Be as specific as possible when selecting information about the plate because the software is calibrated to the specific distance from the objective to the bottom of the plate for each plate type and thickness of the plastic.
- Note for Slower Carrier Speed: Select this box to avoid disrupting domes when loading/unloading plates.
- Create a Z-Stack which will image the entire BME dome.
- Select a well of interest to view (left panel, below histogram).
- Select the Bright Field channel (left panel, top). Click Auto-expose and adjust settings as needed.
- Set the bottom and top of the Z-Stack: Expand Imaging Mode tab (left panel, middle). Check the Z-Stack box. Using the course adjustment arrows (left panel, middle), click the down adjustment until all PDOs have come into and then out of focus and are fuzzy. Set this as the bottom of the Z-Stack. Repeat in the opposite direction using the course adjustment arrows to set the top of the Z-Stack.
- To ensure that the Z-Stack settings are appropriate for other wells of interest, select another well (left panel, below histogram) and visualize the top and bottom of the Z-Stack. To manually enter the focal positions, click on the three dots next to the fine adjustment (left panel, top). A window will open; type in the top Z-Stack value (found in the left panel, center, under Imaging Mode). Repeat for the bottom Z-Stack value. Adjust as necessary to capture the desired Z range by repeating step 3. If adjustments were necessary, select another well to verify settings.
- Set the exposure settings for fluorescent channel(s). Settings are described for two fluorescent channels (GFP & TRITC). The specific number of fluorescent channels will depend on the experiment and which fluorescent cubes are installed in the Cytation 5.
- Note: If the signal intensity is anticipated to be significantly higher at the end of the experiment, users should consider performing test experiments to determine the optimal exposure settings at the end of the experiment that can then be applied when setting up the initial parameters.
- Expand the Imaging Mode tab (left panel, middle) and open Edit Imaging Step. A pop-up window will appear.
- Under Channels, click on the bubble for the desired number of channels. One channel should be designated for Bright Field and additional channels for each fluorescent channel. In this example, Channel 1 = Bright Field; Channel 2 = GFP; Channel 3 = TRITC. Using the drop-down Color menus, select the appropriate setting for each channel. Close editing window by clicking OK.
- Set up each fluorescent channel.
- Switch the channel to GFP (left panel, top).
- Click Auto-expose (left panel, top). Expand the Exposure tab (left panel, middle) and adjust the exposure settings to minimize background signal.
- Copy exposure settings to the Image Mode tab.
- Click on the “Copy” icon
 next to the Edit Imaging Step box.
 - Click Edit Imaging Step, which will open another window.
- Under the GFP channel, click the “Clipboard” icon
 in the Exposure line. This function will add the Illumination, Integration Time and Camera Gain settings to the channel.
- Repeat Steps 1-3 for the TRITC channel.
- Click OK to close the window.
- Set up the Image Preprocessing and Z Projection steps, which will automate image preprocessing.
- Click on the “Camera” icon (left panel, bottom corner). A new window will open.
- Under ADD PROCESSING STEP (left panel, bottom), click on Image Preprocessing. A new window will open.
- On the Bright Field tab, deselect “Apply image preprocessing.”
- For each Fluorescent channel tab, make sure “Apply image preprocessing” is selected. Deselect “Use same options as channel 1” and click OK. The window will close.
- Under ADD PROCESSING STEP, click on Z Projection. A new window will open. If desired, the slice range can be adjusted (e.g., to narrow the Z range). Close window by selecting OK.
- Create Protocol.
- Click “Image Set” in the toolbar. In the drop down menu, click “Create experiment from this image set.” The imaging window will close and the Procedure window will open.
- Note: The parameters selected in Imager Manual Mode will automatically be loaded into the new window whereby an experimental protocol can be created.
- Set the temperature and gradient: Click on Set Temperature under the Actions heading (left). A new window will open. Select “Incubator On” and manually enter the desired temperature under “Temperature.” Next, under “Gradient,” manually enter “1.” Close window by selecting OK.
- Note: Creating a 1 °C gradient will prevent condensation from forming on the lid of the plate.
- Designate wells to image.
- Double click on the Image step under description.
- Click “Full Plate” (right corner, top). This will open the Plate Layout window.
- Highlight wells of interest using the cursor. Click OK.
- If desired, check “Autofocus binning” and “Capture binning” boxes. Click OK to close window.
- Note: Binning will require exposure adjustment, as described in Step 2.2 above. Please refer to Data Management in the Discussion for specific scenarios in which this feature may be used.
- Set intervals for kinetic imaging.
- Click on Options under the Other heading (left).
- Check the “Discontinuous Kinetic Procedure” box.
- Under Estimated total time, enter the run time for the experiment (e.g., 5 days). Under Estimated interval, enter the interval at which to image the plate (e.g., every 6 hours).
- Click “Pause after each run” to allow time for the plate to be transferred to the BioSpa incubator. Close window by selecting OK.
- Update Data Reduction steps.
- Click OK to close the Procedure window. A tab will open to update data reduction steps. Select Yes.
- Double click on Image Preprocessing. Click through the different channels to verify settings. Click OK.
- Double click on Z Projection. Click through the different channels to verify settings. Click OK.
- Click OK to close the Data Reduction window.
- Format the Plate Layout.
- Open the Plate Layout Wizard and designate well types.
- Click on the Plate Layout icon
 in the toolbar (left corner, top). This will open the Plate Layout Wizard.
 - Check the boxes next to the well types used in the experiment. Under Assay Controls, enter the number of different control types using the arrows. Click Next. This will open the Assay Control #1 window.
- Set Assay Control well conditions.
- On the Assay Control #1 Window, enter control label in the Plate Layout ID box. If desired, enter the full name in adjacent box. Select the number of replicates for the respective control condition using the arrows.
- If using multiple concentrations or a dilution series within the control, click “Define dilutions/concentrations” and use the drop-down menu to select the Type. Enter values for each concentration/dilution in the table.
- Note: The auto function can be used if concentrations change by a consistent increment.
- Select the Color tab in toolbar. Choose desired Text color and Background Color for control in drop-down menu. Click Next.
- Repeat as necessary with additional controls.
- Set Sample well conditions.
- On the Sample set-up page, enter the sample ID Prefix (e.g., SPL). Select number of Replicates using the arrows. If using samples with varying treatment concentrations, select Concentrations or Dilutions in the Type drop-down menu. Enter dilutions/concentrations in the table and enter units in the Unit box.
- Select Identification Fields in the toolbar. Enter desired Category Name(s) (e.g., sample ID, drug) in the table.
- Select the Color tab in toolbar. Select a different color for each treatment group/sample.
- Note: The numbers on the left side correlate with the different sample numbers.
- Click Finish. This will open the Plate Layout page.
- Assign Sample IDs.
- Select SPL1 from the left panel. Use cursor to select wells.
- Note: Autoselect tools can be adjusted in the serial assignment box. Number of replicates and orientation of layout can be pre-designated.
- Repeat with other samples to complete plate layout. Once satisfied, click OK.
- In file toolbar, select Sample IDs. Fill in Sample ID columns with the appropriate information for each Sample (e.g., drug type). Press OK.
- Save the Protocol.
- In the toolbar, Click File > Save Protocol as.
- Select location to save file. Enter file name. Click Save to close window.
- Click File > Exit in the toolbar. A tab will open to save changes to Imager Manual Mode. Select No.
- A tab will open to save changes to Experiment 1. Select No.
- A tab will open to update the protocol definition. Select Update.
- Close Gen5 software.
- Import the Protocol into BioSpa OnDemand and finish setting up the Experiment.
- Open the BioSpa OnDemand software.
- Select an available slot in the BioSpa.
- Remove the plate from the Cytation 5. Click Open drawer to access the appropriate slot in the BioSpa and insert plate. Click Close drawer.
- Note: This step can be performed at any point once the Protocol has been created in Step 5.7 above. However, the plate must be in the Cytation 5 to perform a timing run in the below Step 6.4.5.
- Import the Protocol.
- Under the Procedure Info tab, select User in the drop-down menu.
- Next to Protocol slot, click Select > Add a new entry.
- Next to Protocol slot, click Select. This will open a new window to navigate to the desired Protocol in the file architecture.
- Click Open to import the Protocol into the BioSpa OnDemand software.
- Enter the amount of time needed to image the plate. Click OK to close the Gen5 Protocol List window.
- Note: This step is especially important when running several experiments at a time. To determine the time needed to image the, click “Perform a timing run now.” Click OK.
- Set imaging intervals and schedule the experiment.
- Under Interval, enter the imaging interval which was designated previously in Step 5.4 of Setting up Imaging Parameters.
- Under Start Time Options, select “When available.”
- Note: A specific start time can be designated instead of running the protocol at the next available time.
- Under Duration, select “Fixed” or “Continuous.”
- Note: Selecting Fixed duration will set a specific endpoint for the experiment and requires the user to designate an experimental timeframe. Continuous duration will allow the experiment to run with no endpoint and can only be ended by a user stopping the experiment.
- Click Schedule plate/vessel. This will open the Plate Validation Sequence. A tab will open with the proposed first read time. Click Yes to accept this schedule.
Image analysis in Gen5 software (Figure 2).
Figure 2: Overview of Cellular Analysis feature.

1: Designate Plug: A plug is designated to include areas of interest. 2: Set Primary Mask: The Primary Mask defines objects of interest based on size and pixel intensity in a channel of choice. In this representative image, objects included in the primary mask are outlined in purple. 3: Define Subpopulation: An additional subpopulation may be defined to further refine the desired population for analysis. The subpopulation in the example image (outlined in yellow) is defined based on circularity (>0.25) and area (>800). Images were acquired with a 4X objective.
- Open image analysis module.
- Open Gen5. In the Task Manager, select Experiments > Open. Select the experiment to open the file.
- Click Plate > View in the toolbar.
- Change Data drop-down menu to Z Projection.
- Double click on a well of interest.
- Select Analyze > “I want to setup a new Image Analysis data reduction step.” Click OK.
- Cellular Analysis:
- Primary Mask
- Under ANALYSIS SETTINGS, select Type: Cellular Analysis and Detection Channel: ZProj[Tsf[Bright Field]] (left panel, center).
- Click Options. This will open the Primary Mask and Count page. In the Threshold box, check “Auto” and click Apply. Click the “Highlight Objects” box (right panel, bottom) to show objects within the designated threshold. Adjust as necessary to include objects of interest.
- Note: Threshold settings are based on pixel intensity. For example, if the threshold is set to 5000, pixels with an intensity greater than 5000 will be included in the analysis.
- Under Object selection, designate the minimum and maximum object size (μm). Adjust as necessary to exclude cellular debris/single cells.
- Note: PDO size may vary significantly between different models and types. Use the measuring tool
 in the Gen5 software to determine the minimum and maximum PDO size thresholds for each model. Users may choose a smaller minimum PDO size threshold relative to the value provided by the measuring tool in order to prevent exclusion of PDO fragments at later timepoints after drug treatment.
- To limit the analysis to a certain region of the well, deselect “Analyze entire image” and click “Plug.” In the Image Plug Window, use the drop-down menu to select Plug shape. Adjust the size and position parameters as necessary to fit over the region of interest.
- Note: It is important to maximize the number of PDOs within the plug while also excluding PDO-free areas to minimize background. Designate a plug size that will consistently capture the majority of the objects of interest across replicates. Generating a plug that also excludes the edges of the dome is important as it excludes any objects that may appear distorted due to the refraction of light from the extreme curvature of the dome around the edges.
- Note: “Include primary edge objects” may also be deselected to only capture entire PDOs within the plug.
- Subpopulation Analysis. An example of subpopulation designation is provided in Figure 3.
- Click on Calculated Metrics in the Cellular Analysis toolbar. Click “Select or create object level metrics of interest” (right corner, bottom). Under Available object metrics, select metrics of interest (e.g., Circularity) and click the Insert button. Click OK.
- Note: Morphology and density of each PDO model will determine the best metrics of interest to distinguish the subpopulation.
- Click on Subpopulation Analysis in the Cellular Analysis toolbar. Click Add to create a new subpopulation. A pop-up window will open.
- If desired, enter a name for the subpopulation. Under Object metrics, select a metric of interest and press Add Condition. In the Edit Condition window, enter parameters for the chosen Object metric. Repeat with additional metrics as necessary.
- Note: Parameters may be adjusted manually or set using the finder tool. For example, to exclude debris, users could add Area as an Object metric and select objects smaller than 800. We also routinely use Circularity as an Object metric and include any objects with a circularity greater than 0.2-0.5, depending on the model.
- In the table at the bottom of the window, check the desired results to display. Click OK > Apply.
- To view the objects within the subpopulation, use the Object details drop-down menu (right panel, center) to select the subpopulation. Objects that fall within the parameters will be highlighted in the image.
- Note: To change the highlight colors of the primary mask and subpopulation, click “Settings” (right panel, bottom).
- To adjust subpopulation parameters, reopen the Subpopulation Analysis window from the Cellular Analysis toolbar. Select the subpopulation and click Edit.
- Click ADD STEP.
- Note: This will apply the same analysis to all wells within the experiment at all time points. In the drop-down menu on the Matrix page, different metrics can be selected for individual viewing.
Figure 3: Examples of subpopulation masking using the Cellular Analysis feature.

Subpopulations are defined in the Bright Field channel. The subpopulation in the example images (outlined in yellow) is defined based on circularity (>0.25) and area (>800). Images were acquired with a 4X objective.
Exporting data from Gen5 to Excel:
To customize a data file for export, select the Report/Export Builders icon
 in the toolbar. In the pop-up window, click New export to Excel.
On the Properties page of the pop-up window, select Scope > Plate and Content > Custom. Click on the Content option in the toolbar. Click Edit template, which will open the Excel program.
- Within the Excel program, select Add-ins > Table > Well Data. Hover over the various selections to see options for export. Select metric of interest (e.g., Object Mean[ZProj[Tsf[TRITC]]]).
- Note: Plate layout can be added to the Excel analysis template by selecting Add-ins > Protocol Summary > Layout.
An Edit window will open. In the Wells box, designate the wells for export either by Well-ID or Well #. Select OK. A template will be loaded into the Excel file. Close Excel program. The template is automatically saved.
Click OK on the New export to Excel window and Close the Report/Export Builders window.
Click the Export icon
 in the Gen5 toolbar. Check the box next to the desired Export file. Click OK. Gen5 will automatically populate the Excel template and open the file in Excel.
External data analysis:
Open the Export file (.xlsx) in Excel.
For each well, divide each individual value by the 0:00 time point value for that well. This will set time point 0 equal to 1 and each value beyond that will be relative to the initial reading.
Open a new file in the GraphPad Prism software. In this protocol, version 9.5.1 was used. Select the XY layout option.
Input labels for each data group. Copy and paste the time points and corresponding normalized values for each treatment group into the Prism table. A graph for the data will be automatically generated and can be found under “Graphs.”
REPRESENTATIVE RESULTS:
Our objective was to demonstrate the feasibility of using multiplexed live-cell imaging to assess PDO therapeutic response. Proof of concept experiments were performed in two separate PDO models of endometrial cancer: ONC-10817 and ONC-10811 (see Supplementary Figure S1 & S2 for ONC-10811 data). Apoptosis (annexin V staining) and cytotoxicity (Cytotox Green uptake) were kinetically monitored in response to the apoptosis-inducing agent, staurosporine. Specifically, PDOs were plated in 96-well plates, treated with Annexin V Red and Cytotox Green dyes, and placed in a 37 °C incubator overnight as diagrammed in Figure 1. We confirmed in two independent PDO models that treatment with Annexin V and Cytotox Green dyes is not toxic (Supplemental Figure S2). The following day, PDOs were treated with increasing concentrations of staurosporine (0.01 nM, 0.1 nM, 1 nM, 10 nM, 100 nM, 500 nM). Subsequently, protocols were established in the Gen5 software and experiments were set to run over a period 5 days, imaging every 6 hours. Data were analyzed using the Cellular Analysis function in the Gen5 software as described in the Image Analysis in Gen5 software protocol. The Primary Mask was set using the Auto threshold function with “Split touching objects” unchecked and with size parameters of minimum: 30 μm and maximum: 1000 μm. The PDO subpopulation was defined by circularity > 0.25. The Object Mean Intensities in the TRITC (annexin V, apoptosis) and GFP channels (Cytotox Green, cytotoxicity) within the designated PDO subpopulation were exported as an .xlsx file for further analysis. The Object Mean Intensity for each well at each time point in both the GFP and TRITC channels was normalized to time 0. Normalized fluorescence data were then transferred to a Prism file and visualized as a line plot.
Treatment with staurosporine resulted in a significant, dose-dependent increase in apoptosis and a decrease in cell health over time in comparison to vehicle control, as evidenced by the increase in Object Mean Intensity in both the TRITC (annexin V) and GFP (Cytotox) channels (Figure 4, Figure 5 and Supplemental Videos SV1–7). The 500 nM, 100 nM, and 10 nM doses of staurosporine each resulted in a statistically significant increase in both apoptosis and cytotoxicity over time (Figure 5A–C) as well as at the end of the experiment (Figure 5E,F). Furthermore, staurosporine effectively inhibited PDO growth and formation at these concentrations as demonstrated by an overall decrease in total PDO area, whereas the control wells exhibited an increase in PDO area (Figures 4 & 5D).
Figure 4: Staurosporine treatment results in a dose-dependent increase in apoptosis and cytotoxicity.

Bright Field images (4X objective) with GFP and TRITC fluorescence overlay are shown for the 500 nM, 10 nM, and 0.1 nM doses of staurosporine at 3 time points: 0 hr, 54 hr, 114 hr. Red fluorescent signal indicates apoptosis (annexin V) and green fluorescent signal indicates cytotoxicity (Cytotox).
Figure 5: Multiplexed fluorescent live-cell imaging to assess PDO response.

PDO model ONC-10817 was plated in 96-well plates and incubated with Annexin V Red (1:400) and Cytotox Green (200 nM) dyes overnight at 37 °C. The following day, PDOs were treated with increasing concentrations of staurosporine and were imaged every 6 hours for ~5 days. (A, B) Time and dose-dependent increase in cytotoxicity (A) or apoptosis (B) in response to staurosporine. Data were plotted as the Object Mean Intensity in the GFP or TRITC channel. (C) Comparison of time course of apoptosis and cytotoxicity in response to 100 nM or 500 nM staurosporine. Data were plotted as the Object Mean Intensity values in the GFP and TRITC channels. (D) Staurosporine inhibits growth of PDOs. Data were plotted as the average total PDO area. Data in A-D were normalized to PDO number at time 0 in each well and plotted as the mean and standard error of the mean (SEM). N=5 technical replicates per treatment. **** p < 0.0001 vs. vehicle control by 2-way ANOVA. (E) Representative Bright Field, GFP, and TRITC images of 500 nM staurosporine-treated PDOs vs. vehicle at the end of the experiment (114 hr). Images were acquired with a 4X objective. (F) Quantification of cytotoxicity, apoptosis, and viability at the 114 hr timepoint. GFP Object Mean Intensity (left) and TRITC Object Mean Intensity (middle) were calculated at the 114 hr timepoint using results from panels A-C. Viability (right) was assessed using the CellTiter-Glo 3D reagent per the manufacturer’s protocol. Raw luminescence (RLU) values were normalized to total PDO area at time 0 and plotted as the fold viability relative to vehicle control, which was set at 1.0. ** p<0.01, ***p<0.001, **** p<0.0001 vs. vehicle control via one-way ANOVA with Dunnet’s post-hoc test. N=5 technical replicates per treatment.
Since a major advantage of live-cell imaging is the ability to correct for variability in plating, we performed an experiment whereby cell viability was assessed as an endpoint measure. Proof-of-concept endpoint assay data were collected using a PDO model that was generated from a patient-derived xenograft of prostate cancer. Bright Field images were collected at the beginning of the treatment period (day 0), followed by addition of a dual dye reagent that measures both viability (acridine orange, AO) and cell death (propidium iodide, PI). The AO component emits a green fluorescent signal upon binding to double stranded DNA, an indicator of cell viability. The PI component stains dead nucleated cells and can be used to quantitate cell death in response to treatment. In order to account for variability in PDO plating, we devised a method to determine the number of PDOs per well at time 0 by converting Bright Field images to Digital Phase Contrast images (Supplemental Figure S3 and Supplemental Protocols).
Prostate cancer PDOs were treated with daunorubicin, a chemotherapy agent that causes cell death, for 7 days. Upon completion of the experiment, samples were stained with AOPI as described in Supplemental Protocols, followed by analysis of fluorescent images in Gen5. Figure 6A shows a panel of images from the AOPI endpoint assay on day 7. When comparing vehicle-treated PDOs (row one) to PDOs treated with 10 μM daunorubicin (row two), there was a clear decrease in green fluorescence (measure of viability, column two) and an increase in red fluorescence (measure of cell death, column three). These results were then quantitated in Figure 6B, where we show the array of readouts that can be achieved using the AOPI endpoint staining technique. The upper left plot depicts the viability measurement generated from the AO stain, normalized to the PDO count determined by Digital Phase Contrast image analysis of each well on Day 0. These data correlate with the visual result from Figure 6A, whereby as the concentration of daunorubicin increased, the viability drastically decreased. This is further recapitulated in the upper right graph which demonstrates an increase in cell death denoted by an increase in red fluorescence acquired with the PI stain.
Figure 6: Use of live-cell imaging to aid in normalization of endpoint assay data.

PDOs were treated with increasing concentrations of the topoisomerase-II inhibitor, daunorubicin, for 7 days. PDOs were exposed to AOPI Staining Solution and imaged as described in Supplemental Protocols. AO= acridine orange, a measure of viability (GFP channel); PI= propidium iodide, a measure of cell death (Texas Red channel). (A) Representative images acquired using AOPI staining after 7 days of treatment with 10 μM daunorubicin or vehicle control (0.1% DMSO). (B) Different readouts using AOPI fluorescence as an endpoint viability/cell death method. See Supplemental Protocols for a detailed description of the analysis methods. Upper left, analysis of PDO viability after 7 days as determined by AO staining. Upper right, analysis of cell death by PI staining. Data for AO and PI staining were normalized to PDO number at time 0 and then to vehicle control, which was set at 1.0, and plotted as the mean and standard deviation. Lower left, calculation of viable to dead ratio using the average object integrals for the AO and PI stains. Lower right, area of PDOs as determined by AO staining. Cellular Analysis was performed in the GFP channel. (C) Comparison of two methods to test PDO viability. After imaging, viability was evaluated using the CellTiter-Glo 3D reagent per the manufacturer’s protocol. The fold survival relative to vehicle control was plotted at increasing concentrations of daunorubicin. Data represent the mean and standard deviation for N=6 technical replicates per treatment; data were not normalized to time 0 in panel C.
The PI data were then combined with the viability reading (AO) to calculate a Viable to Dead Ratio (Figure 6B, lower left graph). This ratio is a useful approach to determine whether a drug is cytostatic or cytotoxic. Specifically, a cytotoxic drug will reach much closer to 0 than a cytostatic drug, due to the fact a drug that is cytostatic will inhibit growth but may not induce cell death. Lastly, the area of the PDOs can be accurately calculated using the green fluorescence of the AO stain, even when PDOs may be undergoing cell death and blebbing. The lower right graph depicts the average PDO area, which was calculated as the sum of the area denoted in the subpopulation analysis divided by the PDO number. Analysis of area can give further indication as to whether a treatment is simply inhibiting PDO growth or actually causing PDO regression. Note that the analysis of average PDO area was performed using the GFP channel and Cellular Analysis function, in contrast to Figure 5D that used the Bright Field images to calculate total PDO area. These data highlight the flexibility of the analysis pipeline depending on data availability and user interest.
Finally, we compared the gold standard for viability readings, CellTiter-Glo 3D, to the viability fluorescence reading using AOPI (Figure 6C). Note that the data in this panel were not normalized to the time 0 PDO number since this normalization is not typically performed by labs using the CellTiter-Glo 3D kit. We observed the same trend for drug effect in both assays, whereby PDO viability decreased as the daunorubicin concentration increased. The only visual difference between these readouts was that the CellTiter-Glo 3D analysis reached an IC50 before the AOPI analysis and nearly completely reached 0. This result may be explained by the mechanism of action of daunorubicin. Daunorubicin is a topoisomerase-II inhibitor that introduces double stranded DNA breaks, leading to cell cycle arrest and eventually apoptosis14. During cell cycle arrest, ATP depletion can occur15. Given that the CellTiter-Glo 3D assay is based on an ATP-luciferase reaction to generate a luminescence signal, we hypothesize that the stronger reduction in cell viability at higher concentrations of daunorubicin was due to ATP depletion rather than complete cell death. Supporting this idea, the images in Figure 6A depict a population living PDOs in the culture, as denoted by green fluorescence.
DISCUSSION:
PDO cultures are becoming an increasingly popular in vitro model system due to their ability to reflect cellular responses and behaviors2. Significant advances have been made in PDO generation, culture and expansion techniques, yet methods to analyze therapeutic responses have lagged. Commercially available 3D viability kits are lytic endpoint assays, missing out on potentially valuable kinetic response data and limiting subsequent analyses by other methods8. Emerging studies are applying live-cell imaging to assess drug responses in PDO models. Here, we present a method to assess PDO therapeutic responses over time utilizing multiplexed fluorescent live-cell imaging. Multiplexing fluorescent dyes allows for different cellular responses to be quantified simultaneously. In addition to apoptosis and cytotoxicity, we envision that this approach can be expanded in future studies to examine other phenotypic effects in PDOs.
Critical steps within the protocol
The protocol presented herein is designed to acquire kinetic bright-field and fluorescent images of PDOs plated as domes in a 96-well plate. Key steps include 1) plating; 2) treating with dye and drug; 3) defining imaging parameters; 4) image preprocessing and analysis at the completion of kinetic image acquisition; and 5) data export for analysis in other statistical software (Figure 1). Intact PDOs are plated in a 96-well plate as 5 μL BME domes composed of a predefined ratio of BME and Organoid Culture Media (typically 1:1). The protocol presented herein uses UltiMatrix as the BME due to minimal batch-to-batch variability and superior optical properties for imaging. Modifications for harvesting PDOs cultured in other BMEs such as Matrigel may be necessary, as well as for models that are clumpy and difficult to dissociate (see examples Supplemental Figure S4). Next, fluorescent dyes are added to the Organoid Culture Media at the time of plating (Day-1) at a 2X concentration in a 100 μl volume and incubated overnight to determine baseline cell death. The following day (Day 0), drugs or other treatments are added to Organoid Culture Media at a 2X concentration in a 100 μl volume, and then added to each well for a final volume of 200 μl. The final volume of 200 μl reduces the meniscus effect with imaging. Kinetic images are acquired using the Cytation 5 plate reader partnered with the BioSpa tabletop incubator. The BioSpa incubator allows for incubation of experimental plates at a fixed temperature of 37 °C and 5% CO2 environment. Up to 8 plates can be stored in the BioSpa and thereby 8 experiments can be simultaneously conducted. Imaging parameters for each plate are set up in the Gen5 software using “Imager Manual Mode” and saved as a Protocol. The Protocol is then loaded into the scheduling software (BioSpa OnDemand). The BioSpa OnDemand software automates the workflow for kinetic image acquisition, including physical transfer of the plate from the BioSpa incubator into the Cytation 5 and dictating which protocol to run in Gen5 for data collection. Images are analyzed using the Cellular Analysis function in the Gen5 software (Figure 2). We describe specific methods to analyze Z Projections of fluorescent and Bright Field images. Specific methods to analyze single Z planes and/or only Bright Field images are provided in Supplemental Protocols. Finally, users can define specific data features, such as PDO area, number, and mean fluorescence intensity, to export as an Excel spreadsheet for subsequent statistical analysis of drug effects.
Significance with respect to existing methods
Given that PDO models are a relatively new model system to interrogate drug effects, methods to accommodate the culture conditions, in particular growth in BME, are still emerging16. The bulk of studies assessing PDO response to drug treatment rely on ATP-based endpoint assays as a surrogate for cell health (CellTiter-Glo 3D). This method requires cell lysis, thus precluding subsequent downstream analyses. Alternative endpoint assays, such as fluorescent staining, single timepoint imaging, and morphologic tracking, have provided other metrics to characterize drug response while allowing for sample use for additional purposes. For example, in-plate endpoint fixation protocols have been applied for high-throughput analysis of drug effects17,18. An advantage of this method is that it circumvents the extensive processing required in typical immunohistochemistry and immunofluorescent imaging19 and is particularly useful when sample is limited, as is the case for PDO models. It is also amenable to high-resolution imaging with confocal microscopy. Another endpoint assay that does not require cell lysis is live-cell imaging with reagents such as propidium iodide or acridine orange. Our comparative analysis of CellTiter-Glo 3D and AOPI, the latter of which does not require cell lysis, for assessment of cell viability and death (Figure 6C) highlights the advantages of using live-cell imaging dyes in PDO models. This method has been applied by several groups, including ours, to assess phenotypic effects at the conclusion of an experiment18–20. However, kinetic data acquisition using either the in-well fixation or endpoint live-cell imaging methods require significant sample. Label-free morphologic assessment of PDOs over time in part overcomes this limitation and can be assessed using a wide range of imaging modalities8,10,17,18, yet changes in morphology may not be representative of the spectrum of potential drug effects such as apoptosis and changes in cell viability. We have observed significant model-to-model variability in morphologic changes in response to drugs. For example, some PDOs will increase in area as they are undergoing apoptosis, whereas other models may shrink. Kinetic morphologic assessments have been multiplexed with either fixed or live-cell fluorescent endpoint assays in a limited number of studies18,20. The methods presented herein are among the first to multiplex different fluorescent dyes to simultaneously assess multiple cellular effects in a high-throughput system.
Method troubleshooting and modifications
One of the greatest improvements provided by kinetic live-cell imaging is that it overcomes key limitations associated with endpoint assays. For example, plating an equal number of organoids per well is technically difficult because most automated cell counters are gated for objects smaller than 60 μm. Live-cell imaging allows for normalization to PDO number or area at time 0 in each well, which can then be used to adjust for variation in plating amongst wells. The gold standard endpoint assay for PDOs is the CellTiter-Glo 3D kit, which measures ATP as a surrogate for cell viability. We have extensively used this assay in our studies of gynecologic and prostate cancer PDOs13,21–24. In addition to requiring cell lysis for ATP measures, drugs and other therapeutic modalities can alter ATP levels, potentially providing an inaccurate assessment of therapeutic response. Utilizing live-cell imaging dyes allows for quantification of a wider scope of specific cellular responses, such as apoptosis and cytotoxicity. Importantly, these reagents do not perturb cell viability or induce DNA damage, as is the case with propidium iodide; this allows for repeated assessment of PDO response over time. While we have not explored the use of acridine orange (AO) for kinetic measures, the mechanism of action for AO should not preclude such application in the future.
Tumors consist of several distinct cell populations with varying genomic profiles and morphologies. Due to the complex heterogeneity of PDO models, individual organoid responses may vary and tracking these responses is challenging. Our protocol provides a method to assess multiple organoid response metrics on a well-by-well basis. However, certain technical considerations still apply for live-cell imaging. The number of wells of a 24-well plate needed to seed a 96-well plate will depend upon the density and growth rate of each PDO model. Because clumping can confound image analysis (Supplemental Figure S4), PDO models may need additional processing steps prior to plating. If necessary, PDOs may be mechanically sheared during processing through vigorous pipetting with a non-wide bore p200 tip. Enzymatic digestion using TrypLE Express may also be employed prior to plating to promote PDO dissociation and decreased clumping. In our experience, we have noted that the length of TrypLE incubation is highly variable depending upon the model. Therefore, TrypLE incubation should be optimized for each model, particularly if researchers wish to obtain single cell suspensions. Recovery time prior to beginning treatment may be necessary for PDO models that are particularly sensitive to enzymatic digestion.
We present methods for specific live-cell imaging reagents. A limitation in the broad applicability of the methods presented herein is a paucity of reagents that are compatible with BME. For other dyes/reagents that have not yet been optimized for use in PDOs, additional troubleshooting may be necessary to determine the optimal concentration and minimize solvent effects. Depending on the readout of interest (e.g., apoptosis or cytotoxicity), treatment with a compound known to induce cell death, such as staurosporine or daunorubicin13 should be used to optimize reagent conditions. An additional consideration is the optimal time for dye integration into the BME dome. In our experiments, we perform an overnight incubation prior to treatment to allow for complete uptake of the dye into the domes as well as determine baseline cell health. Since signal intensity will increase over time, researchers should perform pilot studies with the dyes to determine the ideal exposure time at the end of the experiment to avoid overexposed images. Finally, reagents should not interfere with cellular processes. For example, dyes that intercalate into DNA are not compatible with kinetic imaging. However, live-cell imaging can be used for data normalization in endpoint assays. Indeed, we present a supplementary method to quantify cell viability and the viable:dead cell ratio using AOPI. In this experiment, the fluorescent signal is normalized to PDO number for each well as determine by live-cell imaging on day 0 (day of treatment, Figure 6).
Another limitation in this methods paper is the reliance on manual pipetting for experiments, which can lead to greater variance in technical replicates. Further improvements in data reproducibility can be achieved with addition of automation to other steps of the experimental process, such as use of automated liquid handler for plating and drug dispensing as has been demonstrated by others8,10. However, this addition requires an additional investment in research infrastructure that may not be available to all investigators. Given the heterogeneity in PDO area for each model, normalizing results to the initial PDO number or area at time 0 is still a useful approach with automated seeding.
Choosing metrics for analysis
A key advantage of the Cytation 5 over other live-cell imaging platforms is the ability to customize image and analysis features. However, the Cytation 5/Gen5 software has a steep learning curve and assumes that users have a foundational knowledge of imaging. One of our goals of this methods paper is to provide step-by-step instructions to decrease the barrier for other researchers to incorporate sophisticated live-cell imaging techniques in their PDO research programs. While the specific analysis steps presented herein are for one system, users can apply the multiplexing principles to other platforms, with the understanding that downstream analysis may necessitate use of third-party software, such as NIH ImageJ.
Analysis metrics should be chosen based on both experimental goals and plating conditions. For example, if the experiment is conducted using a fluorescent dye to quantify cell death, fluorescence intensity is an effective read-out. The most effective fluorescence metric (Total Fluorescence vs. Object Mean Intensity) will depend on the plating conditions (Supplemental Figure S4). If PDOs are evenly dispersed and are of a more circular, cohesive morphology, fluorescence can be determined in a defined PDO subpopulation. The specific function in the Gen5 software is Cellular Analysis and the output is Object Mean Intensity. However, if the PDO model is clumpy or has a discohesive morphology, we recommend quantifying the fluorescence signal at the image level; this function can be found under Image Statistics and the output is Total Fluorescence Intensity. While this method is useful for observing changes at the individual well level, this metric is not specific for objects of interest and could change erroneously if the PDOs move outside of the designated plug over the duration of the experiment. In scenarios in which there is significant debris or dead single cells, use of the Cellular Analysis is suggested to gate out any fluorescent signal that is not specifically associated with a PDO. An example of differential results using Cellular Analysis vs. Image Statistics is presented in Supplemental Figure S5.
To determine the optimal threshold for the Image Statistics function, the line tool may be utilized to determine the starting point. Using the line tool, users can determine the range of fluorescence intensity within an image. We set the background as the 25% value of the peak intensity within the image and designate this value as the lower threshold. To view the fluorescent areas that are included in the designated threshold, check the “Threshold Outliers” box. Additional fine-tuning of the lower threshold value may be necessary.
Data management
A significant challenge in live-cell imaging is storing the massive amount of data generated with each experiment. This is particularly relevant in the case of PDO cultures, where Z-Stacks are used to image across several focal planes and generate a Z Projection. There are multiple methods to overcome this issue. First, ensure adequate storage capacity. We have installed three solid state hard drives with a total of 17 TB. Other options include transferring experimental files to external hard drives or networked storage. It is not recommended to directly write files to cloud based storage. To analyze data that has been stored on an external drive, simply transfer the experiment and the image files to a computer equipped with Gen5 software (NOTE: large files may take extended periods of time to transfer). Before analysis, the images must be re-linked to the experiment. Open the experiment file, click Protocol in the toolbar, select Protocol Options. Click Image Save Options and click Select new image folder. Locate the image file and click Select Folder to relink.
Depending on the goals of the experiment, it may also be suitable to use the binning feature within Gen5. Binning decreases file size by lowering the number of pixels, which leads to lower image resolution (see Step 5.3.4 in Setting up imaging parameters section). Therefore, binning is not recommended if high resolution images are required. When using the binning feature, the exposure settings will need to be adjusted. Once the experimental file has been created, double click on the Image section, and click the microscope icon to reopen Imager Manual Mode. Use the Auto-expose function or manually adjust exposure as needed.
Conclusions
In summary, we present methods for assessing apoptosis and cell health of PDOs in response to cytotoxic agents. Future studies are necessary to optimize methods and develop additional analysis strategies for kinetic imaging of PDOs, such as other phenotypes and effects of drugs that are cytostatic rather than cytotoxic. A major roadblock is the commercial availability of dyes and reagents that are compatible with BME. There is still more work necessary to better understand how kinetic live-cell imaging can be fully utilized to extract the most data from these models.
Supplementary Material
ACKNOWLEDGMENTS:
We are grateful to the Tissue Procurement Core and Dr. Kristen Coleman at the University of Iowa for providing patient tumor specimens and to Dr. Sofia Gabrilovich in the Department of Obstetrics and Gynecology for assisting with patient-derived organoid model generation. We also thank Dr. Valerie Salvatico (Agilent, USA) for critical analysis of the manuscript. We acknowledge the following funding sources: NIH/NCI CA263783 and DOD CDMRP CA220729P1 to KWT; Cancer Research UK, Prostate Cancer UK, Prostate Cancer Foundation and Medical Research Council to JSdB. The funders had no role in the design or analysis of experiments or decision to publish.
DISCLOSURES:
KWT is a co-owner of Immortagen Inc. CJD is an employee of Agilent. JSdB has served on advisory boards and received fees from Amgen, Astra Zeneca, Astellas, Bayer, Bioxcel Therapeutics, Boehringer Ingelheim, Cellcentric, Daiichi, Eisai, Genentech/Roche, Genmab, GSK, Harpoon, ImCheck Therapeutics, Janssen, Merck Serono, Merck Sharp & Dohme, Menarini/Silicon Biosystems, Orion, Pfizer, Qiagen, Sanofi Aventis, Sierra Oncology, Taiho, Terumo, and Vertex Pharmaceuticals; is an employee of the Institute of Cancer Research (ICR), which have received funding or other support for his research work from AZ, Astellas, Bayer, Cellcentric, Daiichi, Genentech, Genmab, GSK, Janssen, Merck Serono, MSD, Menarini/Silicon Biosystems, Orion, Sanofi Aventis, Sierra Oncology, Taiho, Pfizer, and Vertex, and which has a commercial interest in abiraterone, PARP inhibition in DNA repair defective cancers, and PI3K/AKT pathway inhibitors (no personal income); was named as an inventor, with no financial interest for patent 8 822 438, submitted by Janssen that covers the use of abiraterone acetate with corticosteroids; has been the CI/PI of many industry-sponsored clinical trials; and is a National Institute for Health Research (NIHR) Senior Investigator. No other authors have any potential conflicts of interest to disclose.
REFERENCES:
- 1.Drost J. & Clevers H. Organoids in cancer research. Nat Rev Cancer. 18 (7), 407–418, doi: 10.1038/s41568-018-0007-6, (2018). [DOI] [PubMed] [Google Scholar]
- 2.Lohmussaar K., Boretto M. & Clevers H. Human-Derived Model Systems in Gynecological Cancer Research. Trends Cancer. 6 (12), 1031–1043, doi: 10.1016/j.trecan.2020.07.007, (2020). [DOI] [PubMed] [Google Scholar]
- 3.Sachs N. et al. A Living Biobank of Breast Cancer Organoids Captures Disease Heterogeneity. Cell. 172 (1-2), 373–386 e310, doi: 10.1016/j.cell.2017.11.010, (2018). [DOI] [PubMed] [Google Scholar]
- 4.de Witte C. J. et al. Patient-Derived Ovarian Cancer Organoids Mimic Clinical Response and Exhibit Heterogeneous Inter- and Intrapatient Drug Responses. Cell Rep. 31 (11), 107762, doi: 10.1016/j.celrep.2020.107762, (2020). [DOI] [PubMed] [Google Scholar]
- 5.Adan A., Kiraz Y. & Baran Y. Cell Proliferation and Cytotoxicity Assays. Curr Pharm Biotechnol. 17 (14), 1213–1221, doi: 10.2174/1389201017666160808160513, (2016). [DOI] [PubMed] [Google Scholar]
- 6.Driehuis E., Kretzschmar K. & Clevers H. Establishment of patient-derived cancer organoids for drug-screening applications. Nat Protoc. 15 (10), 3380–3409, doi: 10.1038/s41596-020-0379-4, (2020). [DOI] [PubMed] [Google Scholar]
- 7.Alzeeb G. et al. Gastric cancer cell death analyzed by live cell imaging of spheroids. Sci Rep. 12 (1), 1488, doi: 10.1038/s41598-022-05426-1, (2022). [DOI] [PMC free article] [PubMed] [Google Scholar]
- 8.Deben C. et al. OrBITS: label-free and time-lapse monitoring of patient derived organoids for advanced drug screening. Cell Oncol (Dordr). 46 (2), 299–314, doi: 10.1007/s13402-022-00750-0, (2023). [DOI] [PMC free article] [PubMed] [Google Scholar]
- 9.Tamura H. et al. Evaluation of anticancer agents using patient-derived tumor organoids characteristically similar to source tissues. Oncol Rep. 40 (2), 635–646, doi: 10.3892/or.2018.6501, (2018). [DOI] [PMC free article] [PubMed] [Google Scholar]
- 10.Le Compte M. et al. Multiparametric Tumor Organoid Drug Screening Using Widefield Live-Cell Imaging for Bulk and Single-Organoid Analysis. J Vis Exp. (190), doi: 10.3791/64434, (2022). [DOI] [PubMed] [Google Scholar]
- 11.Hanson K. M. & Finkelstein J. N. An accessible and high-throughput strategy of continuously monitoring apoptosis by fluorescent detection of caspase activation. Anal Biochem. 564-565 96–101, doi: 10.1016/j.ab.2018.10.022, (2019). [DOI] [PMC free article] [PubMed] [Google Scholar]
- 12.Isherwood B. et al. Live cell in vitro and in vivo imaging applications: accelerating drug discovery. Pharmaceutics. 3 (2), 141–170, doi: 10.3390/pharmaceutics3020141, (2011). [DOI] [PMC free article] [PubMed] [Google Scholar]
- 13.Bi J. et al. Successful Patient-Derived Organoid Culture of Gynecologic Cancers for Disease Modeling and Drug Sensitivity Testing. Cancers (Basel). 13 (12), doi: 10.3390/cancers13122901, (2021). [DOI] [PMC free article] [PubMed] [Google Scholar]
- 14.Binaschi M., Zunino F. & Capranico G. Mechanism of action of DNA topoisomerase inhibitors. Stem Cells. 13 (4), 369–379, doi: 10.1002/stem.5530130408, (1995). [DOI] [PubMed] [Google Scholar]
- 15.Park Y. Y., Ahn J. H., Cho M. G. & Lee J. H. ATP depletion during mitotic arrest induces mitotic slippage and APC/C(Cdh1)-dependent cyclin B1 degradation. Exp Mol Med. 50 (4), 1–14, doi: 10.1038/s12276-018-0069-2, (2018). [DOI] [PMC free article] [PubMed] [Google Scholar]
- 16.Lukonin I., Zinner M. & Liberali P. Organoids in image-based phenotypic chemical screens. Experimental & Molecular Medicine. 53 (10), 1495–1502, doi: 10.1038/s12276-021-00641-8, (2021). [DOI] [PMC free article] [PubMed] [Google Scholar]
- 17.Herpers B. et al. Functional patient-derived organoid screenings identify MCLA-158 as a therapeutic EGFR x LGR5 bispecific antibody with efficacy in epithelial tumors. Nat Cancer. 3 (4), 418–436, doi: 10.1038/s43018-022-00359-0, (2022). [DOI] [PubMed] [Google Scholar]
- 18.Ramm S. et al. High-Throughput Live and Fixed Cell Imaging Method to Screen Matrigel-Embedded Organoids. Organoids. 2 (1), 1–19 (2023). [Google Scholar]
- 19.Dekkers J. F. et al. High-resolution 3D imaging of fixed and cleared organoids. Nat Protoc. 14 (6), 1756–1771, doi: 10.1038/s41596-019-0160-8, (2019). [DOI] [PubMed] [Google Scholar]
- 20.Van Hemelryk A. et al. Viability Analysis and High-Content Live-Cell Imaging for Drug Testing in Prostate Cancer Xenograft-Derived Organoids. Cells. 12 (10), doi: 10.3390/cells12101377, (2023). [DOI] [PMC free article] [PubMed] [Google Scholar]
- 21.Bi J. et al. Advantages of Tyrosine Kinase Anti-Angiogenic Cediranib over Bevacizumab: Cell Cycle Abrogation and Synergy with Chemotherapy. Pharmaceuticals (Basel). 14 (7), doi: 10.3390/ph14070682, (2021). [DOI] [PMC free article] [PubMed] [Google Scholar]
- 22.Bi J. et al. Blocking autophagy overcomes resistance to dual histone deacetylase and proteasome inhibition in gynecologic cancer. Cell Death Dis. 13 (1), 59, doi: 10.1038/s41419-022-04508-2, (2022). [DOI] [PMC free article] [PubMed] [Google Scholar]
- 23.Guo C. et al. B7-H3 as a Therapeutic Target in Advanced Prostate Cancer. Eur Urol. 83 (3), 224–238, doi: 10.1016/j.eururo.2022.09.004, (2023). [DOI] [PMC free article] [PubMed] [Google Scholar]
- 24.Gil V. et al. HER3 Is an Actionable Target in Advanced Prostate Cancer. Cancer Res. 81 (24), 6207–6218, doi: 10.1158/0008-5472.CAN-21-3360, (2021). [DOI] [PMC free article] [PubMed] [Google Scholar]
Associated Data
This section collects any data citations, data availability statements, or supplementary materials included in this article.