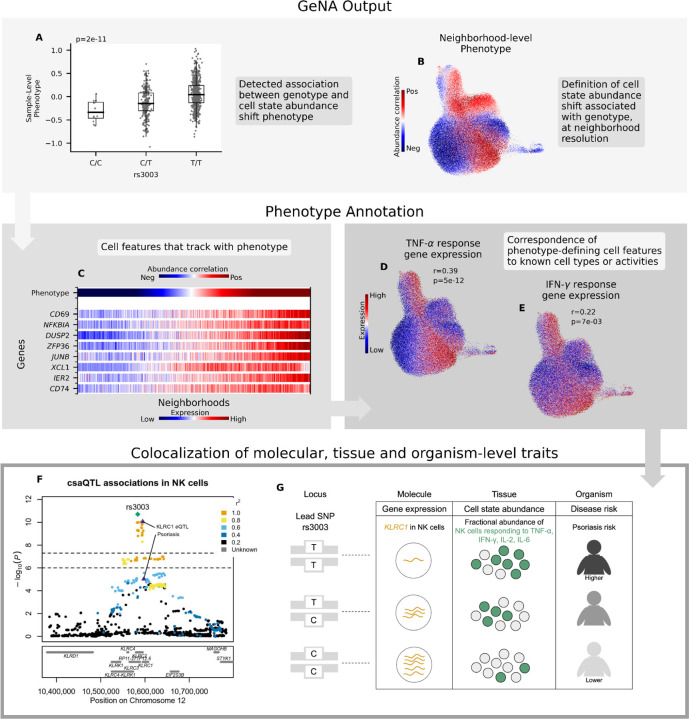
Figure 3: Characterization of the csaQTL at 12p13.2.
(A-B) GeNA output: (A) Boxplot of sample-level phenotype values for each individual organized by genotype at the lead SNP. We also show the GeNA p-value. (B) UMAP of NK cells colored by neighborhood-level phenotype value (i.e., correlation between cell abundance and dose of alternative allele per neighborhood). (C) Heatmap of expression across neighborhoods for genes with strong correlations in expression to csaQTL neighborhood-level phenotype. Neighborhoods are arrayed along the x-axis by phenotype value. The phenotype-correlated genes include general markers of NK activation (CD69, NFKBIA) as well as TNF-α (DUSP2, ZFP36, JUNB, IER2) and IFN-γ (CD74, XCL1) response genes. (D-E) Gene set enrichment analysis identified significant activation of TNF-α and IFN-γ response pathways in association with the csaQTL phenotype. We show UMAPs of NK cells colored by summed expression of (D) TNF-α response genes and (E) IFN-γ response genes. We report the Pearson’s r across neighborhoods between phenotype values and summed expression within the gene set. We also show the FDR-adjusted gene set enrichment p-value. (F) Locus zoom plot with one marker per tested SNP, genomic position along the x-axis, and GeNA p-value on the y-axis. Each SNP marker is colored by linkage disequilibrium (LD) value relative to the lead SNP. The csaQTL lead SNP is labeled with a green diamond. The psoriasis risk and KLRC1 eQTL lead SNPs are labeled with purple triangles. (G) Diagram of genotypes for the csaQTL lead SNP and colocalizing associations to molecular, tissue and organism-level traits at this locus.

