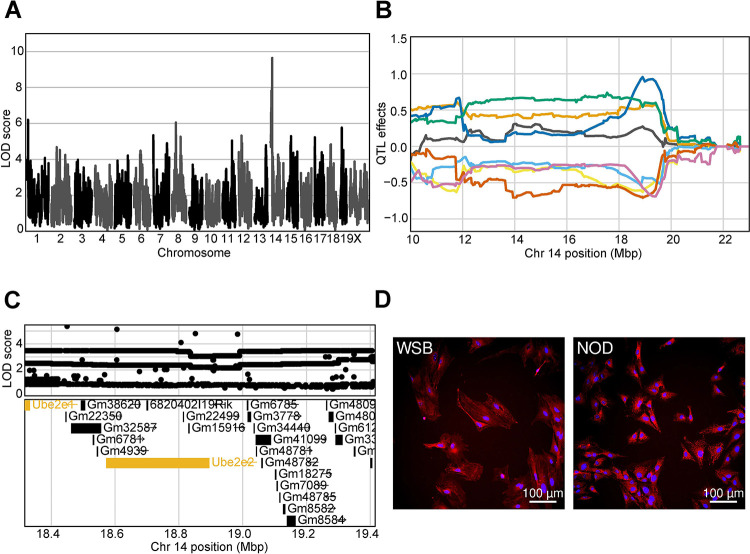
Figure 7: Genetic variation influences fibroblast morphology at baseline.
(A) QTL scan for the ‘Hoechst 33342 texture bright 1 pixel mean per well’ cmQTL with the maximum peak at chromosome 14: 19401644 bp (GRCm38) and a LOD score of 9.64.
(B) Allele effects plot showing the eight DO founders (colors, see Methods) for the ‘Hoechst 33342 texture bright 1 pixel mean per well’ cmQTL across the surrounding region on chromosome 14 (Mbp).
(C) Variant association mapping within the Cl the cmQTL ‘Hoechst 33342 texture bright 1 pixel mean per well’. Top panel shows the LOD scores of the known, segregating variants in the 8 DO founders (m38). Bottom panel shows the gene models within the respective Cl. Each point represents a variant. Colors indicate whether a gene is expressed > 0.5 TPM (gold) or < 0.5 TPM (black). The arrow indicates the direction of transcription.
(D) Representative images for the two fibroblast lines showing higher Hoechst 33342 texture bright in the sample with the NOD allele at the chromsome 14 locus comapred to the WSB. Nuclei are labeled in blue by Hoechst 33342 labeling and mitochondria are labeled in red by MitoTracker Deep Red. Scale bar indicates 100 μm.

