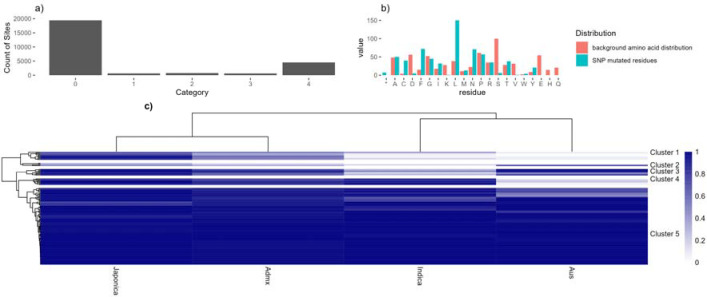
Figure 4.
A) Bar chart showing counts of phosphosite by SAAV category; B) Counts of substituted amino acid in category 1 phosphosites, including the normalised background distribution of that amino acid (*=stop codon); C) A heat map to show the assumed major allele frequency (i.e. frequency of Ser / Thr within the 3K “pseudo-proteins” from the rice 3K SNP set) of the phosphosite in four rice family groups: Japonica, admixed, Indica and Aus. Allele frequencies are filtered for total difference between families >0.05 to remove genes showing the same frequency across all families.

