Abstract
OBJECTIVES
Therapeutic drug monitoring in pediatric inflammatory bowel disease (IBD) has been used to achieve and maintain remission. Few guidelines exist to aid clinicians in the adjustment of anti–tumor necrosis factor therapies. The objective was to assess the agreement between real-world postinduction and posteriori analysis of retrospective data, using 2 novel pharmacokinetic (PK) models for adalimumab.
METHODS
A retrospective chart review was conducted in pediatric IBD patients treated with adalimumab. A Bayesian clinical decision support tool (InsightRX) was used. Postinduction serum concentration measurements of adalimumab were performed by drug-tolerant, homogenous shift mobility assay. Predicted serum adalimumab concentrations from both models were compared to the actual serum concentrations through a Bland-Altman analysis. Paired sample t test was used for equivalence.
RESULTS
A total of 47 patients were included. Forty-one patients (87%) had Crohn disease, and 30 (64%) were male. Most were induced with 160 mg of adalimumab and maintained on 40 mg biweekly. No significant difference resulted between the de Klaver average prediction and mean population concentration (p = 0.294). Significant difference was observed between Ternant and mean population serum adalimumab concentration (p < 0.001). The Bland-Altman plot for the de Klaver method showed no proportional bias. Additionally, 49% of patients required a dose adjustment during maintenance therapy.
CONCLUSIONS
The de Klaver model was able to provide less bias than the Ternant model and may aid in predicting serum adalimumab concentrations. Approximately half of the patients required dose adjustment during maintenance therapy to obtain a therapeutic drug concentration or achieve clinical remission.
Keywords: adalimumab, Crohn disease, inflammatory bowel diseases, pediatrics, pharmacokinetics, therapeutic drug monitoring, tumor necrosis factor alpha
Introduction
Inflammatory bowel disease (IBD) is primarily composed of ulcerative colitis (UC) and Crohn disease (CD). These are debilitating, chronic conditions that can lead to insufficient growth, late pubertal development, and psychosocial problems in children and adolescents. Tumor necrosis factor α (TNF-α) has increased expression in the mucosa of inflamed intestines. Therefore, anti–TNF-α medications can be used to induce and maintain remission in both adult and pediatric patients. Currently, adalimumab and infliximab are the only monoclonal antibodies directed against TNF-α and approved by the US Food and Drug Administration for the treatment of IBD in pediatric patients.
Although IBD can be treated on the basis of symptomatic relief, data increasingly suggest that full healing of the mucosa, or endoscopic remission, is a more appropriate treatment target to achieve long-term outcomes. Therapeutic drug monitoring (TDM) allows for optimization of therapy to increase the chance of achieving meaningful end points, such as endoscopic remission.1 Therapeutic drug monitoring has previously been used to guide clinical decisions for patients with IBD undergoing treatment with infliximab. Deora and colleagues2 obtained 107 serum concentrations from 73 children being treated with infliximab. They found that 35% of the serum infliximab concentrations were suboptimal (≤3.5 mcg/mL), and 34% required an increase in dosing frequency. Performing TDM in these patients allowed significant clinical improvements. Similarly, Roblin et al3 found endoscopic remission occurred more frequently with an adalimumab trough concentration of 6.5 mg/L, compared with a trough concentration of 4.2 mcg/mL. Study patients who initially did not achieve endoscopic remission attained this goal after undergoing a dose intensification. According to Lehtomäki et al,4 induction serum adalimumab concentration >7.5 mg/L was statistically significant for patients continuing maintenance therapy at 1 year. Patients still receiving therapy at 1 year had higher albumin levels; 89% were steroid free and had higher rates of clinical and histologic remission. A comprehensive literature review was performed by Papamichael and colleagues5 to develop consensus statements on appropriate target serum drug concentrations for biologics in use for IBD. In a consensus statement in regard to adalimumab the authors concluded the minimum drug concentration at week 4 for adalimumab should be at least 5 mg/mL. Serum drug concentrations greater than 7 mg/mL are associated with an increased likelihood of mucosal healing.5 A trough concentration of adalimumab is commonly drawn at the end of the induction period and before beginning maintenance dosing (week 4). In their POETIC study, Ungar and colleagues6 recently suggested that typical peaks and troughs of many medications may not be as widely varying with adalimumab. The authors checked serum adalimumab concentrations at 4 time points during a 2-week dosing interval, and the concentrations were not statistically different. Therefore, the time at which a serum adalimumab concentration would need to be drawn could vary with a lower risk of inaccuracy.
Adalimumab is currently prescribed in maintenance therapy as a standard dose, based on weight categories, every other week. However, current data have demonstrated a primary nonresponse rate of 10% to 40% and a secondary nonresponse rate of 21% to 46%.7 Primary nonresponse occurs when a patient continues to display symptoms of active disease, such as abdominal pain, rectal bleeding, or worsening stool frequency, despite having received an induction dose followed by a maintenance dose of adalimumab.8 Patients classified as secondary nonresponders had previously benefited from adalimumab, but they subsequently show signs of disease recurrence during maintenance therapy.9 Response in these patients may be recovered through increasing the dose or adjusting the dosing interval. There are no standard guidelines or validated clinical decision support tools to aid in the process of dose intensification in these patients. InsightRX (San Francisco, CA) has developed a clinical decision support tool that aims to provide predictions for serum concentrations and dose intensification guides. This calculator combines patient-specific data, pharmacokinetics (PK) models, and Bayesian forecasting to determine an optimal dosing regimen for each patient. The InsightRX calculator was recently included in a study by Kantasiripitak et al10 that evaluated multiple model-informed precision dosing software. The calculator performed well in the 8 key factors assessed. Our aim was to determine if 2 novel adalimumab PK models implemented in this software can accurately predict postinduction serum adalimumab concentrations, using real-world patient data. In addition, we seek to determine the rate of dose escalations during the first year of therapy.
Materials and Methods
A retrospective chart review of pediatric patients with IBD treated with adalimumab was conducted from January 1, 2010, to August 11, 2020. All patients were followed up by the Division of Pediatric Gastroenterology, Hepatology, and Nutrition at University Hospitals Rainbow Babies and Children’s Hospital, Cleveland, Ohio. A preexisting, local gastroenterology database, the electronic health record, and Theradoc (Charlotte, NC) were used to search for patients meeting the following inclusion criteria: ≤18 years of age at the time of diagnosis of IBD, treated with adalimumab for at least 1 year, and had a postinduction drug trough concentration drawn. Postinduction serum adalimumab concentrations were considered if the trough concentration was drawn between doses 4 and 6 following the induction dose. Because adalimumab doses were administered at home, serum trough concentrations were scheduled to be drawn prior to the administration of the following dose between doses 4 and 6. Patients were excluded if there were no drug trough concentrations drawn during the first year of adalimumab therapy, postinduction concentrations were unmeasurable, or if the calculator could not determine a prediction. Postinduction drug concentrations and antibody concentrations were extracted from the local electronic health record system. Additional patient data were collected to include a baseline for C-reactive protein (CRP), albumin, and hemoglobin, as well as postinduction concentrations of each.
Demographic data collected included the patient’s age, weight, sex, diagnosis date, disease duration, and disease type. Data of dose change, time from induction, and clinical adjustment were gathered to determine the rate of dose adjustments seen by our clinicians. Dose adjustments were performed at the discretion of the provider, based on active symptoms, weight adjustments, or low serum adalimumab concentrations. If a patient underwent a dose adjustment, the most recent antidrug antibody concentration and CRP, albumin, and hemoglobin levels were collected.
All serum concentration testing was performed by using size exclusion chromatography based on mobility shift assay on high-performance liquid chromatography performed as a send-out test to Prometheus Biosciences (San Diego, CA).11 This drug-tolerant assay allows for detection of antidrug antibodies even in the presence of active drug concentrations. The test is able to detect adalimumab concentrations ranging from 0.018 to 50 mg/L and antibodies to adalimumab from 0.063 to 25 mcg/mL.
The Ternant model was described in a study by Ternant et al.12 The model was developed following an analysis of 65 adult patients with IBD treated with subcutaneous adalimumab. Patients were induced with 160/80 mg at weeks 0/2 or 80/40 mg and maintained on 40 mg every 2 weeks. Adalimumab concentrations were measured with enzyme-linked immunosorbent assay. The Ternant model retrospectively assessed these trough concentrations to develop a population PK model. Using a 1-compartment model with first-order absorption and elimination rates, the following parameters were estimated: volume of distribution of 13.5 L, clearance of 0.42 L/day, and a first-order absorption rate constant of 0.15 day−1. Drug clearance was calculated to be 5.5 times higher in the presence of antidrug antibodies. Finally, the elimination half-life without antidrug antibodies was 22 days, and 4.1 days in the presence of antidrug antibodies.
The de Klaver model was developed by using 5 different population PK model parameters. Of these 5 models, 2 were PK models based on patients with a diagnosis of CD, 2 were PK models for plaque psoriasis, and 1 was a model involving patients with rheumatoid arthritis. In 1 CD population PK model, patients’ ages ranged from 6 to 17 years, and in the 4 other PK models, patients were >17 years of age. The authors took these 5 population PK models and tested each with 96 adult patients with CD to determine their accuracy with the existing patients’ serum adalimumab trough concentrations.13 Patients with CD were given 80 mg at week 0, 40 mg at week 2, and 40 mg every 2 weeks; or a fast-loading schedule with 160 mg at week 0, 80 mg at week 2, and 40 mg every 2 weeks. The same fast-loading schedule was used in patients with UC.14 Using these data, a 1-compartment model with first-order absorption and elimination rates was developed. The following parameters were estimated: clearance, 0.409 L/day; volume of distribution, 21.2 L; and first-order absorption rate constant, 0.2/day.
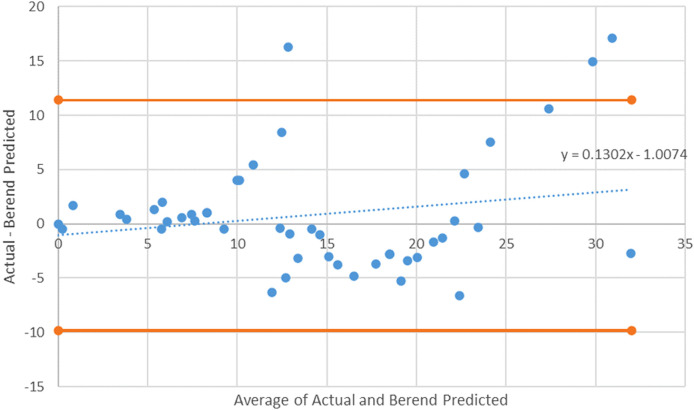
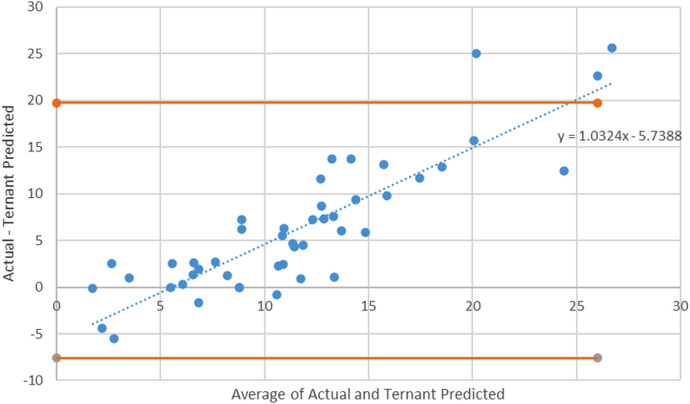
Data values from the actual and posteriori analysis of retrospective data were compared via Bland-Altman analysis. First, the mean difference between the 2 measurements was determined by subtracting the actual value from the predicted value, and a 1-sample t test for mean equivalence to 0 was performed. This allowed for an assessment of systematic bias in the predicted value from the gold standard (actual value). A scatterplot graph of the difference in the measurements plotted against the average difference provided a visual check to determine potential for bias associated with smaller or larger values. A regression line was fitted to the points with 95% confidence error to determine if the slope of the line is 0. Additionally, the confidence region of the difference in values was determined and specific values where bias is possible were identified. This allowed for identification of specific bias associated with specific measurement values.
Results
A total of 85 patients were screened; however, 38 patients were excluded, leaving a total of 47 patients for evaluation. Most patients excluded (16) had been treated with adalimumab for less than a year. Ten patients were missing critical data. Two patients had postinduction concentrations >50 mcg/mL and therefore could not be evaluated, 3 patients were excluded because of PK calculator error, and 3 patients were older than 18 years at initiation. Four patients were excluded owing to other reasons.
Forty-one patients (87%) received a diagnosis of CD, and 30 (64%) were male. Only 5 patients included received a diagnosis of UC, and 1 patient had IBD-unclassified. On average, patients were 14 years of age, with a range from 8 to 18 years. A complete table of demographics is shown in Table 1. Most patients were induced with 160 mg of adalimumab and maintained on 40 mg every 2 weeks.
Table 1.
Population Baseline Characteristics
| Characteristic | Population (N = 47) |
|---|---|
| Male sex, n (%) | 30 (64) |
| Diagnosis, n (%) | |
| Crohn disease | 41 (87) |
| Ulcerative colitis | 5 (11) |
| Unclassified | 1 (2) |
| Age, mean ± SD, yr | 14 ± 2.6 |
| Weight, mean ± SD, kg | 50 ± 17 |
| Disease duration, mean ± SD, yr | 5.4 ± 2.5 |
| Induction dose, n (%) | |
| 160 mg | 34 (73) |
| 80 mg | 11 (23) |
| 40 mg | 2 (4) |
| Initial maintenance dosing, n (%) | |
| 40 mg every 2 wk | 38 (81) |
| 20 mg every 2 wk | 9 (19) |
| Hemoglobin, mean ± SD, g/dL | 12 ± 1.5 |
| C-reactive protein, mean ± SD, mg/dL | 1.7 ± 2.8 |
| Albumin, mean ± SD, g/dL | 3.8 ± 0.63 |
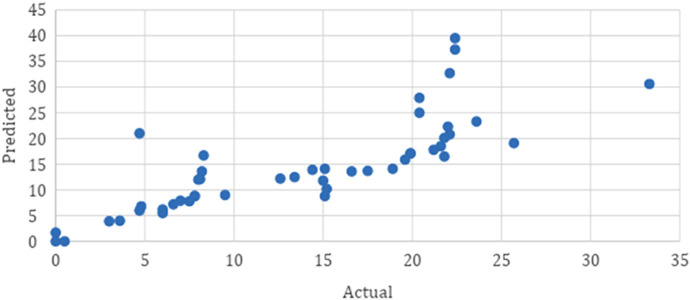
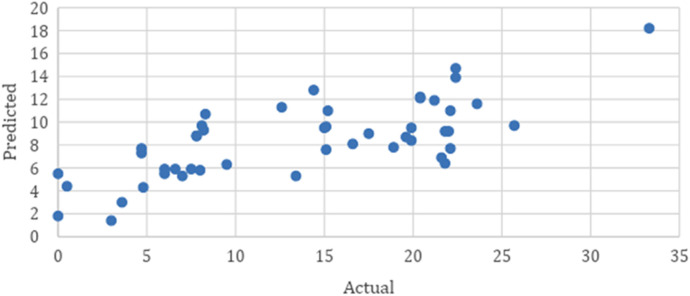
The average postinduction serum adalimumab concentration for our population was 14.6 mg/L. As seen in Table 2, when compared to the average postinduction serum adalimumab concentration predicted by the de Klaver model of 13.7 mcg/mL, the predicted average postinduction serum concentration from the Ternant method was 8.4 mg/L. The de Klaver method Bland-Altman plot had a nonsignificant slope (p = 0.188), whereas the Ternant method’s Bland-Altman plot showed a significant slope and constant, as seen in Figures 1 and 3. When analyzing the de Klaver scatterplot compared with the Ternant model, it shows a stronger positive relationship between actual and predicted serum trough concentrations, as seen in Figures 2 and 4, respectively. A box plot was created to visually inspect the variation between the predictions of the 2 methods, as seen in Figure 5. Figure 3 shows a larger range with the Ternant method than with the de Klaver method.
Table 2.
Postinduction Drug Concentration Comparison
| Parameter | Mean ± SD (range) | p value |
|---|---|---|
| Actual drug concentration | 14.6 ± 9.04 (0–39.5) | |
| Predicted de Klaver method | 13.7 ± 8.03 (0–33.3) | |
| Actual de Klaver method | 0.8 ± 5.40 | 0.294 |
| Predicted Ternant method | 8.4 ± 3.31 (1.2–18.2) | |
| Actual Ternant method | 6.1 ± 6.94 | <0.001 |
Figure 1.
A de Klaver method Bland-Altman plot with 95% CI. The slope for the de Klaver model is nonsignificant (p = 0.188), indicating no proportional bias.
Figure 3.
Ternant method Bland-Altman plot with 95% CI limits. The Bland-Altman plot for the Ternant method shows a slope and constant that are significant (p < 0.001), suggesting that the Ternant method has the potential to show an initial overprediction at lower values and an underprediction at larger values.
Figure 2.
A de Klaver scatterplot of actual versus predicted concentration. The de Klaver scatterplot demonstrates a strong positive relation between actual serum trough concentrations and the predicted serum trough concentrations.
Figure 4.
Ternant scatterplot of actual versus predicted concentration. The Ternant method scatterplot shows a weak positive relationship between the actual serum trough concentrations compared with predicted serum trough concentrations.
Figure 5.
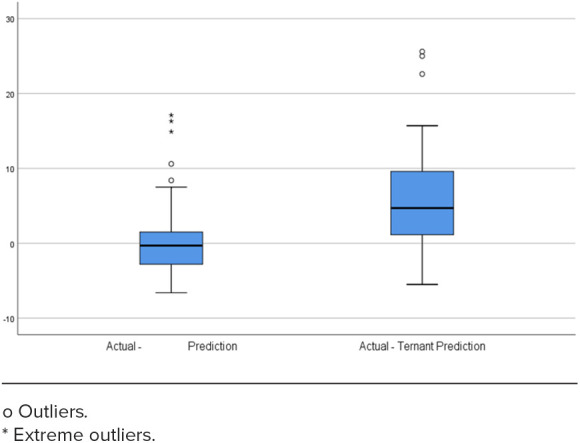
Box plots comparing the distribution of the de Klaver and Ternant predictions. After plotting the difference between actual and predicted serum trough concentrations, the 2 methods were compared to determine the degree of variability in their predictions. The Ternant method demonstrated a larger distribution than the De Klaver—Berend method, showing greater variability in the difference between actual and predicted serum trough concentrations.
For our secondary outcomes, we recorded 23 dose adjustments during the course of therapy, as seen in Table 3. Although there is no standard for approaching dose adjustments of adalimumab, the decision to either increase dose or increase the dosing interval was made at the discretion of the treating pediatric gastroenterologist. Of those 23 patients, 9 required a dose adjustment within the first year of therapy. Most adjustments (15 patients) involved an interval increase; 7 patients received a larger dose, 5 patients had antidrug antibodies, and 1 patient was reinduced after an undetectable postinduction serum adalimumab concentration. Among the patients who required a dose adjustment, 14 had a low concentration, 4 had active symptoms despite a therapeutic serum adalimumab concentration, 3 had an endoscopy suggesting active disease, and 3 were adjusted for weight.
Table 3.
Dose Adjustment Analysis
| Population (N = 47) | |
|---|---|
| Dose adjustment required, n (%) | 23 (49) |
| Average time to dose adjustment, mo | 18.4 |
| Dose adjusted in first year of therapy, n (%) | 9 (39) |
| Adjustment performed, n (%) | |
| Dose | 7 (30) |
| Interval | 15 (65) |
| Reinduced | 1 (5) |
Finally, an analysis was conducted of the recommendations recorded from the InsightRX software to determine if both models would adjust in a similar manner. The resultant κ was 0.437 with an SE of 0.096, representing a low match rate, as seen in Table 4. Covariates of the individual models are listed in the Supplemental Table.
Table 4.
Outcome Summary
| Variable or Statistic | Study Cohort (N = 47) |
|---|---|
| Dosage change, n (%) | |
| No | 24 (51.1) |
| Yes | 23 (48.9) |
| Reason, n (%) | |
| Low level | 14 (60.9) |
| Active symptoms | 4 (17.4) |
| Endoscopy suggestion | 3 (13.0) |
| Weight | 3 (13.0) |
| κ agreement—Berend and Ternant method recommendations | |
| κ (SE) | 0.437 (0.096) |
Discussion
This external validation study is the first known one to date that examines the agreement of PK models with real-world postinduction serum adalimumab concentrations in pediatric patients with IBD. Analysis of the 2 methods included in the InsightRX calculator suggests that the de Klaver method more accurately predicts postinduction serum adalimumab concentrations in pediatric patients with IBD. The Ternant method has the potential to overpredict smaller values and underpredict larger values. Additionally, a κ statistic was calculated to determine the variability between the recommendations of the 2 PK models. A κ of 0 shows no level of agreement, whereas a κ of 0.9 or above shows an almost perfect level of agreement.15 A κ of 0.437 demonstrates that the 2 methods have a weak level of agreement and give different recommendations. In addition, we found that up to 50% of patients required a dosing adjustment during therapy with adalimumab.
Dosing calculators have been used to aid in dosing of infliximab in IBD. A prospective observational cohort study was completed in pediatric and young adult patients following the creation of a mobile infliximab dosing calculator. The global adaptation of the calculator was deemed to be feasible and effective. A total of 81% of patients included in the cohort reached therapeutic trough concentrations during the study period, 12% higher than before the calculator implementation.16 Although the calculator recommended a dose escalation for 13% of the infusion events, the treating physician could still decline the recommendation. Loss of response following the implementation of the calculator was observed only for 1 patient. The calculator was developed to target patients with underlying PK and disease characteristics that could lead to suboptimal concentrations. To date, only the InsightRX adalimumab calculator has been evaluated for precision dosing,12 emphasizing the need for continual improvements to target these patients. Furthermore, despite increasing literature suggesting a need for dose escalation, many insurance companies will only allow the dispensing of two 40-mg injections every 28 days or 40 mg every other week.17,18 In CLASSIC II, 30% of patients required a dose escalation to 40 mg every week.17 Local experience has also shown difficulty getting insurances to approve weekly adalimumab dosing, causing a delay in therapy. Such delays can lead to further progression of IBD, development of complications, and patient suffering. Providing patient-specific PK data with optimal dosing regimens could potentially decrease these delays in therapy.
A recent study by Papamichael et al20 showed an independent association between proactive adalimumab TDM and lower rates of treatment failure with standard of care. Similarly, a randomized controlled trial involving pediatric patients with CD, ages 6 to 18 years, was conducted to determine if proactive TDM was associated with higher rates of corticosteroid-free clinical remission. Patients with low serum adalimumab trough concentrations (defined as <5 mg/L) underwent a dose or interval adjustment. Patients in the reactive monitoring group had a serum concentration drawn after loss of response. The study discovered that more patients in the proactive monitoring group had corticosteroid-free clinical remission than those in the reactive monitoring group.21 Through proactive TDM in our study, we identified 23 patients (49%) who required dose adjustments. Nine patients (19%) required dose adjustments during the first year. These rates are similar to those published in a systematic review describing the loss of response and need for adalimumab dose intensification in CD.21 On average, 18.2% of primary responders have a loss of response, with an annual risk of 20.3% per patient year. Loss of response to anti-TNF agents has been reported, up to 50%.22–24
The strengths of this study include the exclusively pediatric nature of our data, as well as the use of a drug-tolerant assay, which determines both the trough serum adalimumab concentrations and the presence or absence of antidrug antibodies. Our study was not without limitations. Despite collecting information on antidrug antibodies, we were not able to incorporate these into our PK calculations. The retrospective nature of the study has the potential for selection bias and was performed at a single pediatric center with a limited number of patients. Additionally, the PK models included in the InsightRX calculator were not designed for pediatric patients; specifically, the Ternant model was based on patients ages 17 to 61 years, and because our population consisted primarily of patients in a pediatric age group, body weight may not have been accurately accounted for with PK estimates of clearance and volume.
Time-varying patient biomarkers, such as albumin and CRP levels, were not included in the PK models. These markers are used in clinical practice in addition to the adalimumab concentrations to determine disease control, as seen in a study by Sandborn et al.22 In this study, there was a correlation between higher CRP and lower albumin levels with increased adalimumab clearance. Documentation of the first induction dose was found in the patient charts, but subsequent doses were given at home. This led to estimation of dosing intervals, based on the prescription details. Although the Bland-Altman analysis was able to show which method produced values closer to the average drug concentration of the population, it does not tell the clinician whether or not the differences are clinically acceptable. A cutoff value was not determined prior to data analysis to evaluate these concentrations clinically.
In conclusion, our study provides the first information on the use of an adalimumab calculator to provide patient-specific, optimized dosing in a pediatric population with IBD. The de Klaver model was able to retrospectively predict postinduction serum adalimumab concentrations with less bias than the Ternant model and may aid clinicians in predicting patient concentrations. Further investigations should be performed to determine if the dose optimization provided by the calculator led to clinically meaningful end points, such as clinical and endoscopic remission. Consideration should be given to the development of further guides based on adalimumab PK data.
Supplementary Material
ABBREVIATIONS
- CD
Crohn disease;
- CRP
C-reactive protein;
- IBD
inflammatory bowel disease;
- PK
pharmacokinetics;
- TDM
therapeutic drug monitoring;
- TNF-α
tumor necrosis factor α;
- UC
ulcerative colitis
Footnotes
Disclosures. The authors declare no conflicts or financial interest in any product or service mentioned in the manuscript, including grants, equipment, medications, employment, gifts, and honoraria. The authors had full access to all the data in the study and take responsibility for the integrity of the data and the accuracy of the data analysis.
Ethical Approval and Informed Consent. This study was approved by the University Hospitals Rainbow Babies and Children’s Hospital Institutional Review Board (STUDY20200997). However, because of the retrospective nature of the study, informed consent was not required.
Supplemental Material. DOI: 10.5863/1551-6776-28.7.603.S1
References
- 1.de Bie CI, Escher JC, de Ridder L. Antitumor necrosis factor treatment for pediatric inflammatory bowel disease. Inflamm Bowel Dis . 2012;18(5):985–1002. doi: 10.1002/ibd.21871. [DOI] [PubMed] [Google Scholar]
- 2.Deora V, Kozak J, El-Kalla M et al. Therapeutic drug monitoring was helpful in guiding the decision-making process for children receiving infliximab for inflammatory bowel disease. Acta Paediatr . 2017;106(11):1863–1867. doi: 10.1111/apa.14008. [DOI] [PubMed] [Google Scholar]
- 3.Roblin X, Marotte H, Rinaudo M et al. Association between pharmacokinetics of adalimumab and mucosal healing in patients with inflammatory bowel diseases. Clin Gastroenterol Hepatol . 2014;12(1):80–84.e2. doi: 10.1016/j.cgh.2013.07.010. [DOI] [PubMed] [Google Scholar]
- 4.Lehtomäki J, Nikkonen A, Merras-Salmio L et al. Therapy outcome related to adalimumab trough levels in pediatric patients with inflammatory bowel disease. Scand J Gastroenterol . 2021;57(1):31–36. doi: 10.1080/00365521.2021.1977843. [DOI] [PubMed] [Google Scholar]
- 5.Papamichael K, Cheifetz AS, Melmed GY et al. Appropriate therapeutic drug monitoring of biologic agents for patients with inflammatory bowel diseases. Clin Gastroenterol Hepatol . 2019;17:1655–1668. doi: 10.1016/j.cgh.2019.03.037. [DOI] [PMC free article] [PubMed] [Google Scholar]
- 6.Ungar B, Engel T, Yablecovitch D et al. Prospective observational evaluation of time-dependency of adalimumab immunogenicity and drug concentrations: the POETIC Study. Am J Gastroenterol . 2018;113:890–898. doi: 10.1038/s41395-018-0073-0. [DOI] [PubMed] [Google Scholar]
- 7.Fine S, Papamichael K, Cheifetz AS. Etiology and management of lack or loss of response at anti-tumor necrosis factor therapy in patients with inflammatory bowel disease. Gastroenterol Hepatol (N Y) . 2019;15(12):656–665. [PMC free article] [PubMed] [Google Scholar]
- 8.Singh S, George J, Boland BS et al. Primary non-response to tumor necrosis factor antagonists is associated with inferior response to second-line biologics in patients with inflammatory bowel diseases: a systematic review and meta-analysis. J Crohns Colitis . 2018;12(6):635–643. doi: 10.1093/ecco-jcc/jjy004. [DOI] [PMC free article] [PubMed] [Google Scholar]
- 9.KH de Boer N, Lowenberg M, Hoentjen F. Management of Crohn’s disease in poor responders to adalimumab. Clin Exp Gastroenterol . 2014;7:83–92. doi: 10.2147/CEG.S47627. [DOI] [PMC free article] [PubMed] [Google Scholar]
- 10.Kantasiripitak W, Daele RV, Gijsen M et al. Software tools for model-informed precision dosing: how well do they satisfy the needs? Front Pharmacol . 2020;11:620. doi: 10.3389/fphar.2020.00620. [DOI] [PMC free article] [PubMed] [Google Scholar]
- 11.Wang SL, Hauenstein S, Ohrmund L et al. Monitoring of adalimumab and antibodies-to-adalimumab levels in patient serum by the homogeneous mobility shift assay. J Pharm Biomed Anal . 2013;78–79:39–44. doi: 10.1016/j.jpba.2013.01.031. [DOI] [PubMed] [Google Scholar]
- 12.Ternant D, Karmiris K, Vermeire S et al. Pharmacokinetics of adalimumab in Crohn’s disease. Eur J Clin Pharmacol . 2015;71(9):1155–1157. doi: 10.1007/s00228-015-1892-1. [DOI] [PubMed] [Google Scholar]
- 13.de Klaver PAG, Keizer RJ, ter Heine R et al. Early at-home measurement of adalimumab concentrations to guide anti-tnf precision dosing: a pilot study. Eur J Drug Metab Pharmacokinet . 2023;48:377–385. doi: 10.1007/s13318-023-00835-7. [DOI] [PubMed] [Google Scholar]
- 14.Rutgeerts P, Sandborn WJ, Feagan BG et al. Infliximab for induction and maintenance therapy for ulcerative colitis. N Engl J Med . 2005;353(23):2462–2476. doi: 10.1056/NEJMoa050516. [DOI] [PubMed] [Google Scholar]
- 15.McHugh ML. Interrater reliability: the kappa statistic. Biochem Med (Zagreb) . 2012;22(3):276–282. [PMC free article] [PubMed] [Google Scholar]
- 16.Piester T, Frymoyer A, Christofferson M et al. A mobile infliximab dosing calculator for therapy optimization in inflammatory bowel disease. Inflamm Bowel Dis . 20124(2):227–234. doi: 10.1093/ibd/izx037. [DOI] [PMC free article] [PubMed] [Google Scholar]
- 17.BlueCross BlueShield of North Carolina. Adalimumab utilization criteria. Accessed April 12, 2020. https://www.bluecrossnc.com/content/dam/bcbsnc/pdf/providers/formulary/commercial/mednec_criteria.pdf.
- 18.Cigna. Cigna national formulary coverage policy: DQM per days—Humira. Accessed April 12, 2020. https://static.cigna.com/assets/chcp/pdf/coveragePolicies/cnf/cnf_166_coveragepositioncriteria_adalimumab_products_dqm_per_days.pdf.
- 19.Sandborn WJ, Hanauer SB, Rutgeerts P et al. Adalimumab for maintenance treatment of Crohn’s disease: results of the CLASSIC II trial. Gut . 2007;56(9):1232–1239. doi: 10.1136/gut.2006.106781. [DOI] [PMC free article] [PubMed] [Google Scholar]
- 20.Papamichael K, Juncadella A, Wong D et al. Proactive therapeutic drug monitoring of adalimumab is associated with better long-term outcomes compared with standard of care in patients with inflammatory bowel disease. J Crohns Colitis . 2019;13(8):976–981. doi: 10.1093/ecco-jcc/jjz018. [DOI] [PMC free article] [PubMed] [Google Scholar]
- 21.Assa A, Matar M, Turner D et al. Proactive monitoring of adalimumab trough concentration associated with increased clinical remission in children compared with reactive monitoring. Gastroenterology . 2019;157(4):985–996.e2. doi: 10.1053/j.gastro.2019.06.003. [DOI] [PubMed] [Google Scholar]
- 22.Billioud V, Sandborn WJ, Peyrin-Biroulet L. Loss of response and need for adalimumab dose intensification in Crohn’s disease: a systematic review. Am J Gastroenterol . 2011;106(4):674–684. doi: 10.1038/ajg.2011.60. [DOI] [PubMed] [Google Scholar]
- 23.Sandborn WJ, van Assche G, ReinischW et al. Adalimumab induces and maintains clinical remission in patients with moderate-to-severe ulcerative colitis. Gastroenterology . 2012;142(2):257–265. doi: 10.1053/j.gastro.2011.10.032. [DOI] [PubMed] [Google Scholar]
- 24.Reinisch W, Sandborn WJ, Panaccione R et al. 52-Week efficacy of adalimumab in patients with moderately to severely active ulcerative colitis who failed corticosteroids and/or immunosuppressants. Inflamm Bowel Dis . 2013;8:1700–1709. doi: 10.1097/MIB.0b013e318281f2b7. [DOI] [PubMed] [Google Scholar]
Associated Data
This section collects any data citations, data availability statements, or supplementary materials included in this article.


