

Abstract
Lead (Pb2+) is an important developmental toxicant. The mitochondrial calcium uniporter (MCU) imports calcium ions using the mitochondrial membrane potential (MMP), and also appears to mediate the influx of Pb2+ into the mitochondria. Since our environment contains mixtures of toxic agents, it is important to consider multi-chemical exposures. To begin to develop generalizable, predictive models of interactive toxicity, we developed mechanism-based hypotheses about interactive effects of Pb2+ with other chemicals. To test these hypotheses, we exposed HepG2 cells (human liver) to Pb2+ alone and in mixtures with other mitochondria-damaging chemicals: carbonyl cyanide-p-trifluoromethoxyphenylhydrazone (FCCP), a mitochondrial uncoupler that reduces MMP, and Ruthenium Red (RuRed), a dye that inhibits the MCU. After 24 hours, Pb2+ alone, the mixture of Pb2+ and RuRed, and the mixture of Pb2+ and FCCP caused no decrease in cell viability. However, the combination of all three exposures led to a significant decrease in cell viability at higher Pb2+ concentrations. After 48 hours, the co-exposure to elevated Pb2+ concentrations and FCCP caused a significant decrease in cell viability, and the mixture of all three showed a clear dose-response curve with significant decreases in cell viability across a range of Pb2+ concentrations. We performed ICP-MS on isolated mitochondrial and cytosolic fractions and found no differences in Pb2+ uptake across exposure groups, ruling out altered cellular uptake as the mechanism for interactive toxicity. We assessed MMP following exposure and observed a decrease in membrane potential that corresponds to loss of cell viability but is likely not sufficient to be the causative mechanistic driver of cell death. This research provides a mechanistically-based framework for understanding Pb2+ toxicity in mixtures with mitochondrial toxicants.
Introduction:
Heavy metals are ubiquitous in our environment due to both natural sources and anthropogenic actions. Historically, significant sources of Pb2+ exposure have been Pb2+-based paints and the addition of Pb2+ to gasoline 1, 2. While the use of Pb2+ for these purposes is now banned, some Pb2+ derived from gasoline remains in the soil and contributes to exposure along with Pb2+ contaminated paint in older homes 2, 3. Additional sources of exposure come from drinking water impacted by legacy water distribution systems, produce grown in Pb2+-contaminated soil, some traditional medications, and occupational exposures associated with a variety of industrial processes 4, 5. Within the population, exposure to Pb2+ occurs disproportionately, with some demographic groups exposed to Pb2+ more than others. Studies have shown differential exposure across racial and ethnic groups, with Black children in the US being more likely to have elevated blood lead levels (BLL) 6. It is important to note that public health officials have determined that no safe level of Pb2+ exposure can be established for children 7.
At low levels of exposure, Pb2+ toxicity predominantly impacts the nervous system. Pb2+ can inhibit the absorption of dopamine 8, a crucial neurotransmitter. Children are especially vulnerable to the harmful effects of Pb2+ as they are more likely to be directly in contact with sources of Pb2+, for example, by ingesting paint chips, and because their nervous systems are still developing. Developing brains are more susceptible to Pb2+ health effects and there is an inverse relationship between IQ levels, attentiveness, and BLL 8. Occupational exposures to Pb2+ have also been correlated with changes in the peripheral nervous system as well as the circulatory and excretory systems 9, 10.
Mitochondria are complex organelles that play a large role in cellular energy production and metabolism. Beyond energy production, mitochondria are crucial to maintaining cellular health due to their diverse roles in signaling pathways that directly regulate ion homeostasis, immune responses, apoptosis, and many other processes 11. Perturbations to mitochondrial health and homeostasis are associated with a variety of diseases such as diabetes, Parkinson’s disease, Alzheimer’s Disease, and many more. Mitochondrial health throughout development is also crucial to proper neurodevelopment. Many environmental chemicals cause mitochondrial dysfunction through a variety of mechanisms 12, 13. Although not all of the targets of Pb2+ are mitochondrial, many are, such that mitochondria are of particular interest to understanding Pb2+ toxicity. For example, Pb2+ disrupts heme synthesis, which occurs in mitochondria, and Pb2+ has been shown to inhibit the activity of complex III in the electron transport chain and decrease ATP production 14.
Pb2+ is able to enter the cell through calcium mimicry 15-17. Pb2+ can replace calcium in processes that require calcium itself, including for example calcium uptake into mitochondria, binding to intestinal calcium-binding protein, and Ca-ATPase activity in human red blood cells 18. In many of these instances, Pb2+ exhibits a higher affinity of binding than Ca2+ ions to ligand receptor sites, resulting in a disruption of calcium homeostasis and ultimately toxic effects on bone density 18, the nervous system, and the endocrine system 19. Given the known mechanistic drivers of Pb2+ toxicity such as disruptions in calcium homeostasis and mitochondrial mechanisms such as the inhibition of electron transport chain complexes, we are able to employ hypothesis-based mixture testing to advance predictive toxicology. Specifically, we can use additional environmental compounds that disrupt mitochondrial function and calcium homeostasis to look for interactions with Pb2+ toxicity.
The mitochondrial calcium uniporter (MCU) is a major pathway for calcium’s uptake into the mitochondria 20, and it has previously been shown that the MCU is an entry point for Pb2+ into the mitochondria as well 15, 21. The MCU imports calcium using the mitochondrial membrane potential (MMP) 22. Ruthenium Red (RuRed, chemical structure shown in Figure S1A) is a well-studied inhibitor of the MCU that decreases calcium uptake 23 by binding to the uniporter and preventing the opening of the channel for calcium to flow into the mitochondria. We are exposed to other chemical inhibitors of the MCU in the environment, including some inorganic salts and antibiotics such as doxycycline 24. RuRed can be used as a mechanistic tool to determine sites of the entry of Pb2+ into the mitochondria 21, but also as a representative compound of other environmental chemicals that might have similar interactions with Pb2+. Carbonyl cyanide-p-trifluoromethoxyphenylhydrazone (FCCP, chemical structure shown in Figure S1B), a mitochondrial uncoupler, decreases the proton motive force (assessed as MMP) by shuttling the flow of protons back from the intermembrane space to the mitochondrial matrix 25. This proton motive force, created by the electron transport chain, is used for mitochondrial uptake of many compounds, including calcium 23. Mitochondrial uncouplers are a prevalent class of mitochondrial toxicants; recently, a high-throughput screening identified 1,250 uncouplers of oxidative phosphorylation 26. Examples of mitochondrial uncouplers in our environment include CO-releasing molecules, such as synthetic polymers, sevoflurane, and free fatty acids 27. Both FCCP and RuRed have been shown to decrease calcium uptake into the mitochondria 23, and given that the entry of Pb2+ likely occurs through calcium channels 15, it is important to understand how exposure to uncouplers and MCU inhibitors might interact with Pb2+.
In this study, we sought to characterize the cytotoxicity of Pb2+ in the presence of the mitochondrial toxicants RuRed and FCCP. We utilized HepG2 cells, a human hepatoma cell line commonly used for screening compounds for mitochondrial toxicity 28, 29, to establish dose response curves assessing cell viability across a range of Pb2+ doses alone or in combination with FCCP and/or RuRed. Additionally, we analyzed Pb2+ content of cell components to determine if these exposures altered Pb2+ entry into the mitochondria, and assessed alterations in MMP following exposure. Our results demonstrate clearly increased cytotoxicity of Pb2+ associated with mixtures, further highlighting the importance of understanding how the toxicity of compounds may change based on their co-exposures. To provide adequate regulation of chemicals, we must also consider how they influence biologic systems when in mixtures, as we are never exposed to single chemicals on their own.
Methods:
Cell Culture
HepG2 cells were cultured in high-glucose DMEM (Invitrogen 11995-065) supplemented with 1 mM HEPES (Gibco 15630-080), 1mM sodium pyruvate (Gibco 11360-070), 10 % Fetal Bovine Serum (HyClone 30071.03), and 1% penicillin-streptomycin (Gibco 15140-122). Cells were maintained at 37°C in vented T75 flasks in a humidified incubator with 5% CO2. Cells were routinely tested for mycoplasma and STR profiled at the Duke Cell Culture Facility.
Determining FCCP-induced mitochondrial uncoupling
To determine the level of FCCP-induced uncoupling in HepG2 cells, a Seahorse XFe24 Extracellular Flux Analyzer was used. Briefly, 25,000 cells were plated on Seahorse XF24 V7 PS cell culture microplates and cultured overnight. Cells were washed by changing the medium with an unbuffered assay medium (pH 7.4) containing 1 mM pyruvate and 2 mM glutamine (Agilent Technologies), supplemented with 17 mM glucose. Cells were put in a 37°C incubator without CO2 for an hour. Basal oxygen consumption rate (OCR) was measured, followed by the injection of a DMSO control, 0.05, 0.1, 0.5, or 1 μM FCCP. An additional injection of Hoechst 33342 was used to stain nuclei. After the assay, a Keyence BZ-X710 fluorescent microscope was used to count the nuclei. Seahorse OCR data was normalized to the number of cells, determined by the nuclei count. Experiments were performed in technical triplicate and three biological replicates were completed, separated by passage number and date. To assess the length of time that mitochondria remain uncoupled in the presence of FCCP, a Seahorse XFe24 Extracellular Flux Analyzer was used as previously described. Basal OCR was determined followed by the injection of a DMSO control or 1 μM FCCP. Following the injection, OCR was monitored for 24 hours. Given that Seahorse instruments are not able to program a run for more than 12 hours, two 12-hour assays were performed back-to-back and the data from the two were combined. OCR data was normalized to cell count, as described previously.
Cell Viability
To assess cell viability, 10,000 HepG2 cells were plated in black clear-bottom 96-well plates and allowed to adhere overnight. Cells were then dosed with their appropriate treatment: DMSO control, aqueous Pb concentrations of 0.1, 2, 10, 25, and 50 μM alone or in combination with mixtures of 1 μM FCCP, 5 μM RuRed, and a Ca2+supplementation. Lead stock solutions were made from a trace-metal basis lead acetate salt (Millipore Sigma 316512). Aqueous lead species are referred to as Pb2+ throughout the text. The addition of a Ca2+supplementation was performed by supplementing cell culture media with calcium chloride (Sigma C7902) to reach a final concentration of 3.6 mM, twice as high as typical DMEM media 30. Experiments were performed in technical triplicate and three biological replicates were completed for all doses. The 24- and 48-hour dose responses were analyzed at their respective time points. Cell viability was assessed using the alamarBlue HS Cell Viability Reagent (Invitrogen) and a FLUOstar Optima microplate reader.
Analysis of Lead Uptake
To study the uptake of Pb2+ into the mitochondria and the alterations of Pb2+ uptake with additional exposures, inductively coupled plasma mass spectrometry (ICP-MS) was used to quantify Pb2+ content from isolated mitochondrial and cytosolic fractions. Samples were prepared by growing HepG2 cells in T75 flasks and exposing them to their appropriate treatment for 48 hours (i.e., at the highest 50 μM Pb2+ exposure dose described in the Cell Viability experiment). Cells were then trypsinized and harvested for mitochondrial isolation using the Mitochondrial Isolation Kit (Thermo Scientific 89874). Data were normalized for protein content determined by a Pierce BCA Protein Assay Kit (Thermo Scientific 23225). Mitochondrial and cytosolic isolation samples were processed by heated acid digestion with 0.1 mL of nitric acid (trace metal grade, Fisher Scientific) per 0.075 mL of sample. The mixture was heated on a hot block (Environmental Express) at 95°C for two hours and then diluted to 0.5 mL after cooling. Aliquots of the digestates were diluted with 2% nitric acid/0.5% hydrochloric acid (v/v) diluent and spiked with 45Sc and 209Bi internal standards prior to instrumental analysis. Pb, Mg, and Na analysis was performed in He collision gas mode and Ca analysis in H2 reaction gas mode by ICP-MS (Agilent 7900). The instrument calibration was performed with a multi-element standard (Spex Certiprep) and verified by a second source reference (CRM-TMDW-A, High Purity Standards). Trace metal grade acids and 18.2 MΩ water (Millipore MilliQ) were used to prepare reagents and dilutions.
Mitochondrial Membrane Potential
To assess MMP, 50,000 HepG2 cells were plated in black clear-bottom 96-well plates and allowed to adhere overnight. Cells were then dosed with their appropriate treatment: DMSO control, 0.1, 2, 10, 25, and 50 μM Pb2+ acetate (Sigma 316512) alone or in combination with mixtures of 1 μM FCCP, 5 μM RuRed, or both. Cells were exposed to their respective treatment for either 6 hours or 24 hours, then washed 3 times with phosphate buffered saline (PBS), and exposed to 100 nM tetramethylrhodamine, ethyl ester (TMRE) and 75 nM Mitotracker green in PBS for 30 minutes. Cells were then washed three times, covered with PBS, and imaged on a Keyence BZ-X710 fluorescence microscope at 545±25 nm excitation and 605±70 nm emission for TMRE staining and 470± 40 nm excitation and 525±50 nm for Mitotracker green staining.
Fluorescent images acquired in both green and red channels were analyzed with a custom-built MATLAB (version R2020b) script. A binary mask was generated from the green channel image by binarization using the adaptive threshold method, and smoothing of features using morphological operations (erosion, dilation, and deletion of background objects). Fluorescence intensity in the corresponding red channel image was determined by extracting intensity values with the ‘regionprops’ operation using the regions segmented in the green channel binary mask. Similarly, a background value was determined for the red channel image using the complement of the green channel binary mask. Mean intensity values were determined as the subtraction of the background value from the fluorescent intensity value of each image. Finally, these values were stored and printed in a MS Excel 2013 worksheet.
Statistical Analysis
All experiments were replicated at least three times. For Seahorse experiments, OCR was normalized to cell counts and results were calculated as a percent increase in OCR from the basal respiration rate. For the assessment of Pb2+ uptake, data was analyzed via one-way ANOVA with a Dunnett’s post-hoc test for multiple comparisons. For the assessment of dose-responses and mitochondrial membrane potential, data was analyzed via two-way ANOVA with a Dunnett’s post-hoc test for multiple comparisons. For all graphs, error bars represent the standard error of the mean (SEM). All statistical analysis was performed using GraphPad Prism.
Results & Discussion:
FCCP induces sustained mitochondrial uncoupling
Uncouplers depolarize mitochondria by facilitating the flow of protons across the inner mitochondrial membrane. In response, cells increase oxygen consumption by the electron transport chain in an effort to maintain the proton gradient. This can be directly measured by assessing oxygen consumption using a Seahorse XF analyzer. To determine optimal FCCP concentrations for mixture studies, we sought a concentration that caused a significant level of uncoupling but was non-cytotoxic to the cells. We observed increases in the oxygen consumption rate with concentrations of 0.5 and 1 μM FCCP (Figure S2A) 1 hour after exposure, and opted to use 1 μM FCCP exposures for our studies given the robust increase in oxygen consumption rate that was observed. To determine if FCCP causes sustained uncoupling upon exposure, we monitored the oxygen consumption rate of HepG2 cells following a 1 μM FCCP exposure for 24 hours. We found that oxygen consumption declined over the course of 24 hours in the instrument, likely because the Seahorse instrument is not equipped for the long-term culturing of mammalian cells, but that cells exposed to FCCP did exhibit sustained uncoupling, as evidenced by the increase in OCR compared to that of the control, for the duration of the experiment (Figure S2B).
Mixtures containing FCCP or RuRed and FCCP increase cytotoxicity of Pb2+
To determine the impact of Pb2+ alone, in mixture with FCCP, RuRed, or both, we performed a series of dose-response curves for 24- and 48-hour exposures. The concentration of RuRed used, 5 μM, was selected based on previous literature indicating that this dose was non-cytotoxic and inhibited the MCU 31. We first confirmed that FCCP alone and RuRed alone are non-cytotoxic compounds at these concentrations, as indicated by no decreases in cell viability at 24 or 48 hours (Figure 1A, 1B). When FCCP and RuRed were combined, we observed a 20% decrease in cell viability with the 24-hour exposure (p=0.0001, via one-way ANOVA), but not in the 48-hour exposure (Figure 1A, 1B). It is possible that the combined exposure to FCCP and RuRed caused an initial inhibition of cellular function, but that the cells were able to recover over time.
Figure 1.
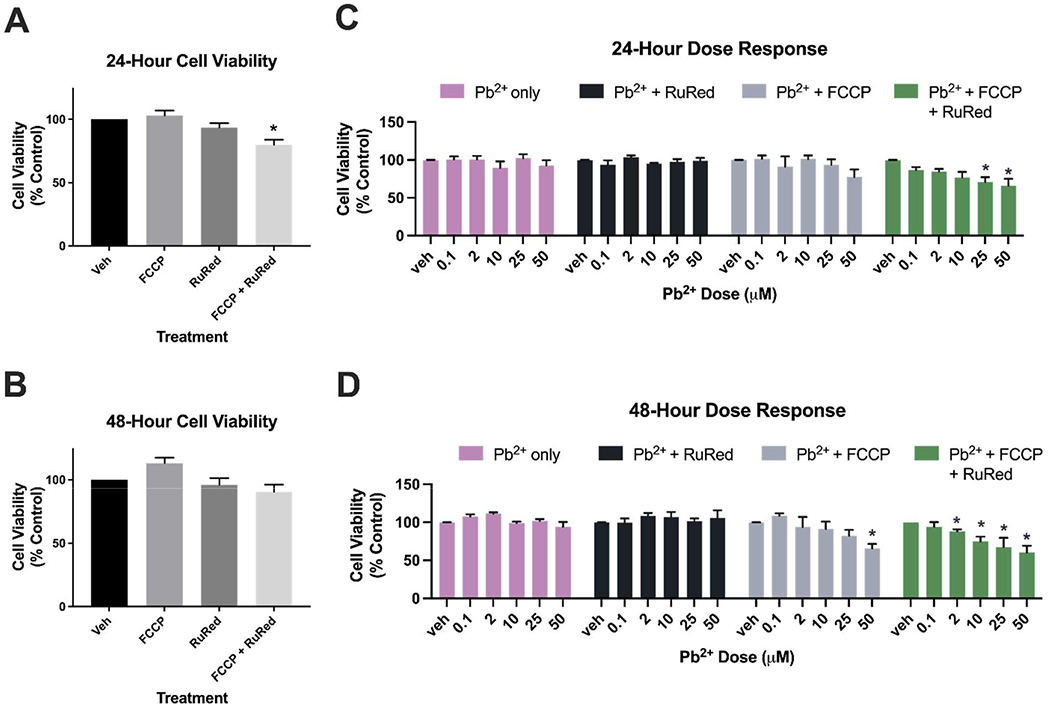
Cell viability following 24- and 48-hour exposures to Pb2+, FCCP, RuRed, and mixtures of the three. A) Assessment of chemicals alone following a 24-hour exposure to FCCP (1μM) and RuRed (5 μM) alone and in combination. Exposure to FCCP and RuRed in combination is associated with a decrease in cell viability (20%, p=0.001). B) Assessment of chemicals alone following a 48-hour exposure to FCCP (1μM) and RuRed (5 μM) alone and in combination. For panels A and B, data was analyzed via one-way ANOVA with a Dunnett’s post-hoc test for multiple comparisons of each group to the control (*: p<0.05). C) 24-hour dose response comparing cell viability to Pb2+ alone, Pb2+ and RuRed, Pb2+ and FCCP, Pb2+ and FCCP and RuRed. Exposure to a mixture of all chemicals results in a significant decrease in cell viability at multiple Pb2+ concentrations (25 μM: 30%, p=0.0067, 50 μM: 34%, p=0.0256). Data was analyzed via two-way ANOVA with a Dunnett’s post-hoc test for multiple comparisons of each group to the control. Pb2+ dose: p=0.003, Additional compound: p<0.0001, interaction: p=0.3513. (*: p<0.05) D) 48-hour dose response comparing cell viability to Pb2+ alone, Pb2+ and RuRed, Pb2+ and FCCP, Pb2+ and FCCP and RuRed. Exposure to 50 μM Pb2+ and FCCP resulted in a decrease in cell viability (35%, p=0.0111). Exposure to a mixture of all chemicals results in a significant decrease in cell viability at multiple Pb2+ concentrations (2 μM: 12%, p=0.0328, 10 μM: 25%, p=0.0234, 25 μM: 33%, p=0.0007, 50 μM: 40%, p=0.0008). Data was analyzed via two-way ANOVA with a Dunnett’s post-hoc test for multiple comparisons of each group to the control. Pb2+ dose: p<0.0001, Additional compound: p<0.0001, interaction: p=0.0082. (*: p<0.05). Fluorescence values recorded by the resazurin assay corresponding to the cell viability have been normalized to the control group and are presented as a percentage of the control on all graphs.
To determine if these co-exposures exacerbate the cytotoxicity of Pb2+, we then conducted Pb2+ dose responses assessing cell viability at 0 μM, 2 μM 10 μM 25 μM and 50 μM Pb2+ acetate concentrations either alone, in the presence of 5 μM RuRed, in the presence of 1 μM FCCP, or in the presence of both 5 μM RuRed and 1 μM FCCP. Following a 24-hour exposure to Pb2+ alone, none of these doses resulted in cytotoxicity (Figure 1C). In a 24-hour exposure to both Pb2+ and RuRed, we again observed no cytotoxicity (Figure 1C). The combination of Pb2+ and FCCP was also non-cytotoxic following 24 hours of exposure (Figure 1C). However, a mixture of FCCP, RuRed, and Pb2+ resulted in a dose-dependent decrease in cell viability after 24 hours, with significant loss of cell viability at 25 μM and 50 μM Pb2+ doses (Figure 1C, 30% p=0.0067 and 34% p=0.0256, respectively, via two-way ANOVA with Dunnett’s post-hoc correction for multiple comparisons).
Following a 48-hour exposure, we again observed no decrease in cell viability when cells were exposed to Pb2+ alone, or in combination with RuRed (Figure 1D). Interestingly, when cells were exposed to FCCP alongside Pb2+, we observed a decrease in cell viability at the highest Pb2+ dose, 50 μM (Figure 1D, 35% p=0.0111, via two-way ANOVA with Dunnett’s post-hoc correction for multiple comparisons). Exposure to a mixture of all chemicals resulted in a significant decrease in cell viability at multiple Pb2+ concentrations (Figure 1D, 2 μM: 12%, p=0.0328, 10 μM: 25%, p=0.0234, 25 μM: 33%, p=0.0007, 50 μM: 40%, p=0.0008, via two-way ANOVA with Dunnett’s post-hoc correction for multiple comparisons).
These data indicate that while FCCP and RuRed are not cytotoxic on their own at these concentrations, they can exacerbate the toxicity of Pb2+. This highlights the importance of assessing toxicity in the presence of co-exposures, as seemingly non-cytotoxic compounds may be cytotoxic in combination with other chemicals. While the added concentrations of Pb2+ selected for this study do not cause overt cell death on their own, they are associated with alterations in other markers of cellular health at these low levels 14, 32-34. It is crucial that we understand how co-exposures may exacerbate specific cellular mechanisms that may lead to the observed additive toxicity. An in-depth knowledge of the pathways that become disrupted in the context of specific chemical mixtures is essential to the field of predictive toxicology in mixture work. In this study, we selected two mitochondrial toxicants that represent two different mechanisms of mitochondrial dysfunction: an uncoupler and an MCU inhibitor. The selection of compounds with distinct mitochondrial mechanisms allows us to test how the alterations of mitochondrial function in varying ways can impact Pb2+ toxicity. Using compounds with known mechanisms of action may allow us to infer the potential interactions of Pb2+ with other chemicals that have similar mechanisms of action. The increasing recognition and discovery of mitochondrial toxicants in the environment, including the increasing discovery and ubiquity of mitochondrial uncouplers 26, supports the need to investigate how mitochondrial toxicants may interfere with seemingly well-understood legacy compounds, such as Pb2+.
FCCP and RuRed do not alter Pb2+ uptake into the mitochondria
Given that FCCP and RuRed have previously been shown to alter Ca2+ uptake into the mitochondria 23, we hypothesized that the exacerbated toxicity was due to differential uptake of Pb2+ into the mitochondria, as Pb2+ has been shown to enter the mitochondria through the same uniporter as Ca2+ 21. To assess mitochondrial Pb2+ uptake, we exposed cells to their corresponding treatment for 48 hours, then performed a mitochondrial and cytosolic isolation and determined the Pb2+ concentrations in each fraction using ICP-MS. Pb2+ was below the limit of detection for all control samples, and elevated in treatments exposed to Pb2+, in both the mitochondrial and cytosolic fractions (Figure 2), as expected. The concentration of Pb2+ did not vary significantly among treatments of 50 μM Pb2+ alone, 50 μM Pb2+ and FCCP, 50 μM Pb2+ and RuRed, and a mixture of all three chemicals in either the cytosolic or the mitochondrial fractions (Figure 2A, 2B). Additionally, we observed no differences in cytosolic Ca2+ levels across treatment groups, as well as no difference in cytosolic or mitochondrial levels of sodium and magnesium (Figure S3). This indicates that over the course of a 48-hour exposure, these treatments are not drastically altering the transport of analytes in and out of the mitochondria, despite their known influences on ion transport in short-term experiments. We were unable to directly measure mitochondrial Ca2+ levels in these samples, as the Ca2+ levels in the mitochondrial fractions were below the limit of detection. Since there were no significant differences in Pb2+ uptake, the differential toxicity observed is likely not driven by differences in cellular Pb2+ uptake. Other potential drivers of the observed increased cytotoxicity include alterations to membrane potential dynamics, differences in mitochondrial Ca2+ uptake, disruption in Ca2+ homeostasis, or alterations in bioenergetics, including oxygen consumption and ATP synthesis.
Figure 2.

Mitochondrial and cytosolic Pb2+ uptake. A) Mitochondrial Pb2+ concentrations across treatment groups determined by ICP-MS. Values are represented as ng Pb2+ per μg of protein, as determined by a BCA assay. Data was analyzed via one-way ANOVA. B) Cytosolic Pb2+ concentrations across treatment groups determined by ICP-MS. Values are represented as ng Pb2+ per μg of protein, as determined by a BCA assay. Data was analyzed via one-way ANOVA.
While the cytotoxicity and uptake experiments involved dosing with Pb2+-acetate stock solutions, the Pb2+ ions were most likely bound to proteins in the exposure medium, such as albumin from the fetal bovine serum (FBS). Prior research has shown that the amount of FBS will control free Zn2+ ion concentrations, resulting in altered bioaccessibility and cytotoxicity 35. In our experiments, the FBS content in the media (10%) was constant. Thus, we interpret the observed internalization of Pb2+ to represent metal-ligand competition between matrix proteins and membrane transporter for Pb2+ ion uptake. Furthermore, the results suggest that the addition of FCCP and RuRed did not alter the bioaccessibility of Pb2+ and Ca2+ in the cell media, because internalized levels of Pb2+ and other metals were similar for exposure mixtures (Figures 2 and S3).
Previous reports have shown RuRed to inhibit entry of Pb2+ into the mitochondria; however, these experiments were done with shorter exposure times 21. It is possible that upon binding to the MCU, RuRed initially inhibits Pb2+ from entering, but over the course of a 48-hour exposure, the RuRed comes on and off of the MCU, still allowing for the passage of Pb2+ into the mitochondria. However, additional studies are needed to better understand the binding of RuRed to the MCU to confirm this. Additionally, it is possible that upon inhibition of the MCU, another channel or transporter also allows the influx of Pb2+ into the mitochondria 36-38. Interestingly, previous reports suggested that Pb2+ may accumulate in the mitochondria 14, 39, making this organelle particularly vulnerable to Pb2+ exposures. However, we observed similar levels of Pb2+ in the mitochondria and the cytosol. Additional work should be done to investigate the subcellular localization of Pb2+.
Calcium supplementation provides mild to no rescue of mixture cytotoxicity
While FCCP and RuRed did not disrupt Pb2+ entry into the mitochondria in our experiments, but are expected to disrupt calcium influx into the mitochondria 23, it is possible that the observed mixture cytotoxicity was a result of disruption to mitochondrial calcium homeostasis. We attempted to test this directly, but unfortunately our results were inconclusive, because our samples contained Ca2+ levels that were below the limit of detection in mitochondria. However, if exposure to Pb2+ were limiting Ca2+ uptake into mitochondria and thus reducing cell viability, supplementing the media used to maintain the cells with additional Ca2+ could potentially rescue this loss in cell viability. To address this question, we replicated our dose-response curves that indicated enhanced toxicity now with the addition of a Ca2+ supplementation, in which the levels of Ca2+ present in the media were doubled.
Previously we observed a greater than additive effect between 50 μM Pb2+ and FCCP after a 48-hour exposure, resulting in cytotoxicity (Figure 1D, in gray). To determine if elevated Ca2+ would rescue the effect of FCCP and 50 μM Pb2+ on cytotoxicity, we assessed cell viability following a 48-hour exposure to FCCP, 50 μM Pb2+, and Ca2+. However, the addition of a Ca2+ supplementation did not rescue the decrease in cell viability (Figure S4, analyzed via one-way ANOVA with Tukey′s post-hoc test for multiple comparisons between FCCP and Pb2+ exposure with the FCCP, Pb2+, and Ca2+ exposure, p=0.4184). Previously, we also observed decreases in cell viability across a range of Pb2+ doses following both a 24 and 48-hour exposure in combination with FCCP and RuRed (Figure 1C, Figure 1D, in green). Following the same exposure for 24 hours, but with the additional Ca2+ supplementation, there was no rescue of cytotoxicity as we observed a similar dose response curve and significant loss of cell viability at 25 uM and 50 uM Pb2+ doses (Figure S5A, 25 μM: 25%, p=0.0381 50 μM: 35%, p=0.0399, analyzed via one-way ANOVA with Tukey’s post-hoc correction for multiple comparisons to the control).
Following a 48 hour exposure with Ca2+ supplementation, there appears to be a mild rescue at the lower concentrations of Pb2+, as evidenced by the lack of significant decrease in cell viability at Pb2+ concentrations of 2, 10, and 25 μM (Figure S5B), but at 50 μM Pb2+, there is no rescue as we still observe significant cytotoxicity (Figure S5B, 50%, p<0.0001, analyzed via one-way ANOVA with Tukey’s post-hoc correction for multiple comparisons to the control).
Overall, these results suggest that Ca2+supplementation is likely not enough to fully rescue the increased cytotoxicity associated with these mixture exposures, though at some low doses in the 48-hour exposure, it does appear to alleviate cytotoxicity. While these findings do not completely disprove that Ca2+ supplementation could serve as a rescue, they do not offer robust support of this hypothesis. Future work should assess the Ca2+ dynamics following exposure to these mixtures and the extent to which supplementing cells with additional Ca2+ influences Ca2+ levels in subcellular compartments.
These mixtures do not strongly alter mitochondrial membrane potential
Because we saw no difference in mitochondrial Pb2+ uptake across exposures, we sought to determine if the mechanism driving elevated toxicity could be, in part, the collapse of the mitochondrial membrane potential (MMP). MMP, or ΔΨm, is the difference in electric potential across the inner and outer mitochondrial membranes. Under normal conditions, MMP is maintained by electron transport chain activity which pumps protons into the intermembrane space to establish the proton gradient required for ATP production 40. FCCP can decrease MMP, as dissipation of the MMP results from uncoupling activity that allows protons to flow freely across the membrane, at uncoupler concentrations where that dissipation exceeds the capacity of the cell to increase proton pumping 41, 42. It has also previously been shown that Pb2+ decreases MMP within hours of exposure 32. On the other hand, previous reports have shown that Ru360, another MCU inhibitor, does not impact MMP 43. However, proper function of the MCU is dependent on having an established mitochondrial membrane potential 44. It is possible that the impact that FCCP exerts on MMP, combined with the additional stress of the inhibition of the MCU, results in elevated cytotoxicity in the context of Pb2+ stress.
To determine if our exposure paradigm resulted not only in exacerbated cytotoxicity, but also decreased MMP, we examined membrane potential following 6-hour and 24-hour exposures to the same doses of Pb2+ alone, or in combination with FCCP, RuRed, or both as described previously. TMRE is a dye whose uptake into the mitochondria is dependent on membrane potential; thus, higher fluorescence values are associated with increased membrane potential. We observed that at both the 6-hour and 24-hour timepoints, the 1 μM FCCP, 5 μM RuRed, and combination did not alter MMP, while our positive control (25 μM FCCP) did result in a reduction of the MMP, as expected (Figure 3A, Figure 3B).
Figure 3.

Mitochondrial membrane potential (MMP) following 6- and 24-hour exposures to Pb2+, FCCP, RuRed, and mixtures of the three. A) Assessment of mitochondrial membrane potential following a 6-hour exposure to FCCP (1μM), RuRed (5 μM), and a combination of FCCP and RuRed. A higher dose of FCCP (25 μM) was used as a positive control. B) Assessment of mitochondrial membrane potential following a 24-hour exposure to FCCP (1μM), RuRed (5 μM), and a combination of FCCP and RuRed. A higher dose of FCCP (25 μM) was used as a positive control. For panels A and B, data was analyzed via one-way ANOVA with a Dunnett’s post-hoc test for multiple comparisons of each group to the control (*: p<0.05) C) Assessment of mitochondrial membrane potential following a 6-hour exposure to Pb2+ alone, Pb2+ and RuRed, Pb2+ and FCCP, Pb2+ and FCCP and RuRed. Data was analyzed via two-way ANOVA with a Dunnett’s post-hoc test for multiple comparisons of each group to the control. Pb2+ dose: p=0.6088, additional compound: p=0.6646, interaction: p=0.7792. D) Assessment of mitochondrial membrane potential following a 24-hour exposure to Pb2+ alone, Pb2+ and RuRed, Pb2+ and FCCP, Pb2+ and FCCP and RuRed. Data was analyzed via two-way ANOVA with a Dunnett’s post-hoc test for multiple comparisons of each group to the control. Pb2+ dose: p=0.1645, Additional compound: p=0.0079, interaction: p=0.716. Exposure to a mixture of all chemicals results in a significant decrease in MMP at the 50 μM Pb2+ concentration (40%, p=0.04).
To determine if these mitochondrial toxicants exacerbate the depolarization of the MMP when co-exposed with Pb2+, we then conducted Pb2+ dose responses assessing MMP following the same exposure paradigms previously described. Following a 6-hour exposure to Pb2+ alone, no alterations to MMP were observed (Figure 3C). In a 6-hour exposure to both Pb2+ and RuRed, Pb2+ and FCCP, and the combination of Pb2+, FCCP, and RuRed we again did not detect any differences in MMP (Figure 3C). Following a 24-hour exposure to increasing concentrations of Pb2+ alone, we again observed no alterations in MMP induced by the mixtures of Pb2+ and RuRed or a mixture of Pb2+ and FCCP (Figure 3D). However, the mixture of all three compounds reveals a slight reduction in MMP at the highest Pb2+ concentration of 50 μM (Figure 3D, 40% p=0.04, via two-way ANOVA with Dunnett’s post-hoc correction for multiple comparisons).
Overall, our data indicates the MMP is not greatly disrupted by exposures to these mixtures. In addition, treatments associated with larger reductions in MMP are also associated with decreases in cell viability observed previously. We believe that reduction of MMP in these exposures may be contributing to the loss of cell viability, but given the modest levels of MMP reduction, we suspect that the mechanism driving the loss of cell viability is likely a combination of this decrease in MMP alongside other disruptions to cellular function. Further investigation is necessary to determine the contributions of other cellular mechanisms that may contribute to the observed elevated cytotoxicity.
Conclusion:
In this study, we assessed Pb2+ toxicity in mixtures with two well-established mitochondrial toxicants with known mechanisms of action. We found that non-cytotoxic levels of Pb2+ became cytotoxic in mixtures with FCCP, or a combination of FCCP and RuRed. However, these co-exposures did not alter uptake of Pb2+ into the mitochondria. The mixture of Pb2+, FCCP, and RuRed was associated with mild decreases in MMP, which may contribute to the exacerbated cytotoxicity of these mixtures. Future work should assess alterations in mitochondrial calcium signaling and work to understand how co-exposures to compounds such as these that disrupt mitochondrial calcium homeostasis may also interfere with exposure to common toxicants such as Pb2+, and result in elevated cytotoxicity.
Exposure to chemicals of concern does not happen in isolation. A major barrier towards evaluating chemical risk is understanding the impacts of exposures occurring simultaneously and the interactions that may exacerbate or mitigate health impacts. Multiple exposures such as the mixtures presented in this study are important to consider as growing evidence suggests many environmental chemicals and pharmaceuticals can negatively impact mitochondrial function. Moving forward, it is imperative that we conduct co-exposure studies to understand how multi-chemical exposures will impact human and ecosystem health. Regulatory action for establishing “safe” levels of chemicals often does not have access to data representing how chemicals will act in mixtures with one another. It is important to consider relevant environmental mixtures of compounds that are often found together, as well as mixtures that contain chemicals with common mechanisms of action. Given that compounds may impact mitochondrial function in a number of different ways, we advocate for a tiered approach of testing compounds with unknown mechanisms in combination with a handful of compounds with known mechanisms.
Supplementary Material
Acknowledgements:
We would like to thank the Duke Superfund Center and Analytical Chemistry Core for their support throughout this project as well as Dr. Amy Herring for assistance with statistical tests. This work was supported by the National Science Foundation award GRFP DGE-1644868, NIEHS P42ES010356, and T32ES021432.
Footnotes
Declaration of Interest Statement:
The authors have no interests to declare.
References:
- 1.Abadin H, Ashizawa A, Stevens YW, Llados F, Diamond G, Sage G, Citra M, Quinones A, Bosch SJ and Swarts SG, in Toxicological Profile for Lead, Agency for Toxic Substances and Disease Registry (US), Atlanta (GA), 2007. [PubMed] [Google Scholar]
- 2.Wade AM, Richter DD, Craft CB, Bao NY, Heine PR, Osteen MC and Tan KG, Environmental Science & Technology, 2021, 55, 7981–7989. [DOI] [PubMed] [Google Scholar]
- 3.Jacobs DE, Clickner RP, Zhou JY, Viet SM, Marker DA, Rogers JW, Zeldin DC, Broene P and Friedman W, Environ Health Perspect, 2002, 110, A599–A606. [DOI] [PMC free article] [PubMed] [Google Scholar]
- 4.Patrick L, Altern Med Rev, 2006, 11, 2–22. [PubMed] [Google Scholar]
- 5.Edwards M, Triantafyllidou S and Best D, Environ Sci Technol, 2009, 43, 1618–1623. [DOI] [PubMed] [Google Scholar]
- 6.Yeter D, Banks EC and Aschner M, Int J Environ Res Public Health, 2020, 17. [DOI] [PMC free article] [PubMed] [Google Scholar]
- 7.Betts KS, Environ Health Perspect, 2012, 120, a268–a268. [DOI] [PMC free article] [PubMed] [Google Scholar]
- 8.Lidsky TI and Schneider JS, Brain, 2003, 126, 5–19. [DOI] [PubMed] [Google Scholar]
- 9.Needleman H, Annual Review of Medicine, 2004, 55, 209–222. [DOI] [PubMed] [Google Scholar]
- 10.Hassanien MA and Shahawy AME, Dordrecht, 2011. [Google Scholar]
- 11.Picard M and Shirihai OS, Cell Metabolism, 2022, 34, 1620–1653. [DOI] [PMC free article] [PubMed] [Google Scholar]
- 12.Meyer JN, Leung MCK, Rooney JP, Sendoel A, Hengartner MO, Kisby GE and Bess AS, Toxicol Sci, 2013, 134, 1–17. [DOI] [PMC free article] [PubMed] [Google Scholar]
- 13.Meyer JN, Hartman JH and Mello DF, Toxicol Sci, 2018, 162, 15–23. [DOI] [PMC free article] [PubMed] [Google Scholar]
- 14.Ma L, Liu JY, Dong JX, Xiao Q, Zhao J and Jiang FL, Toxicol Res (Camb), 2017, 6, 822–830. [DOI] [PMC free article] [PubMed] [Google Scholar]
- 15.Reddam A, McLarnan S and Kupsco A, Current Environmental Health Reports, 2022, 9, 631–649. [DOI] [PMC free article] [PubMed] [Google Scholar]
- 16.Bridges CC and Zalups RK, Toxicol Appl Pharmacol, 2005, 204, 274–308. [DOI] [PMC free article] [PubMed] [Google Scholar]
- 17.Marchetti C, ISRN Toxicol, 2013, 2013, 184360. [DOI] [PMC free article] [PubMed] [Google Scholar]
- 18.Simons TJB, British Medical Bulletin, 1986, 42, 431–434. [DOI] [PubMed] [Google Scholar]
- 19.Rădulescu A and Lundgren S, Scientific Reports, 2019, 9, 14225. [DOI] [PMC free article] [PubMed] [Google Scholar]
- 20.Baughman JM, Perocchi F, Girgis HS, Plovanich M, Belcher-Timme CA, Sancak Y, Bao XR, Strittmatter L, Goldberger O, Bogorad RL, Koteliansky V and Mootha VK, Nature, 2011, 476, 341–345. [DOI] [PMC free article] [PubMed] [Google Scholar]
- 21.Kapoor SC, Van Rossum GDV, O’Neill KJ and Mercorella I, Biochemical Pharmacology, 1985, 34, 1439–1448. [DOI] [PubMed] [Google Scholar]
- 22.Gunter TE and Pfeiffer DR, Am J Physiol, 1990, 258, C755–786. [DOI] [PubMed] [Google Scholar]
- 23.Jean-Quartier C, Bondarenko AI, Alam MR, Trenker M, Waldeck-Weiermair M, Malli R and Graier WF, Mol Cell Endocrinol, 2012, 353, 114–127. [DOI] [PMC free article] [PubMed] [Google Scholar]
- 24.Woods JJ and Wilson JJ, Current Opinion in Chemical Biology, 2020, 55, 9–18. [DOI] [PubMed] [Google Scholar]
- 25.Divakaruni AS, Paradyse A, Ferrick DA, Murphy AN and Jastroch M, in Methods in Enzymology, eds. Murphy AN and Chan DC, Academic Press, 2014, vol. 547, pp. 309–354. [DOI] [PubMed] [Google Scholar]
- 26.Ebert A and Goss K-U, Toxicological Sciences, 2021, 185, 208–219. [DOI] [PubMed] [Google Scholar]
- 27.Demine S, Renard P and Arnould T, Cells, 2019, 8. [DOI] [PMC free article] [PubMed] [Google Scholar]
- 28.Kamalian L, Chadwick AE, Bayliss M, French NS, Monshouwer M, Snoeys J and Park BK, Toxicol In Vitro, 2015, 29, 732–740. [DOI] [PubMed] [Google Scholar]
- 29.Swiss R and Will Y, Curr Protoc Toxicol, 2011, Chapter 2, Unit2.20. [DOI] [PubMed] [Google Scholar]
- 30.Dulbecco R and Elkington J, Proc Natl Acad Sci U S A, 1975, 72, 1584–1588. [DOI] [PMC free article] [PubMed] [Google Scholar]
- 31.Bae JH, Park J-W and Kwon TK, Biochemical and Biophysical Research Communications, 2003, 303, 1073–1079. [DOI] [PubMed] [Google Scholar]
- 32.Zarei MH, Pourahmad J, Aghvami M, Soodi M and Nassireslami E, Main Group Metal Chemistry, 2017, 40, 105–112. [Google Scholar]
- 33.Han B, García-Mendoza D, van den Berg H and van den Brink NW, Environmental Toxicology and Chemistry, 2020, 39, 1060–1070. [DOI] [PMC free article] [PubMed] [Google Scholar]
- 34.Dabrowska A, Venero JL, Iwasawa R, Hankir MK, Rahman S, Boobis A and Hajji N, Aging (Albany NY), 2015, 7, 629–647. [DOI] [PMC free article] [PubMed] [Google Scholar]
- 35.Haase H, Hebei S, Engelhardt G and Rink L, Metallomics, 2015, 7, 102–111. [DOI] [PubMed] [Google Scholar]
- 36.Yang X, Wang B, Zeng H, Cai C, Hu Q, Cai S, Xu L, Meng X and Zou F, Brain Res, 2014, 1575, 12–21. [DOI] [PubMed] [Google Scholar]
- 37.Bisbach CM, Hutto RA, Poria D, Cleghorn WM, Abbas F, Vinberg F, Kefalov VJ, Hurley JB and Brockerhoff SE, Sci Rep, 2020, 10, 16041. [DOI] [PMC free article] [PubMed] [Google Scholar]
- 38.Belyaeva EA, Sokolova TV, Emelyanova LV and Zakharova IO, ScientificWorldJournal, 2012, 2012, 136063.. [DOI] [PMC free article] [PubMed] [Google Scholar]
- 39.Castellino N and Aloj S, Br J Ind Med, 1969, 26, 139–143. [DOI] [PMC free article] [PubMed] [Google Scholar]
- 40.Zorova LD, Popkov VA, Plotnikov EY, Silachev DN, Pevzner IB, Jankauskas SS, Babenko VA, Zorov SD, Balakireva AV, Juhaszova M, Sollott SJ and Zorov DB, Anal Biochem, 2018, 552, 50–59. [DOI] [PMC free article] [PubMed] [Google Scholar]
- 41.Hopfer U, Lehninger AL and Thompson TE, Proc Natl Acad Sci U S A, 1968, 59, 484–490. [DOI] [PMC free article] [PubMed] [Google Scholar]
- 42.Benz R and McLaughlin S, Biophys J, 1983, 41, 381–398. [DOI] [PMC free article] [PubMed] [Google Scholar]
- 43.Huang W, Lu C, Wu Y, Ouyang S and Chen Y, Journal of Experimental & Clinical Cancer Research, 2015, 34, 54. [DOI] [PMC free article] [PubMed] [Google Scholar]
- 44.Kamer KJ, Sancak Y, Fomina Y, Meisel JD, Chaudhuri D, Grabarek Z and Mootha VK, Proc Natl Acad Sci U S A, 2018, 115, E7960–e7969. [DOI] [PMC free article] [PubMed] [Google Scholar]
Associated Data
This section collects any data citations, data availability statements, or supplementary materials included in this article.