. 2018 Apr 30;145(9):dev162123. doi: 10.1242/dev.162123

Fig. 3.

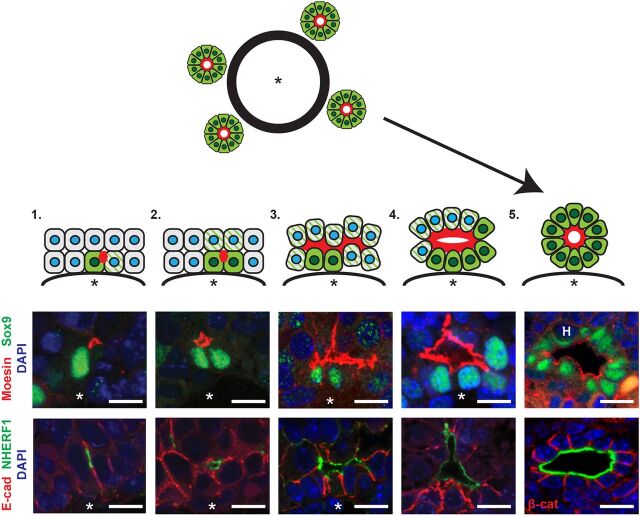
Fig. 3. Stages of de novo biliary morphogenesis. Interpretative diagram and matched images showing five presumptive stages of intrahepatic biliary duct formation in the normal developing liver. (1) Single Sox9+ cells (green) with associated moesin/NHERF1+ punctum (red) and neighboring, obligately polarized future Sox9+ cells (green striped). (2) Sox9+ doublet with moesin/NHERF1+ apical surface in between. (3) Three or more consecutive ductal plate cells associated with moesin/NHERF1+ apical surface, Sox9 expression and some apical constriction. (4) Primitive ductal structure with open lumen, asymmetric distribution of Sox9+ cells and more uniform apical constriction. (5) Complete ductal structure with patent lumen surrounded completely by wedge-shaped Sox9+ cells. Asterisk, portal vein. H, hematopoietic cell. Scale bars: 10 µm.

Stages of de novo biliary morphogenesis. Interpretative diagram and matched images showing five presumptive stages of intrahepatic biliary duct formation in the normal developing liver. (1) Single Sox9+ cells (green) with associated moesin/NHERF1+ punctum (red) and neighboring, obligately polarized future Sox9+ cells (green striped). (2) Sox9+ doublet with moesin/NHERF1+ apical surface in between. (3) Three or more consecutive ductal plate cells associated with moesin/NHERF1+ apical surface, Sox9 expression and some apical constriction. (4) Primitive ductal structure with open lumen, asymmetric distribution of Sox9+ cells and more uniform apical constriction. (5) Complete ductal structure with patent lumen surrounded completely by wedge-shaped Sox9+ cells. Asterisk, portal vein. H, hematopoietic cell. Scale bars: 10 µm.