Abstract
Background and Aims
As the population of aging societies continues to grow, the prevalence of complex coronary artery diseases, including calcification, is expected to increase. Rotational atherectomy (RA) is an essential technique for treating calcified lesions. This study aimed to assess the usefulness of the drilling noise produced during rotablation as a parameter for evaluating the safety and effectiveness of the procedure.
Methods
A human body model mimicking calcified stenotic coronary lesions was constructed using plastic resin, and burrs of sizes 1.25 and 1.5 mm were utilized. To identify the noise source during rotablation, we activated the ROTAPRO™ rotablator at a rotational speed of 180,000 rpm, recording the noise near the burr (inside the mock model) and advancer (outside). In addition to regular operation, we simulated two major complications: burr entrapment and guidewire transection. The drilling noise recorded in Waveform Audio File Format files was converted into spectrograms for analysis and an autoencoder analyzed the image data for anomalies.
Results
The drilling noise from both inside and outside the mock model was predominantly within the 3000 Hz frequency domain. During standard operation, intermittent noise within this range was observed. However, during simulated complications, there were noticeable changes: a drop to 2000 Hz during burr entrapment and a distinct squealing noise during guidewire transection. The autoencoder effectively reduced the spectrogram data into a two‐dimensional representation suitable for anomaly detection in potential clinical applications.
Conclusion
By analyzing drilling noise, the evaluation of procedural safety and efficacy during RA can be enhanced.
Keywords: angioplasty, artificial intelligence, atherectomy, catheterization, vascular calcification
Key points
Aging societies are seeing a rise in complex coronary artery diseases like calcification. Rotational atherectomy is a primary method for treating such calcified lesions.
This study reveals that the drilling noise during rotablation can be used as a unique indicator of the procedure's safety and effectiveness. Notable noise variations were associated with specific complications, aiding in their identification.
By monitoring and analyzing drilling noise, interventional cardiologists can enhance procedural safety, quickly detect complications, and improve the overall efficacy of rotational atherectomy.
1. INTRODUCTION
Coronary artery calcification is common in patients with coronary artery disease in aging societies 1 and can pose a significant challenge to a percutaneous coronary intervention (PCI). 2 , 3 Calcified lesions are associated with a higher risk of adverse cardiovascular events such as myocardial infarction and restenosis than noncalcified lesions. 4 Traditional balloon angioplasty may not be effective for treating calcified lesions, and stenting severely calcified lesions can lead to subsequent stent fractures, restenosis, and target lesion revascularization. 5
The rotational atherectomy (RA) system: the Rotablator™ (Boston Scientific) is a catheter‐based device that uses a diamond‐tipped burr to ablate the calcified plaque in coronary arteries, 6 and has been shown to be effective in modifying calcified lesions, increasing the luminal diameter, and improving angiographic and clinical outcomes. 7 , 8 Although the frequency of complications associated with the Rotablator is not high, the mortality rate for severe complications, when they do occur, is significant. 9 Thus, procedural experience is undeniably critical. 9 The inverse relationship between the number of RA cases handled by an operator and the yearly RA cases in a facility implies that more hands‐on experience can lead to fewer adverse events. This highlights the importance of clinical expertise of Interventional Cardiologists in managing RA cases to prevent severe complications. 9 Compared to the previous Rota Link PLUS™, the new ROTAPRO™ now includes indicators to warn of a decrease in burr's rotational speed. Specifically, a yellow triangle is displayed when there's a drop of 5000 rpm, and a solid yellow triangle appears at a drop of 10,000 rpm. Furthermore, if the rotation decreases by more than 15,000 rpm and continues for more than 0.5 s, the gas supply is halted to prevent damage to the Burr, and a red STALL light is illuminated. In such instances, it becomes necessary to remove the Burr in Dynaglide mode. However, despite these safety mechanisms, it may be challenging to watch the burr's tip under fluoroscopy while also monitoring the indicators. This mock model study introduces an evaluation based on the drilling noise generated during rotablation, serving as a novel indicator to gauge both the safety and effectiveness of the procedure. First, the origin of drilling sound was identified. Secondly, in addition to normal operation, we simulated two major complications: burr entrapment and guidewire transection. Both of these complications can lead to a loss of burr control and, ultimately, perforation, which would require surgical repair. 6 Additionally, we proposed the future clinical implementation of an autoencoder (https://www.tensorflow.org/), an artificial intelligence technique, for further advancement.
2. METHODS
In this study, a hands‐on coronary calcification simulator (Figure 1‐1) was utilized. The simulator model, which represents calcified stenosis, is made of plastic resin and has an inner diameter of 1 mm (Figure 1‐2). The Rotablator was continuously perfused with saline using a pressure infusion bag to cool the machine itself and prevent temperature rise due to rotational friction between the burr and the lesion site. The model is also continuously perfused with saline via a connected pump (SysCooling SC‐300T) to flush out debris generated during Rotablation and prevent temperature rise due to rotational friction. Operators can identify the movement of the Rotablator burr in this transparent coronary model with a 3 mm lumen (Figure 1‐2). After passing the guidewire (ROTAWIRE™ Drive Floppy) successfully through the stenosis, the rotablator (ROTAPRO™) was activated for ~15 s using a 1.25 or 1.5 mm burr.
Figure 1‐1.
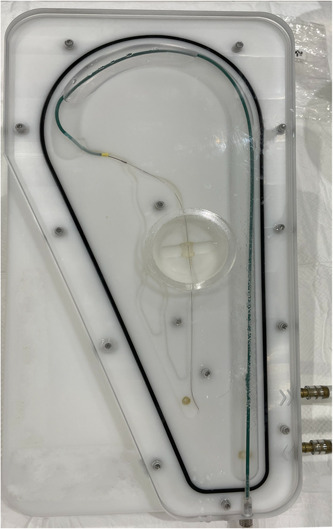
A hands‐on coronary calcification simulator. The model is continuously perfused with saline via a connected pump to flush out debris generated during rotablation and preventing temperature rise due to rotational friction.
Figure 1‐2.
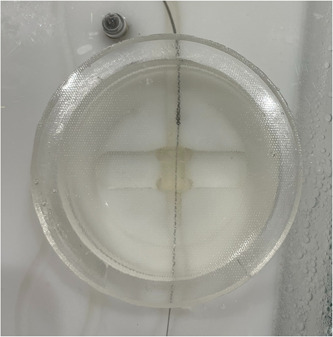
Rotablator Platform Rotablator was continuously perfused with saline using pressure infusion bag to cool the machine itself and preventing temperature rise due to rotational friction between burr and lesion site. Operators can identify the movement of the rotablator burr in a transparent coronary model with a 3 mm lumen. This model, which has calcified stenosis, is made of plastic resin and has an inner diameter of 1 mm. The Rotablator platform was positioned ~1 cm proximal to the calcified stenosis.
2.1. Bench test 1: Determining the source of the drilling noise
First, to determine the source of the drilling noise, a rotablator (ROTAPRO™) was activated, and the noise was recorded at two different locations: close to the burr (within the mock model) and close to the advancer (outside the model) (Figure 2). The rotational speed of the burr was set to 180000 rpm, which is the standard speed for the ROTAPRO™ system. The rotablator platform was set 1 cm proximal to the lesion (Figure 1‐2).
Figure 2.
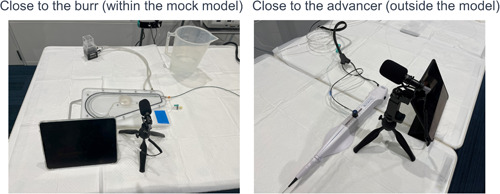
Basal drilling noise recordings. Left: Close to the burr (within the mock model). Right: Close to the advancer (outside the model). In the study, Rota burrs of 1.25 mm or 1.5 mm diameter were activated at 180,000 rpm.
2.2. Bench test 2: Simulating “normal rotablation” and “abnormal rotablation with burr entrapment and guidewire transection”
During normal rotablation, the burr advanced slowly and steadily through the lesion, while being monitored constantly for any signs of burr entrapment or guidewire damage. RA was performed under normal conditions with a burr speed ranging from 3000 to 5000 rpm down. Abnormal rotablation of the burr entrapment was reproduced by pushing the burr against the lesion and applying pressure to the advancer until a stall alarm was triggered. The guidewire transection was reproduced by bending the guidewire, allowing the tip of the burr to come into contact with the guidewire and making it more susceptible to cutting.
To evaluate the drilling noise generated during all rotablation procedures, we recorded the audio in Waveform Audio File Format. These files were then converted into spectrograms, which are graphical representations of the sound frequency content over time. Spectrograms are useful for visualizing complex sound patterns and identifying specific features associated with complications and other outcomes. By analyzing the drilling noise spectrograms, we aimed to identify any patterns or anomalies that could be used to assess the safety and efficacy of the rotablation procedure. To improve the accuracy of the analysis and facilitate clinical implementation, an autoencoder neural network was used to detect anomalies in the image data. The human auditory range refers to the spectrum of sound frequencies perceptible to the human ear. Although the commonly stated range of audible frequencies for humans is from 20 to 20,000 Hz, it may vary to some extent based on factors such as age, genetics, and exposure to loud sounds. Different regions of the ear exhibit varying levels of sensitivity across this frequency range, with the highest sensitivity occurring between 2000 and 5000 Hz. In this study, the upper limit of the human auditory perception was determined using the Mel scale, a perceptual scale based on the frequency perception of the human ear. The Mel scale provides a more accurate representation of how humans perceive different frequencies. The maximum amplitude corresponds to ~8000 Hz on the Mel scale.
Data augmentation was performed by slicing the Mel spectrogram along the time axis into segments of 0.5 s each. Due to the potential for abnormal noise immediately after activating and ending the rotablation, these periods were excluded from the analysis. The analysis specifically focused on the duration when the rotablation was actively activated to isolate its characteristic sound. The Mel spectrogram was visualized using three RGB (Red, Green, Blue) channels and the data within each channel were vectorized. Subsequently, an autoencoder and decoder was used for the vectorized data, resulting in the extraction of features and their plotting as two‐dimensional (2D) data. The architecture of the encoder model was visualized using TensorBoard software (Supporting Information S1: 1).
3. RESULTS
3.1. Bench test 1: Determining the source of the drilling noise
In both scenarios, “close to the burr” (within the mock model) and “close to the advancer” (outside the model), the predominant rotablator drive noise was observed at ~3000 Hz, as shown in Figures 3‐1 and 6‐1. There was no clear difference in the noise between the 1.25 mm burr (Figure 3‐1) and the 1.5 mm burr (Figure 6‐1). These results demonstrated that the noise emitted by the burr operating near the lesion and the noise heard by the advancer were comparable. During the Rotablator procedure, the operator primarily perceived a reference noise level of ~3000 Hz, which originated from the rapidly rotating drive shaft of the device, and which was audible to the operator through the advancer. Furthermore, it was shown that the noise during the rotablator operation varied in the vicinity of the advancer.
Figure 3‐1.
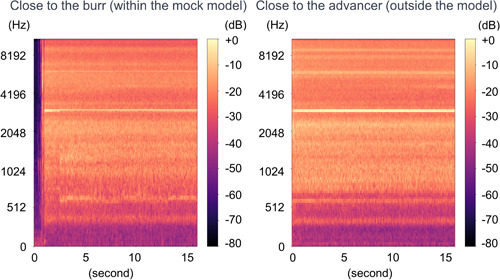
Spectrogram of 1.25 mm burr basal drilling noise. Left: Close to the burr (within the mock model). Right: Close to the advancer (outside the model). The dominant basal drilling noise was around 3000 Hz regardless of situations.
Figure 6‐1.
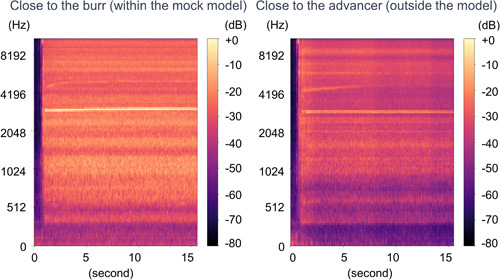
Spectrogram of 1.5 mm burr basal drilling noise. Left: Close to the burr (within the mock model). Right: Close to the advancer (outside the model). The dominant basal drilling noise was around 3000 Hz regardless of situations.
3.2. Bench test 2: Simulating “normal rotablation” and “abnormal rotablation with burr entrapment and guidewire transection”
Based on the results of the previous tests, we recorded the rotablation noise near the advancer. During normal rotablation, there was intermittent noise at ~3000 Hz of reference noise (Figures 4‐1 and 7‐1). However, in cases of abnormal rotablation due to burr entrapment, we noticed a decrease in the noise frequency from 3000 to 2000 Hz (Figures 4‐1 and 7‐1). This decrease in frequency indicated a stall in the burr caused by the deceleration, resulting in a shift of the noise towards a lower frequency range. Conversely, in the cases of guidewire transection, an abnormal high‐frequency squeal noise was observed (Figures 5 and 8). This noise occurred when the burr made contact with a metal element. The observed change in noise was consistent with rotablation using either a 1.25 mm burr or a 1.5 mm burr.
Figure 4‐1.
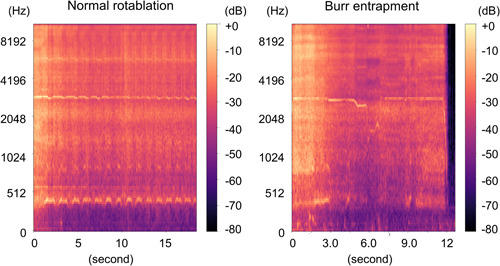
Spectrogram. Left: Normal rotablation with 1.25 mm burr. Right: 1.25 mm. Burr entrapment. Left: Intermittent basal noise was recorded. Right: A decrease from basal noise to lower frequency range was recorded.
Figure 7‐1.
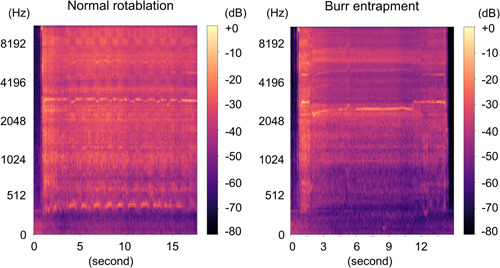
Spectrogram. Left: Normal rotablation with 1.5 mm burr. Right: 1.5 mm. Burr entrapment. Left: Intermittent basal noise was recorded. Right: A decrease from basal noise to lower frequency range was recorded.
Figure 5.
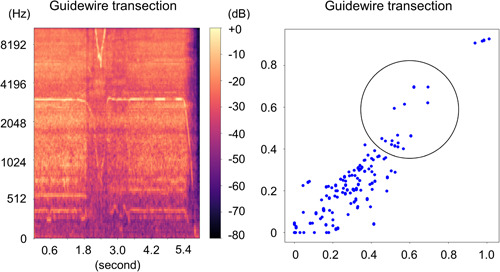
Guidewire transection with 1.25 mm burr. Left: Spectrogram. Right: Two‐dimensional feature map. We observe an alternation in the reference noise towards the low‐frequency range and a change in the high‐frequency noise. The cluster that was originally distributed to the left now appears to have shifted more towards the upper right, while simultaneously, the dense distribution in the lower left also seems to have shifted towards the upper right.
Figure 8.
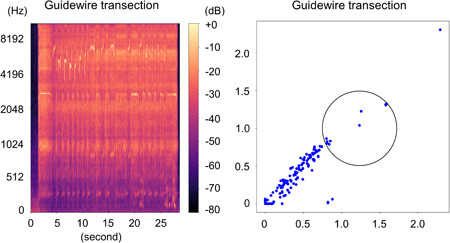
Guidewire transection with 1.5 mm burr. Left: Spectrogram. Right: Two‐dimensional feature map. To provide evidence of differentiation, the region of interest circle was deliberately established in an arbitrary manner. We observe an alternation in the reference noise towards the low‐frequency range and a change in the high‐frequency noise. The cluster that was originally distributed to the left now appears to have shifted more towards the upper right, while simultaneously, the dense distribution in the lower left also seems to have shifted towards the upper right.
3.3. Drawing 2D feature maps
A 2D feature map was obtained by decoding using an autoencoder. The scales on the x and y axes differ based on the burr size. For a burr size of 1.25 mm, as shown in Figures 3‐2, 4‐2, and 5, the scale ranges from 0 to 1.0. However, for a burr size of 1.5 mm, as depicted in Figures 6‐2, 7‐2, and 8, the scale ranges from 0 to 2.0. The reference noise formed a relatively dense cluster in the lower‐left region and a sparse cluster in the upper‐right region, where X = Y. The reference noise was recorded “close to the advancer” (outside the model), resulting in a simulated procedure that closely resembled a sparse upper‐right region where X = Y, an approximate x‐axis of 0.7 and y‐axis of 0.6 for the 1.25 mm burr (Figure 3‐2), and an x‐axis of 1.5 and y‐axis of 1.2 for the 1.5 mm burr (Figure 6‐2). In normal rotablations, no significant differences were observed in the distribution of the reference noise (Figures 4‐2 and 7‐2). However, in situations involving burr entrapment, the position of the reference noise dot changed for both the 1.25 (Figure 4‐2) and 1.5 mm burrs (Figure 7‐2). Furthermore, during the guidewire transection simulation, the points exhibited a more closely clustered distribution along the clustered edge for both the 1.25 (Figure 5) and 1.5 mm burrs (Figure 8).
Figure 3‐2.
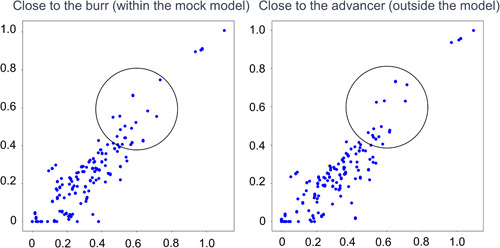
Two‐dimensional feature maps of 1.25 mm burr basal drilling noise. To demonstrate whether there is a difference, the region of interest circle was placed at the same coordinates deliberately. The reference noise formed a relatively dense cluster in the lower‐left region and a sparse cluster in the upper‐right region where X = Y.
Figure 4‐2.
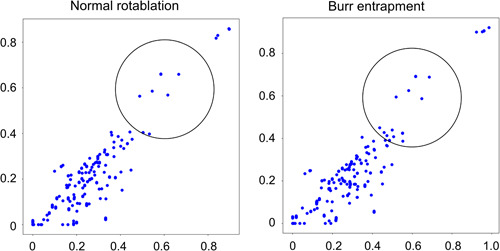
Two‐dimensional feature maps of 1.25 mm burr drilling noise. Left: Normal rotablation. Right: Burr entrapment. To demonstrate whether there is a difference, the region of interest circle was placed at the same coordinates deliberately. The sparse dots resemble the reference distribution in normal rotablation. On the other hand, although the sparse distribution remains similar, the dense distribution in the lower left appears to have shifted towards the upper right in burr entrapment.
Figure 6‐2.
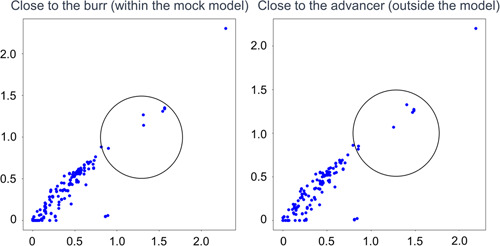
Two‐dimensional feature maps of 1.5 mm burr basal drilling noise. To demonstrate whether there is a difference, the region of interest circle was placed at the same coordinates deliberately. The reference noise formed a relatively dense cluster in the lower‐left region and a sparse cluster in the upper‐right region where X = Y.
Figure 7‐2.
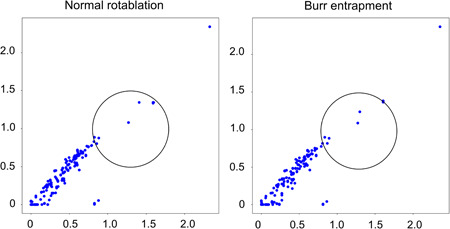
Two‐dimensional feature maps of 1.5 mm burr drilling noise. Left: Normal rotablation. Right: Burr entrapment. The sparse dots resemble the reference distribution in normal rotablation. On the other hand, although the sparse distribution remains similar, the dense distribution in the lower left appears to have shifted towards the upper right in burr entrapment.
4. DISCUSSION
The main results of this study can be summarized as follows. First, the predominant rotablator drive noise was observed consistently at ~3000 Hz, regardless of the proximity to the burr or advancer. Second, simulations were performed to evaluate “normal rotablation” and “abnormal rotablation with burr entrapment and guidewire transection.” During normal rotablation, an intermittent noise at ~3000 Hz was observed. However, in the cases of burr entrapment, a decrease in the noise frequency from 3000 to 2000 Hz was observed, indicating a stall in the burr due to deceleration. Conversely, in the guidewire transection, an abnormal high‐frequency squeal noise occurred when the burr made contact with a metal element. These observed changes in noise were consistent for both the 1.25 and 1.5 mm burrs. Third, with the illustration of the feature map, the reference noise formed relatively dense clusters in the lower‐left region and sparse clusters in the upper‐right region, where X = Y. The position of the reference noise sparse dot changed in situations involving burr entrapment for both the 1.25 and 1.5 mm burrs. In addition, during the guidewire transection simulation, the points exhibited a more closely clustered distribution along the clustered edges for both burr sizes.
The incidence of coronary artery calcification, a complex lesion, is anticipated to increase in advanced countries with growing elderly population. 10 Consequently, the likelihood of encountering coronary artery lesions that are not amenable to device passage is expected to rise. 11 The performance of a Rotablator for such lesions is essential. Several consensus statements 9 , 12 , 13 have been proposed regarding the rotablator technique. Although the frequency of complications is not high, the mortality rate associated with severe complications is significant. Therefore, ensuring a safe and effective execution of the procedure to minimize complications is of paramount importance. The rotablator technique involves manual tactile feedback, visual observation, and auditory perception. In particular, the specific factor of sound generated during the drill activation and lesion ablation is unique to this procedure and not found in other techniques. The operator may recognize the intensity of advancement by observing a decrease in rotational speed displayed on the console, in practical terms and with quicker responsiveness, operators often discern changes in drilling noise. In cases where guidewire transection occurs, changes in frequency, measured in Hz, prove to be more informative than advancement intensity. This is because transection can take place as the burr cuts through by increasing the contact area through bending. The sound emitted by the burr near the lesion and noise heard by the advancer were comparable and distributed around 3000 Hz. It is noteworthy that various sounds are present during PCI. For instance, the heart rate monitor emits a sound around 1000 Hz and typical conversation frequencies range from 500 to 2000 Hz. These do not overlap with the distinct 3000 Hz sound produced by the Rotablator. Hence, this study focused on this factor and also presented the simulated results of the rotablator drill activation sound, lesion ablation sound, and noise during complications. These findings provided valuable insight and may pave the way for future clinical applications.
In this study, we generated 2D feature maps for each type of drilling noise. We employed the autoencoder approach (https://github.com/keras-team/keras) because it allowed us to distinguish and represent the differences in drilling noise accurately. This technique enabled us to create a 2D feature map that effectively captured the distinct characteristics, and we refined it further through technical improvements and the accumulation of data. Overall, these results provided valuable insights into the noise characteristics under different rotablation scenarios.
Currently, there are treatment devices that utilize rotational torque for coronary artery calcification, such as a Rotablator and Orbital Atherectomy (Diamondback 360®, manufactured by Cardiovascular Systems, Inc.) equipped with a high‐speed rotating drive shaft, which presents an opportunity to analyze the sanding noise equivalent to the drilling noise mentioned in this study. By conducting such an analysis, safer and more effective treatments may be investigated.
In the clinical setting, it is important to consider the morphology of calcifications, which should be assessed using various imaging modalities. 14 Optimal treatment outcomes can be achieved by employing imaging modalities for lesion preparation and finalization. In future studies, the fusion of intravascular ultrasound, optical coherence tomography, and noise analysis may enhance the safety and effectiveness of rotablators.
5. LIMITATIONS
First, it is important to acknowledge that this study was conducted exclusively using a mock model for evaluation. Therefore, it is necessary to consider that the behavior of burrs in the human coronary artery may differ. Our simulation was based on a specific scenario wherein the flow was continuous rather than pulsatile, as seen in actual physiological conditions. Additionally, although there are instances when contrast medium and saline may be flushed from the guiding catheter during rotablation, our study did not account for this. Factors such as plaque distribution and calcification in the vessel can significantly influence the burr performance. Second, the evaluated burrs in this study were 1.25 mm and 1.5 mm in size. Further evaluation should include larger burrs measuring more than 1.75 mm to provide a comprehensive assessment. Third, although no specific data regarding the number required for confirmation in autoencoder analysis are available, it is crucial to gather a large‐scale data set to validate the results and ascertain the necessity of data augmentation. Furthermore, we neither reconstructed the encoded 2D data using a decoder nor evaluated their reproducibility. Our study was limited to a theoretical representation of this methodology. The need for data augmentation is likely to be reduced using a sufficiently large‐scale data set. Finally, the dimensions of the input data can be reduced to a downsized format, such as 2D grayscale. These simplified data are easier to encode.
6. CONCLUSIONS
The assessment of procedural safety and efficacy during RA can be enhanced by analyzing drilling noise. Future incorporation of the drilling noise into a clinical setting will unveil its potential value.
AUTHOR CONTRIBUTIONS
Hidenori Komiyama: Conceptualization; data curation; formal analysis; investigation; methodology; project administration; writing—original draft. Takuro Abe: Supervision; writing—review and editing. Toshiyuki Ando: Supervision; writing—review and editing. Masahiro Ishikawa: Supervision; writing—review and editing. Shinji Tanaka: Supervision; writing—review and editing. Shiro Ishihara: Supervision; writing—review and editing. Yoshiro Inoue: Supervision; writing—review and editing. Kentaro Jujo: Supervision; writing—review and editing. Takeshi Hamatani: Methodology; supervision; validation; writing—review and editing. Takashi Matsukage: Project administration; supervision; writing—review and editing.
CONFLICT OF INTEREST STATEMENT
The authors declare no conflict of interest.
TRANSPARENCY STATEMENT
The lead author Hidenori Komiyama affirms that this manuscript is an honest, accurate, and transparent account of the study being reported; that no important aspects of the study have been omitted; and that any discrepancies from the study as planned (and, if relevant, registered) have been explained.
Supporting information
Supporting Information.
Supporting Information.
ACKNOWLDEGMENTS
All authors have read and approved the final version of the manuscript. The lead author, Hidenori Komiyama, had full access to all of the data in this study and takes complete responsibility for the integrity of the data and the accuracy of the data analysis. We would like to express our gratitude to Ms. Atsuko Kusaka and Mr. Kensuke Fukushima from Boston Scientific, and Mr. Atsushi Akimoto from Cardiovascular Systems Inc., for their invaluable technical support and for providing the necessary devices. Additionally, we extend our thanks to Editage (www.editage.com) for their English language editing services for this paper. The supporting source/financial relationships had no involvement in study design; collection, analysis, and interpretation of data; writing of the report; and the decision to submit the report for publication.
Komiyama H, Abe T, Ando T, et al. Analyzing drilling noise in rotational atherectomy: Improving safety and effectiveness through visualization and anomaly detection using autoencoder—A preclinical study. Health Sci Rep. 2023;6:e1739. 10.1002/hsr2.1739
DATA AVAILABILITY STATEMENT
The lead author, Hidenori Komiyama, is committed to providing the data and codes underlying the results of our study. For any reasonable requests related to data access, we assure you that they will be promptly addressed, and the data will be shared accordingly.
REFERENCES
- 1. Budoff MJ, Shaw LJ, Liu ST, et al. Long‐term prognosis associated with coronary calcification. J Am Coll Cardiol. 2007;49(18):1860‐1870. [DOI] [PubMed] [Google Scholar]
- 2. Madhavan MV, Tarigopula M, Mintz GS, Maehara A, Stone GW, Généreux P. Coronary artery calcification. J Am Coll Cardiol. 2014;63(17):1703‐1714. [DOI] [PubMed] [Google Scholar]
- 3. Mintz GS, Popma JJ, Pichard AD, et al. Patterns of calcification in coronary artery disease: a statistical analysis of intravascular ultrasound and coronary angiography in 1155 lesions. Circulation. 1995;91(7):1959‐1965. [DOI] [PubMed] [Google Scholar]
- 4. Abdel‐Wahab M, Richardt G, Büttner HJ, et al. High‐speed rotational atherectomy before paclitaxel‐eluting stent implantation in complex calcified coronary lesions: the randomized ROTAXUS (Rotational Atherectomy Prior to Taxus Stent Treatment for Complex Native Coronary Artery Disease) trial. JACC. 2013;6(1):10‐19. [DOI] [PubMed] [Google Scholar]
- 5. Généreux P, Madhavan MV, Mintz GS, et al. Ischemic outcomes after coronary intervention of calcified vessels in acute coronary syndromes: pooled analysis from the HORIZONS‐AMI (Harmonizing Outcomes With Revascularization and Stents in Acute Myocardial Infarction) and ACUITY (Acute Catheterization and Urgent Intervention Triage Strategy) trials. J Am Coll Cardiol. 2014;63(18):1845‐1854. [DOI] [PubMed] [Google Scholar]
- 6. Gupta T, Weinreich M, Greenberg M, Colombo A, Latib A. Rotational atherectomy: a contemporary appraisal. Interv Cardiol Rev. 2019;14(3):182‐189. [DOI] [PMC free article] [PubMed] [Google Scholar]
- 7. Abdel‐Wahab M, Toelg R, Byrne RA, et al. High‐speed rotational atherectomy versus modified balloons prior to drug‐eluting stent implantation in severely calcified coronary lesions: the randomized prepare‐CALC trial. Circ Cardiovasc Interv. 2018;11(10):e007415. [DOI] [PubMed] [Google Scholar]
- 8. Beohar N, Kaltenbach LA, Wojdyla D, et al. Trends in usage and clinical outcomes of coronary atherectomy: a report from the national cardiovascular data registry CathPCI registry. Circ Cardiovasc Interv. 2020;13(2):e008239. [DOI] [PubMed] [Google Scholar]
- 9. Sakakura K, Ito Y, Shibata Y, et al. Clinical expert consensus document on rotational atherectomy from the Japanese association of cardiovascular intervention and therapeutics: update 2023. Cardiovasc Interv Ther. 2023;38(2):141‐162. [DOI] [PMC free article] [PubMed] [Google Scholar]
- 10. Newman AB, Naydeck BL, Sutton‐Tyrrell K, Feldman A, Edmundowicz D, Kuller LH. Coronary artery calcification in older adults to age 99: prevalence and risk factors. Circulation. 2001;104(22):2679‐2684. [DOI] [PubMed] [Google Scholar]
- 11. Shavadia JS, Vo MN, Bainey KR. Challenges with severe coronary artery calcification in percutaneous coronary intervention: a narrative review of therapeutic options. Can J Cardiol. 2018;34(12):1564‐1572. [DOI] [PubMed] [Google Scholar]
- 12. Barbato E, Carrié D, Dardas P, et al. European expert consensus on rotational atherectomy. EuroIntervention. 2015;11(1):30‐36. [DOI] [PubMed] [Google Scholar]
- 13. Sharma SK, Tomey MI, Teirstein PS, et al. North American expert review of rotational atherectomy. Circ Cardiovasc Interv. 2019;12(5):e007448. [DOI] [PubMed] [Google Scholar]
- 14. Barbato E, Gallinoro E, Abdel‐Wahab M. Management strategies for heavily calcified coronary stenoses: an EAPCI clinical consensus statement in collaboration with the EURO4C‐PCR group. Eur Heart J. 2023;44:4340‐4356. [DOI] [PubMed] [Google Scholar]
Associated Data
This section collects any data citations, data availability statements, or supplementary materials included in this article.
Supplementary Materials
Supporting Information.
Supporting Information.
Data Availability Statement
The lead author, Hidenori Komiyama, is committed to providing the data and codes underlying the results of our study. For any reasonable requests related to data access, we assure you that they will be promptly addressed, and the data will be shared accordingly.


