Abstract
Background:
Cytologic atypia encompasses several features of abnormal cellular morphology. We sought to quantify these features in benign and premalignant/malignant squamous cell lesions in order to better characterize criteria for malignancy.
Methods:
We conducted a rater-blinded observational study in which histopathology slides were evaluated under light microscopy and the presence and relative quantity of 24 distinct cytological features were recorded, along with respective diagnoses. Each slide was evaluated, and the ratings were recorded and analyzed.
Results:
The most helpful findings, whose presence in high numbers indicates an increased likelihood that the tissue sample is premalignant/malignant, were: 1) pleomorphic parakeratosis; 2) pleomorphic nuclei in the epithelium; 3) irregular nuclei; 4) thick refractile nuclear envelope, 5) presence of nuclear hyperchromasia (dark grey); 6) peripheral nucleoli; and 7) nucleolar stems. Higher values of round or oval nuclear shape and vesicular nuclei increase the likelihood that the tissue sample is benign.
Conclusions:
Certain nuclear features have a higher association with premalignancy/malignancy and may guide histologic evaluation of a given lesion. These findings can be used in combination with architectural features and clinical history to add to a complete diagnostic picture.
Keywords: Cytologic Atypia, Keratinocyte, Squamous Cell Carcinoma, Inflammatory Skin Disease
Introduction
Benign inflammatory conditions can present with reactive cytologic features, such as mitotic figures, irregular nuclei and nuclear molding.1 These cellular abnormalities, among other defined morphologic abnormalities termed “cytologic atypia”, are often observed but poorly defined.1 Overlap between reactive and premalignant/malignant nuclear features can muddle the diagnostic picture and result in delayed diagnosis and treatment. Studies have been done to evaluate the significance of the presence of certain features on a smaller scale, which have shown certain features (crowding, irregular nuclei, increased nuclear to cytoplasmic ratio, conspicuous nucleoli, hyperchromasia, presence of abnormal mitotic figures) can reliably indicate that a tissue sample is more likely to be premalignant/malignant.1
Our study aims to add to previous findings using a large sample size of a distinctive sample cohort. We hope to further characterize cytomorphologic changes observed in benign inflammatory and premalignant/malignant squamous cell lesions in order to determine the significance of individual features. Establishing differences or patterns between the two lesions can help to clarify underlying cellular processes and provide clues to better define atypia within different groups of lesions.
Materials and Methods
Our study sample consisted of a stored collection of de-identified, pre-labeled tissue samples preserved on histology slides, which are housed in the Dermatopathology suite of the Dermatology Department. These samples are pre-existing teaching slides, and using a cutoff of no more than 1500 slides for consideration, we separated tissue samples based on inclusion criteria and exclusion criteria. Slides were eligible for inclusion when labeled as either a benign inflammatory squamous cell condition or a squamous premalignant/malignant neoplasm. Inclusion terms for benign inflammatory slides included: ‘psoriasis,’ ‘psoriasiform dermatitis,’ ‘spongiotic dermatitis,’ inflamed seborrheic keratosis (ISK),’ or ‘seborrheic keratosis (SK),’ ‘benign lichenoid keratosis (BLK),’ ‘verrucous keratosis,’ ‘lichen planus (LP),’ ‘lichen planus-like keratosis (LPLK),’ ‘lichenoid eruption,’ ‘lichen simplex chronicus (LSC),’ ‘lichenoid drug eruption,’ ‘lichenoid keratosis,’ ‘lichenoid drug reaction (LDR),’ and ‘lichen planopilaris (LPP).’ For purposes of our study, we defined verrucous keratosis as seborrheic keratosis-like lesions with some changes of warts, such as round parakeratosis, heavy keratinization on the surface, and abundant keratohyaline granules. Inclusion terms for malignant/premalignant slides included: ‘actinic keratosis (AK),’ squamous cell carcinoma in situ (SCCIS), squamous cell carcinoma (SCC), and ‘Bowen disease.’ Slides were excluded if they were not labeled as either an inflammatory or premalignant/malignant squamous cell lesion, or if upon evaluation, were considered of a caliber unfit for inclusion. No patients were enrolled in the study, and at no point were patients contacted, identified, or recruited. No tissue harvesting or access of electronic health records was required. The Medical University of South Carolina Institutional Review Board (IRB) determined this study not to be human research (Pro00121370).
Slides having met inclusion criteria were randomly selected for review. One physician researcher (FK) with extensive dermatopathology training evaluated and scored each slide in order to maintain consistency across all evaluations. Other research personnel (MAD, PS, CJB) recorded scoring values for each feature. The evaluator used light microscopy (LM) to visualize tissue samples and provide scoring values for each of several features of cytologic atypia that can be observed in both benign inflammatory and neoplastic squamous lesions. The evaluator was blinded to the labeled diagnosis in order to minimize observer bias.
Data recorded included category of benign or premalignant/malignant and diagnosis. Twenty-four features of cytologic atypia were evaluated, as shown in Table 1, including: presence and percent of pleomorphic parakaratosis, hyperchromasia in parakeratosis, pleomorphic nuclei in epithelium, irregular nuclei, nuclear molding, round or oval nuclear shape, thick refractile nuclear envelope, vesicular nuclei, solid nuclei, nuclear overlap, increased nuclear to cytoplasmic ratio, presence of black nuclear hyperchromasia, presence of dark grey nuclear hyperchromasia, presence of light grey nuclei, conspicuous nucleoli, blue nucleoli, pink/amphiphilic nucleoli, fine chromatin pattern, coarse chromatin/pepper moth/multiple/irregular nucleoli, peripheral nucleoli, nucleolar stems. In addition, number of mitotic figures present, abnormal mitotic figures, and necrotic cells were recorded. These atypical features were selected to include the ten features and their respective definitions that were observed in a prior study, as well as additional features.1 Definitions are listed in Table 1. For three features, raw counts were recorded and summarized using medians and interquartile ranges (IQRs). For the other features, percentages were recorded based on the following scale: absent; less than 1%; 1–5%; 5–9.9%;10–24.9%; 25–39.9%; 40–59.9%; 60–74.9%; 75–89.9%; 90–94.9%; 95–98.9%; 99% or above. Furthermore, in order to facilitate interpretation, the percentage scale was further simplified, with the midpoint value of each range selected as the representative value: 0.0%; 0.5%; 3%; 7.5%; 17.5%; 32.5%; 50%; 67.5%; 82.5%; 92.5%; 97.5%; 99.5%. Within each of the benign and premalignant/malignant groups, we also determined the overall proportion of samples above the median for each atypia feature, which were compared between groups using Chi-square tests, with p-values < 0.05 representing significant differences. The decision to compare features using these dichotomizations was made because of a high degree of skewness present for many of the features. Next, a stepwise logistic regression analysis was performed to identify the most important variables associated with the outcome (i.e. benign vs premalignant/malignant). Odds ratios and their 95% confidence intervals were reported for the final model. SAS data analysis software (SAS Institute, Cary, NC) was used to perform descriptive statistical analyses and logistic regression.
Table 1.
Features of cytologic atypia and their respective definitions, which were evaluated for each tissue sample.
| Atypical Feature | Definition |
|---|---|
| Mitotic Figure (Number) | The total number, per slide, of dense chromatin and separating chromosomes with 2 or less spindles* |
| Abnormal Mitotic Figure (Number) | The total number, per slide, of mitotic figures with tripolar spindles, or higher* |
| Necrotic Cells (Number) | The total number, per slide, of cells with a shrunken nucleus with clumped chromatin and eosinophilic hyperchromatism* |
| Pleomorphic Parakaratosis (%) | The relative percentage of cells within the stratum corneum containing hyperchromatic nuclei with various sizes and shapes* |
| Hyperchromasia in Parakeratosis (%) | The relative percentage of cells within the stratum corneum containing darkly colored nuclei* |
| Pleomorphic Nuclei in Epithelium (%) | The relative percentage of cells within the epithelium with varying size and shape5 |
| Irregular Nuclei (%) | The relative percentage of cells within the epithelium with misshapen nuclei, such as asymmetrical or sharp edges* |
| Nuclear Molding (%) | The relative percentage of cells within the epithelium with nuclei that have been shaped or indented by a neighboring nucleus5 |
| Round Oval Nuclear Shape (%) | The relative percentage of cells within the epithelium with round or oval nuclei |
| Thick Refractile Nuclear Envelope (%) | The relative percentage of cells within the epithelium with nuclear envelopes which appear dark with refraction |
| Vesicular Nuclei (%) | The relative percentage of cells within the epithelium containing nuclei which has a pale center and conspicuous nucleolar membrane5 |
| Solid Nuclei (%) | The relative percentage of cells within the epithelium containing nuclei with smooth and uniform hyperchromasia5 |
| Nuclear Overlap (%) | The relative percentage of cells within the epithelium that are in physical contact with or overlap the nuclei of an adjacent cell. Also known as crowding* |
| Increased Nuclear to Cytoplasmic Ratio (%) | The relative percentage of cells within the epithelium with a nucleus over one-half the size of the total volume of the cell* |
| Presence Of Nuclear Hyperchromasia (Black) (%) | The relative percentage of cells within the epithelium with increased chromatin pigmentation, appearing black in color* |
| Presence Of Nuclear Hyperchromasia (Dark Grey) (%) | The relative percentage of cells within the epithelium with increased chromatin pigmentation, appearing dark grey in color* |
| Presence Of Nuclear Hyperchromasia (Light Grey) (%) | The relative percentage of cells within the epithelium with increased chromatin pigmentation, appearing light grey in color* |
| Conspicuous Nucleoli (%) | The relative percentage of cells within the epithelium containing easily distinguishable nucleoli using a 100x magnification lens* |
| Blue Nucleoli (%) | The relative percentage of cells within the epithelium containing nuclei that have basophilic, blue staining nucleoli |
| Pink/Amphiphilic Nucleoli (%) | The relative percentage of cells within the epithelium containing nuclei that have eosinophilic, pink staining nucleoli |
| Fine Chromatin Pattern (%) | The relative percentage of cells within the epithelium containing discernable chromatin within the nucleus |
| Coarse Chromatin/Pepper Moth/Multiple/Irregular Nucleoli (%) | The relative percentage of cells within the epithelium containing nucleoli with multiple, clumped, irregular, or spotted chromatin5 |
| Peripheral Nucleoli (%) | The relative percentage of cells within the epithelium containing nucleoli found at the peripheral edge of the nucleus |
| Nucleolar Stems (%) | The relative percentage of cells within the epithelium containing a linear projection extending from the nucleoli |
Atypical Feature and Definition as described by or adapted from Malhotra et. al1
Results
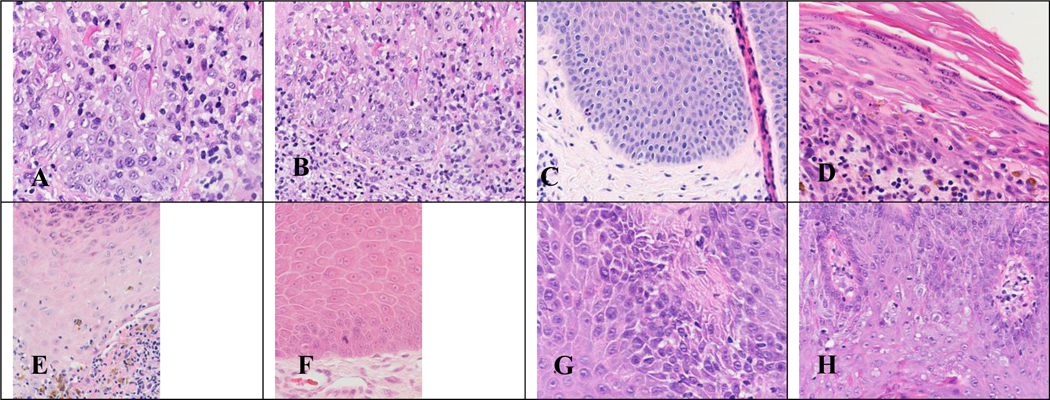
A total of 324 benign tissue samples (Figure 1) and 418 premalignant/malignant samples (Figure 2) were included in the analyses (Table 2). Figure 3 demonstrates histopathologic images of cytologic atypical features observed in various tissue samples. Atypical feature comparisons between benign and premalignant/malignant samples are listed in Table 3, which provides descriptive statistics (median and interquartile ranges [IQRs]) for each feature and p-values for unadjusted hypothesis tests comparing benign and premalignant/malignant groups. The groups differed significantly (p<0.05) on 20 of the 24 features examined. No group differences were noted for number of abnormal mitotic figures, thick refractile nuclear envelope, vesicular nuclei, and fine chromatin pattern. For three features, the premalignant/malignant samples had significantly lower values than the benign samples: round/oval nuclear shape, conspicuous nucleoli, and pink/amphiphilic nucleoli. For all other features, the premalignant/malignant samples had significantly higher values than the benign samples.
Figure 1. Hematoxylin and eosin (H&E) stains of benign tissue samples evaluated during our study.
Figure 1. (A) Benign lichenoid keratosis x400 magnification. (B) Benign lichenoid keratosis x200 magnification. (C) Chronic spongiotic dermatitis x200 magnification. (D) Lichen planus x400 magnification. (E) Lichen planus x400 magnification. (F) Prurigo nodularis x400 magnification. (G) Psoriasis x400 magnification. (H) Psoriasis x400 magnification.
Figure 2. Hematoxylin and eosin (H&E) stains of premalignant/malignant tissue samples evaluated during our study.
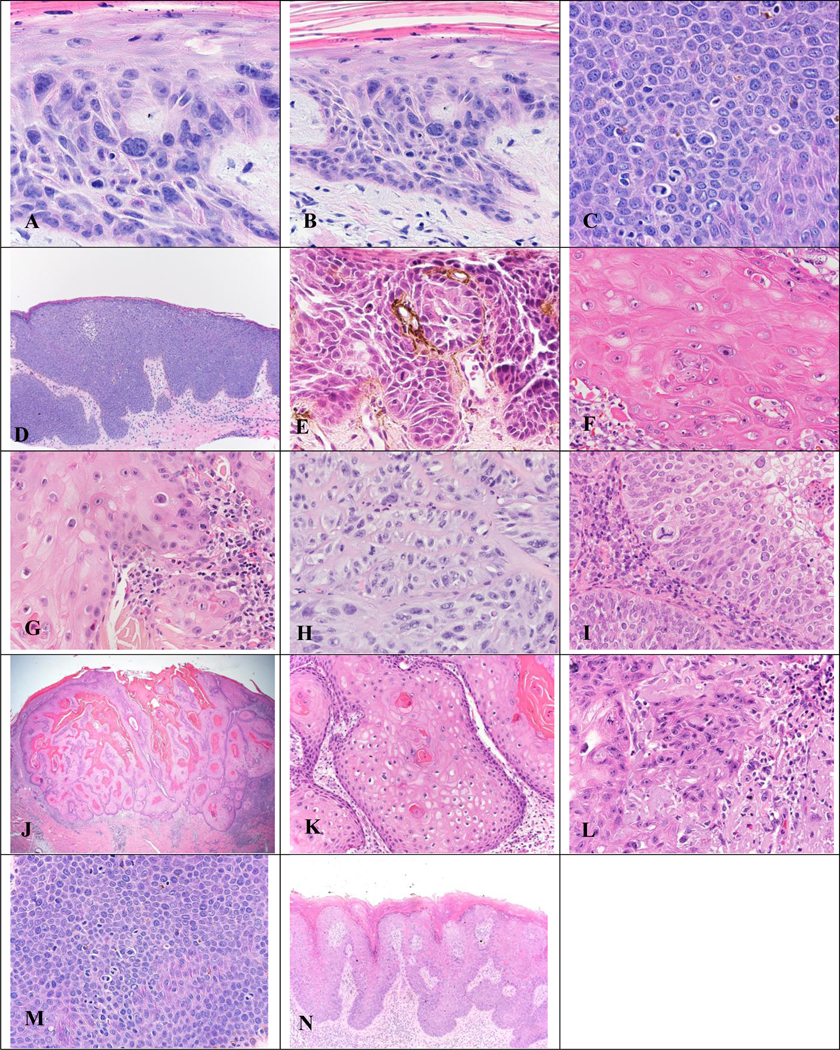
Figure 2. (A) Actinic keratosis (AK) x400 magnification. (B) AK x200 magnification. (C) Bowen Disease of the genitals x400 magnification. (D) Bowen Disease of the genitals x100 magnification. (E) Bowen Disease of the genitals x400 magnification. (F) Keratoacanthoma (KA) x400 magnification. (G) KA x400 magnification. (H) Squamous Cell Carcinoma (SCC) x400 magnification. (I) SCC x400 magnification. (J, K, L) KA x20, x200, and x400 magnification, respectively. (M) Genital Bowen Disease x400 magnification. (N) Bowen Disease in HPV x200 magnification.
Table 2.
The diagnoses and respective numbers and percentages evaluated within benign and premalignant/malignant groupings.
| Diagnosis | N (%) | |
|---|---|---|
| Benign (N=324) | Psoriasis or Psoriasiform Dermatitis | 95 (29.3) |
| Spongiotic Dermatitis | 21 (6.5) | |
| Inflamed Seborrheic Keratosis or Seborrheic Keratosis | 95 (29.3) | |
| Benign Lichenoid Keratosis | 34 (10.5) | |
| Verrucous Keratosis | 0 (0.0) | |
| Lichenoid Dermatosis, Lichen Planus, Lichenoid Eruption, Lichen Simplex Chronicus, Lichenoid Drug Eruption/Reaction, Lichenoid Keratosis, Lichen Planopilaris | 79 (24.4) | |
| Premalignant/Malignant (N = 418) | Actinic Keratosis | 41 (9.8) |
| Squamous Cell Carcinoma in Situ, Bowen Disease | 179 (42.8) | |
| Squamous Cell Carcinoma, Keratoacanthoma | 196 (46.9) | |
| SCCIS and SCC | 1 (0.2) | |
| Unlabeled “malignant” | 1 (0.2) |
Figure 3. Histopathologic images of cytologic atypical features observed in various tissue samples.
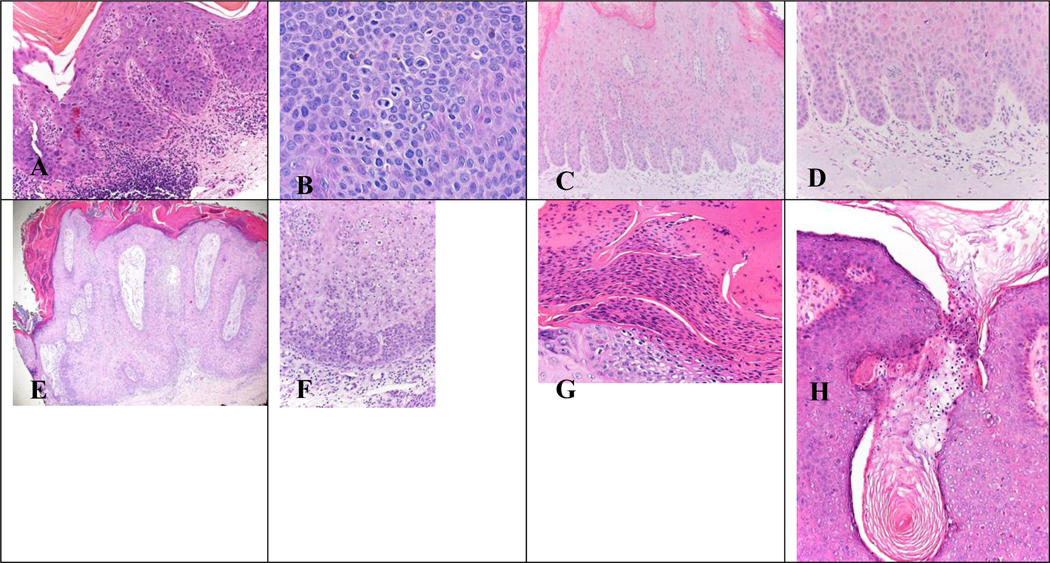
Figure 3. (A) Abnormal mitotic figures observed in Bowen Disease x200 magnification. (B) Mitotic figures observed in genital Bowen Disease x400 magnification. (C, D) Glassy nuclei observed in Bowen Disease in Human Papilloma Virus (HPV) in x200 magnification. (E, F) Hyperchromatic parakeratosis observed in Bowen Disease at x20 and x200 power, respectively. (G) Hyperchromatic parakeratosis observed in Bowen Disease x400 magnification. (H) Round parakeratosis observed in Bowen Disease x200 magnification.
Table 3.
Comparisons in atypical features between benign and premalignant/malignant groups.
| Atypical Feature | Benign (N = 324) | Premalignant/Malignant (N = 418) | P-Value* | ||
|---|---|---|---|---|---|
|
| |||||
| Median Value (Interquartile Range) | Proportion of Samples Greater Than the Median | Median Value (Interquartile Range) | Proportion of Samples Greater Than the Median | ||
| Mitotic Figure (Number) | 1.0 (0.0 – 1.0) | 18.5% | 1.0 (0.0 – 2.0) | 34.9% | <0.0001 |
| Abnormal Mitotic Figure (Number) | 0.0 (0.0 – 0.0) | 11.0% | 0.0 (0.0 – 0.0) | 16.0% | 0.054 |
| Necrotic Cells (Number) | 0.0 (0.0 – 1.0) | 19.1% | 1.0 (0.0 – 3.0) | 44.5% | <0.0001 |
| Pleomorphic Parakaratosis (%) | 0.0 (0.0 – 0.0) | 9.9% | 0.0 (0.0 – 7.5) | 47.1% | <0.0001 |
| Hyperchromasia In Parakeratosis (%) | 0.0 (0.0 – 0.0) | 10.5% | 0.0 (0.0 – 3.0) | 44.5% | <0.0001 |
| Pleomorphic Nuclei In Epithelium (%) | 3.0 (0.5 – 7.5) | 17.0% | 17.5 (7.5 – 32.5) | 62.9% | <0.0001 |
| Irregular Nuclei (%) | 0.5 (0.5 – 3.0) | 13.3% | 7.5 (3.0 – 17.5) | 58.6% | <0.0001 |
| Nuclear Molding (%) | 3.0 (1.75 – 7.5) | 25.6% | 7.5 (3.0 – 17.5) | 59.1% | <0.0001 |
| Round Oval Nuclear Shape (%) | 82.5 (50.0 – 82.5) | 71.6% | 50.0 (32.5 – 67.5) | 28.5% | <0.0001 |
| Thick Refractile Nuclear Envelope (%) | 17.5 (3.0 – 32.5) | 34.0% | 17.5 (3.0 – 32.5) | 39.7% | 0.11 |
| Vesicular Nuclei (%) | 17.5 (3.0 – 32.5) | 39.6% | 17.5 (3.0 – 32.5) | 36.4% | 0.38 |
| Solid Nuclei (%) | 7.5 (3.0 – 17.5) | 39.5% | 17.5 (3.0 – 32.5) | 54.3% | <0.0001 |
| Nuclear Overlap (%) | 3.0 (0.5 – 3.0) | 24.4% | 7.5 (3.0 – 7.5) | 50.2% | <0.0001 |
| Increased Nuclear to Cytoplasmic Ratio (%) | 0.5 (0.0 – 3.0) | 14.2% | 3.0 (0.5 – 17.5) | 48.1% | <0.0001 |
| Presence of Nuclear Hyperchromasia (Black) (%) | 0.5 (0.0 – 0.5) | 14.8% | 0.5 (0.0 – 3.0) | 29.7% | <0.0001 |
| Presence of Nuclear Hyperchromasia (Dark Grey) (%) | 3.0 (0.5 – 3.0) | 22.5% | 3.0 (3.0 – 7.5) | 44.3% | <0.0001 |
| Presence of Nuclear Hyperchromasia (Light Grey) (%) | 7.5 (3.0 – 7.5) | 21.3% | 7.5 (3.0 – 17.5) | 38.5% | <0.0001 |
| Conspicuous Nucleoli (%) | 50.0 (17.5 – 67.5) | 52.2% | 32.5 (17.5 – 67.5) | 43.8% | 0.02 |
| Blue Nucleoli (%) | 0.0 (0.0 – 3.0) | 30.2% | 3.0 (0.5 – 17.5) | 57.4% | <0.0001 |
| Pink/Amphiphilic Nucleoli (%) | 99.5 (92.5 – 99.5) | 63.9% | 97.5 (82.5 – 99.5) | 41.4% | <0.0001 |
| Fine Chromatin Pattern (%) | 17.5 (3.0 – 50.0) | 48.1% | 17.5 (7.5 – 50.0) | 43.5% | 0.21 |
| Coarse Chromatin/Pepper Moth/Multiple/Irregular Nucleoli (%) | 7.50 (3.00 – 17.50) | 10.8% | 17.50 (7.50 – 32.50) | 28.2% | <0.0001 |
| Peripheral Nucleoli (%) | 0.50 (0.50 – 3.00) | 35.5% | 3.00 (0.50 – 7.50) | 60.3% | <0.0001 |
| Nucleolar Stems (%) | 0.50 (0.00 – 0.50) | 20.4% | 0.50 (0.00 – 3.00) | 31.1% | 0.001 |
P-values were obtained from chi-square tests comparing the proportion above the median between benign and premalignant/malignant samples.
Results of the stepwise logistic regression analysis are shown in Table 4. Of the original 24 atypical features, nine were included in the final multivariable model, meaning that they were all significantly (p<0.05) and independently associated with premalignant/malignant/benign status. An odds ratio (OR) greater than 1.0 indicates that a high value for that feature (i.e. being above the median) is associated with an increased odds of being premalignant/malignant. This was observed in the following features: pleomorphic parakeratosis, pleomorphic nuclei in the epithelium, irregular nuclei, thick refractile nuclear envelope, presence of dark grey nuclear hyperchromasia, peripheral nucleoli, and nucleolar stems (Figure 4). An OR less than 1.0 indicates that a high value for that feature is associated with a significantly decreased odds of being premalignant/malignant, which was the case for round/oval nuclear shape and vesicular nuclei. Table 4 indicates the specific features which, in high numbers, indicate benign or premalignant/malignant tissue samples.
Table 4:
Results of the stepwise logistic regression, including beta estimates, standard errors, and odds ratios.
| Atypical Feature | β | SE | OR (95% CI) | Benign or Premalignant/Malignant |
|---|---|---|---|---|
| Pleomorphic Parakaratosis (%) | 1.2822 | 0.2456 | 3.6 (2.2, 5.8) | Premalignant/Malignant |
| Pleomorphic Nuclei in Epithelium (%) | 0.9119 | 0.2612 | 2.5 (1.5, 4.2) | Premalignant/Malignant |
| Irregular Nuclei (%) | 1.1308 | 0.258 | 3.1 (1.9, 5.1) | Premalignant/Malignant |
| Round Oval Nuclear Shape (%) | −0.7993 | 0.2185 | 0.5 (0.3, 0.7) | Benign |
| Thick Refractile Nuclear Envelope (%) | 0.9723 | 0.2787 | 2.6 (1.5, 4.6) | Premalignant/Malignant |
| Vesicular Nuclei (%) | −0.6559 | 0.2762 | 0.5 (0.3, 0.9) | Benign |
| Presence of Nuclear Hyperchromasia (Dark Grey) (%) | 0.4652 | 0.2175 | 1.6 (1.0, 2.4) | Premalignant/Malignant |
| Peripheral Nucleoli (%) | 0.7963 | 0.2060 | 2.2 (1.5, 3.3) | Premalignant/Malignant |
| Nucleolar Stems (%) | 0.483 | 0.2331 | 1.6 (1.0, 2.6) | Premalignant/Malignant |
Figure 4. Histopathologic images of cytologic atypical features whose presence in higher numbers indicates the tissue is more likely to be premalignant/malignant.
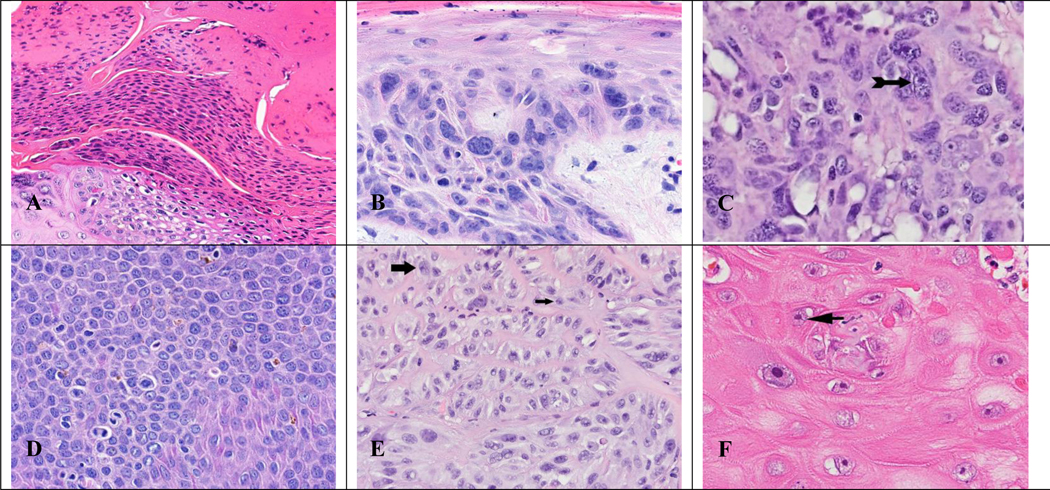
(A) Pleomorphic parakeratosis x400 magnification. (B) Pleomorphic nuclei in the epithelium x400 magnification. (C) Irregular nuclei with thick refractile nuclear envelope (arrow) x400 magnification. (D) Presence of nuclear hyperchromasia (dark grey) x400 magnification. (E) Irregular, peripheral nucleoli (large arrow) with nucleolar stem (small arrow) x400 magnification. (F) Nucleolar stem (arrow) x400 magnification.
Discussion
When cytological evaluation is used to help determine a diagnosis, it is important to be able to weigh the importance of various nuclear features. In our study, we sought to determine which features are most predictive of a premalignant/malignant diagnosis. Several features of cytologic “atypia” are frequently observed in both benign reactive and premalignant/malignant lesions and have poor predictive value. Based on our logistic regression model, we conclude that the presence of seven specific features correlate best with higher risk of premalignancy/malignancy: pleomorphic parakeratosis, pleomorphic nuclei in the epithelium, irregular nuclei, thick refractile nuclear envelope, presence of dark grey nuclear hyperchromasia, peripheral nucleoli, and nucleolar stems. Higher numbers of the following two features correlate with a higher likelihood of benign tissue: round oval nuclear shape and vesicular nuclei. Interestingly, two significant features indicative of a premalignant/malignant or benign condition, thick refractile nuclear envelope and vesicular nuclei, respectively, were not significant in the unadjusted analysis but were significant in the multivariate model. This was likely due to associations between these variables and other variables included in the model.2
Figure 5 depicts an inflamed keratosis with reactive atypia and provides an example of a difficult clinical case in which using these findings would be helpful in making a diagnosis.
Figure 5. Inflamed keratosis with reactive atypia.
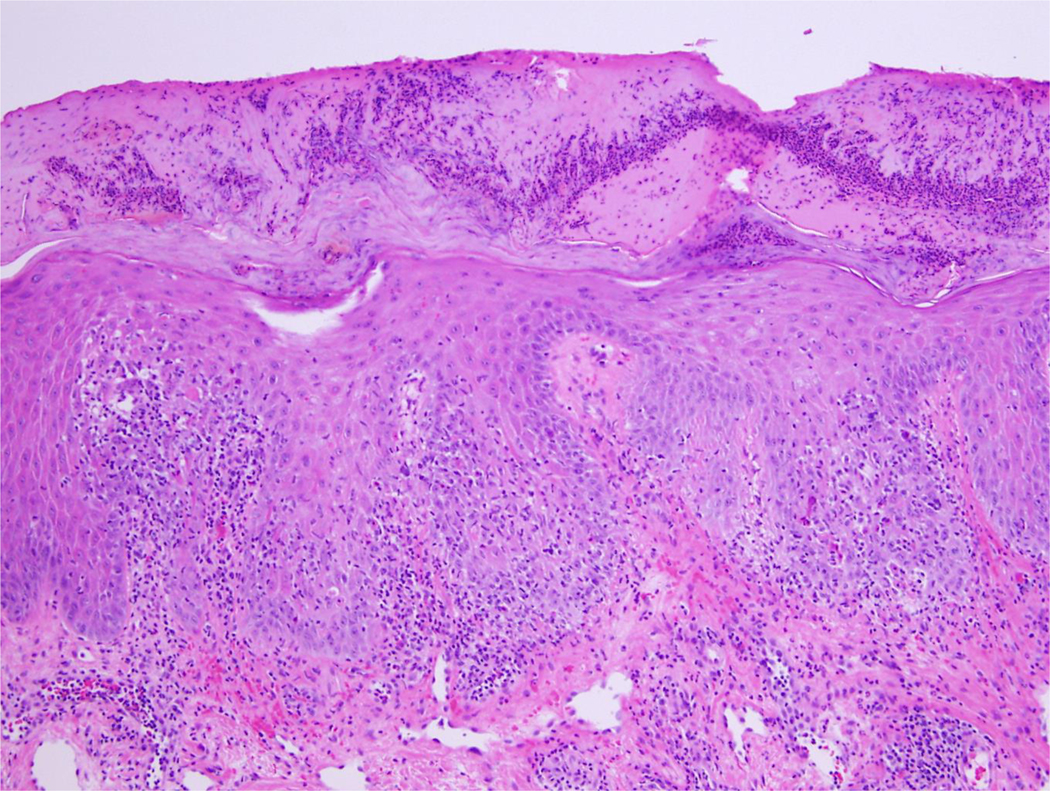
Inflamed keratosis with reactive atypia at x200 magnification in which utilizing the identified criteria could be helpful in establishing a diagnosis
Our findings differ from those of a prior study which evaluated the frequencies of 11 features in 83 benign and 69 pre/malignant squamous lesions to determine the significance of certain features.1 Both studies found the presence of irregular nuclei to be helpful.1 The difference in findings may be attributable to sample size, sampling bias in the archived slides, and variation between human raters.3 We sought to minimize variation by using a single blinded rater for all slides. Pleomorphism has been noted in AKs and is conserved as lesions progress.4 Peripheral nucleoli have been previously noted in SCC.4
A limitation of our study is the fact that we evaluated a limited number of atypical features. Future studies should be done to evaluate the importance of additional features such as keratohyaline granules and presence of keratinocyte polarization. Studies of lesions in specific anatomic locations, such as the lower legs, would also be of value.
In sum, our study suggests nuclear features with predictive value in regard to neoplastic vs reactive atypia. These include pleomorphic parakeratosis, pleomorphic nuclei in the epithelium, irregular nuclei, round oval nuclear shape, thick refractile nuclear envelope, vesicular nuclei, dark grey nuclear hyperchromasia, peripheral nucleoli, and nucleolar stems.
Acknowledgements:
All authors meet criteria for authorship.
Dr. Nietert’s time on this project was funded, in part, by the National Center for Advancing Translational Sciences of the National Institutes of Health under Grant Number UL1 TR001450. The content is solely the responsibility of the authors and does not necessarily represent the official views of the National Institutes of Health. All other authors have no conflicts of interest to declare.
This publication was supported by the South Carolina Clinical & Translation Research (SCTR) Institute, with an academic home at the Medical University of South Carolina NIH - NCATS Grant Number UL1 TR001450.
Footnotes
Institutional Review Board (IRB) Pro00121370.
This work has not been published previously.
References
- 1.Malhotra S, Kazlouskaya V, Andres C, Gui J, Elston D. Diagnostic cellular abnormalities in neoplastic and non-neoplastic lesions of the epidermis: a morphological and statistical study. J Cutan Pathol. 2013;40(4):371–378. doi: 10.1111/cup.12090 [DOI] [PMC free article] [PubMed] [Google Scholar]
- 2.Lo SK, Li IT, Tsou TS, See L. [Non-significant in univariate but significant in multivariate analysis: a discussion with examples]. Changgeng Yi Xue Za Zhi. 1995;18(2):95–101. PMID: 7641117 [PubMed] [Google Scholar]
- 3.Andrade C. Sample size and its importance in research. Indian J Psychol Med. 2020;42(1):102–103. doi: 10.4103/IJPSYM.IJPSYM_504_19 [DOI] [PMC free article] [PubMed] [Google Scholar]
- 4.Yanofsky VR, Mercer SE, Phelps RG. Histopathological variants of cutaneous squamous cell carcinoma: a review. J Skin Cancer. 2011;2011:210813. doi: 10.1155/2011/210813 [DOI] [PMC free article] [PubMed] [Google Scholar]
- 5.Valdebran M, Bandino J, Elbendary A, et al. Nuclear and cytoplasmic features in the diagnosis of Clark’s nevi. J Cutan Pathol. 2018;45(3):204–207. doi: 10.1111/cup.13085 [DOI] [PMC free article] [PubMed] [Google Scholar]


