Abstract
Establishing stable and efficient Pt-free counter electrodes (CEs) is an important challenge for dye-sensitized solar cells (DSSCs). Ti3C2Tx MXene, with its high catalytic activity and conductivity, has gained attention as a CE in DSSCs. The focus of this paper is on the preparation of Ti3C2Tx decorated carbon nanotubes (CNTs) composite electrode materials (CNTs/Ti3C2Tx), and testing their performance as CEs in DSSCs. Through a series of electrochemical tests, a CNTs/Ti3C2Tx CE exhibits good electrocatalytic activity toward iodine-based electrolytes with low charge transfer resistance, which is close to the performance of a Pt CE. The photoelectric conversion efficiency (PCE) of the CNTs/Ti3C2Tx (1.0 wt%) CE-based DSSCs reaches 5.83%, which is much higher than that of the CNTs CE (3.70%), and approximates that of the Pt CE (6.61%). We attribute the improved performance to the synergistic effect of the excellent conductivity and unique two-dimensional chemical structure of Ti3C2Tx MXene. Moreover, the photostability test of continuous light exposure shows that the CNTs/Ti3C2Tx-1.0 wt% (C/T-1.0 wt%) CE exhibits good stability to the electrolyte. Therefore, CNTs/Ti3C2Tx composites can be used as an efficient Pt-free CE for DSSCs in the future.
Establishing stable and efficient Pt-free counter electrodes (CEs) is an important challenge for dye-sensitized solar cells (DSSCs).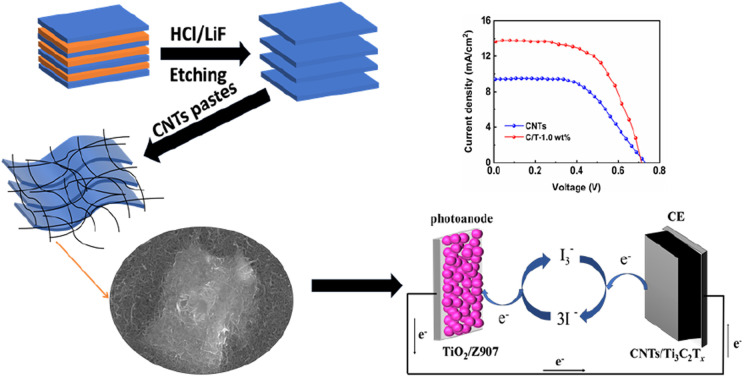
1. Introduction
The world's energy production needs to change as never before to satisfy the urgent need to replace fossil fuels to mitigate their impact on climate change and to keep pace with the growing global demand for energy. This demands a swift shift towards large-scale use of renewable energy sources, of which solar energy has the greatest potential.1 As one of the solutions to the energy problem, solar cells have been developed into the third generation, represented by DSSCs, perovskite solar cells (PSCs), and organic solar cells.2,3 Due to their simple structure, low cost, and high conversion efficiency, DSSCs are more competitive than other third-generation solar cells.4 The classical DSSCs consist of a dye-sensitized nanocrystalline titanium dioxide (TiO2) photoanode, an electrolyte containing an iodide/triiodide (I−/I3−) redox pair, and a platinum (Pt) CE. The CE materials act as catalysts to reduce I3− to I− at the CE/electrolyte interface. They also act as a medium for collecting electrons from the external circuit. The catalytic reduction of I3− to I− occurs at the active sites of the CE catalyst. This means that more active sites will have a faster catalytic reaction rate. In addition, both the photoanode and CE are exposed to the electrolyte, and the fast reduction reaction on the CE can inhibit the charge recombination process on the photoanode.5–7 Therefore, the catalytic properties of CE materials play an important role in the PCE regulation of DSSCs. The noble metal Pt is usually the optimal material, but the commercialization of DSSCs is hampered by the low crustal content and the high price of Pt metal. Therefore, to commercialize DSSCs, it becomes imperative to design a non-Pt CE material with high conductivity, high catalytic properties, low cost, and environmental friendliness.
Compared with other CE materials, carbon-based materials are one of the most promising materials to replace Pt-based CEs because of their good conductivity and stability.8,9 One particular allotrope of carbon, CNTs, has received more attention compared to other CE materials because of their relatively low cost, excellent electrical conductivity, high catalytic activity, and stability. In 2003, Yanagida's group prepared single-walled carbon nanotubes (SWCNTs) in CE and obtained a PCE of 4.5%.10 To obtain good electrical conductivity and catalytic performance of multi-walled carbon nanotubes (MWCNTs) CE, Peng's group used a new drying method to adjust the thickness, concentration, and array height of MWCNTs films, and the PCE of DSSCs based on the MWCNTs CE achieved as high as 9.5%.11 Surface modification and element doping are two effective paths to enhance the catalytic performance of the CNTs CE. Ali's group deposited CoSe nanoparticles on MWCNTs by using a simple hydrothermal deposition method to enhance the catalytic activity of MWCNTs. The catalytic activity of CoSe/MWCNTs CE was improved with a PCE of 6.42%, which was higher than that of the devices based on MWCNTs CE (3.4%) and Pt CE (5.6%).12 Leu's group proposed the doping of boron (B) into the CNTs to improve both conductivity and catalytic properties. The DSSCs exhibited a PCE of 7.91%, higher than that of the CNTs CE (6.02%) and approximated to that of Pt CE (8.02%).13 Yun's group applied atomic layer deposition (ALD) to induce ruthenium (Ru) atoms in MWCNTs. After 600 deposition cycles, the optimum conductivity and catalytic activity were achieved, and the PCE of Ru–MWCNTs CE was increased from 1.6% to 6.8%.14 Nevertheless, in most cases, the electrical conductivities and catalytic activities of CNTs still cannot match up to those of Pt. The major concerns are an optimization of the physical and chemical properties of CNTs to further enhance their catalytic activity for high-performance DSSCs.
In recent years, MXene is a new class of transition metal carbide/nitride two-dimensional crystalline materials with similar structures as graphene. The chemical formula is Mn+1Xn, where M is an early transition metal and X is C and/or N. The materials can be prepared by exfoliating layered ceramic materials (MAX phase) with hydrofluoric acid (HF) or HCl/LiF.15 One typical MXene Ti3C2Tx, is widely used due to its biocompatibility, wide layer spacing, large surface area, strong catalytic activity, thermal stability, electrical conductivity, and environmental suitability.16–18 Ti3C2Tx MXene is also an alternative CE material in quantum dot-sensitized solar cells (QDSSCs) and DSSCs. Chen's group improved the electrocatalytic and conductive properties of Ti3C2Tx CE by depositing CoS on Ti3C2Tx MXene with a hydrothermal method, and the PCE was as high as 8.1%, which was higher than the PCE of CoS CE (5.70%) and Ti3C2Tx CE (4.25%).19 In addition, Tian's group prepared CuS/Ti3C2Tx CE by ion-exchange method. The high conductivity of Ti3C2Tx and the catalytic property of CuS synergistically increased the efficiency from the original 3.26% to 5.11%.20 Nagalingam's group applied the conducting polymer PEDOT to modify Ti3C2Tx MXene to improve the catalytic and conductive ability of CE. The PCE of PEDOT@Ti3C2Tx CE-based DSSCs was increased to 7.12%, which was higher than PEDOT CE (4.4%) and Ti3C2Tx CE (5.6%).21 He's group built a structure with an optimal ratio of CoMoP2 and Ti3C2Tx, while using CNTs to suppress agglomeration and repetitive stacking between Ti3C2Tx MXene layers. The PCE based on this method reached 10.64%, higher than the Pt CE-based DSSC efficiency of 7.04%.22
In this paper, CNTs/Ti3C2Tx composite electrode materials are prepared as CEs for DSSCs. Ti3C2Tx is added into CNTs pastes to further improve the catalytic performance of CNTs, and synergize with CNTs to improve photovoltaic performance. By optimizing the content ratio, agglomeration and repetitive stacking between Ti3C2Tx MXene layers can be avoided, so more catalytic active sites can be obtained to improve the catalytic activity of the electrode materials. A series of electrochemical tests such as cyclic voltammetry (CV), electrochemical impedance spectroscopy (EIS) and Tafel curves can confirm that the addition of Ti3C2Tx to CNTs pastes improves the electrocatalytic and conductivity of the composite electrode. Under the optimal conditions, the PCE of C/T-1.0 wt% CE-based DSSC under 100 mW cm−2 (AM 1.5) irradiation reaches 5.83%, which is higher than that of CNTs CE (3.70%) and approximates that of Pt CE (6.61%). This suggests that CNTs/Ti3C2Tx CE can be an efficient CE material for replacing Pt CE for utilization in DSSCs.
2. Materials and methods
2.1. Materials
Ti3AlC2 MAX (400 mesh) was purchased from Jilin 11 Technology Co. Lithium fluoride (LiF, >98%), P25 titanium dioxide (P25 TiO2, >99%), hydroxypropyl cellulose (EC, >99%), iodine (I2, >99%), lithium iodide (LiI, >98%) were purchased from Shanghai Aladdin Company. Hydrochloric acid (12 M) and anhydrous ethanol were purchased from Kokusai Chemical Group. The dye Z907 was purchased from SOLARONIX, Switzerland. CNTs pastes were purchased from Xianfeng Nano Material Technology Co., Ltd, Nanjing, China. All materials and reagents were without further purification.
2.2. Synthesis of Ti3C2Tx MXene nanosheets
Similar to previous work,23 Ti3C2Tx MXene was prepared by etching Ti3AlC2 powder (400 mesh) in 12 M LiF/9 M HCl solution at room temperature. The mixture was then stirred for 24 hours. Then it was filtered and washed with deionized (DI) water for several times until the pH of the supernatant reached about 6. Finally, the sample was dried in a vacuum at 60 °C for 12 h.
2.3. CNTs/Ti3C2Tx CE preparation
Ti3C2Tx MXene was added into CNTs pastes in proportions (0, 0.5, 1.0 and 2.0 wt%). The CNTs/Ti3C2Tx pastes were then stirred and mixed overnight to allow for thorough mixing. The films were prepared by using the doctor-blade technique and then dried under vacuum at 100 °C for 10 min.
2.4. DSSCs preparation
The FTO substrates were cleaned with detergent, ethanol and isopropanol, and sonicated for 30 min per step. Porous TiO2 films were prepared from P25 TiO2 (17.4 wt%), polyethylene glycol 20 000 (8.7 wt%), hydroxypropyl cellulose (4.3 wt%) and DI water. The porous layer TiO2 films were prepared by using doctor-blading TiO2 pastes onto the FTO and sintering at 500 °C in the air for 30 min at an elevated temperature rate of 5 °C min−1. The compact layer TiO2 layer was prepared by soaking the porous TiO2 layer in a 10 mM TiCl4 solution at 70 °C for 60 min, and then sintered under the same conditions as the previous step. The prepared films were then dipped in 0.3 mM Z907 (acetonitrile : tert-butanol = 1 : 1, v/v) for 24 h. The films were then washed with anhydrous ethanol and blown dry. The iodine-based electrolyte was prepared from a propylene carbonate solution of 0.5 M LiI, 0.05 I2, 0.1 M EMII, and 0.5 M 4-TBP.
2.5. Characterization
X-ray diffraction (XRD) patterns were collected at room temperature on a Bruker D8 X-ray diffractometer by Cu Kα radiation (λ = 1.5418 Å) recorded in 0.02° steps (2θ) every 0.2 s. The morphology and elemental distribution of the powders were analyzed by using a scanning electron microscope (SEM, Regulus 8100) and X-ray energy dispersive spectroscopy (EDS, Bruker XFlash 6|60). X-ray photoelectron spectroscopy (XPS, Thermo Scientific NEXSA) was utilized to study the internal valence structure of Ti3C2Tx MXenes. The Fourier transform infrared spectroscopy (FTIR) was still obtained by the VERTEX 70, Bruker. In this experiment, EIS, Tafel polarization test, CV test, and photovoltaic performance test were performed by using CH Instruments electrochemical workstation (CHI760E). EIS and Tafel were performed on symmetric CE cells under dark conditions. CV tests were performed under a three-electrode system. The current density–voltage (J–V) characteristics of solar cells were measured using a computer-controlled Keithley 2400 source meter measurement system with an AM 1.5G filter at an illumination intensity of 100 mW cm−2, as calibrated using a reference monocrystalline silicon solar cell (91150 V Oriel Instruments). A Crowntech QTest Station 1000 CE equipped with a xenon arc lamp, filter wheel, and monochromator was used to test the external quantum efficiency (EQE) of the DSSCs.
3. Results and discussion
3.1. Structure and morphology
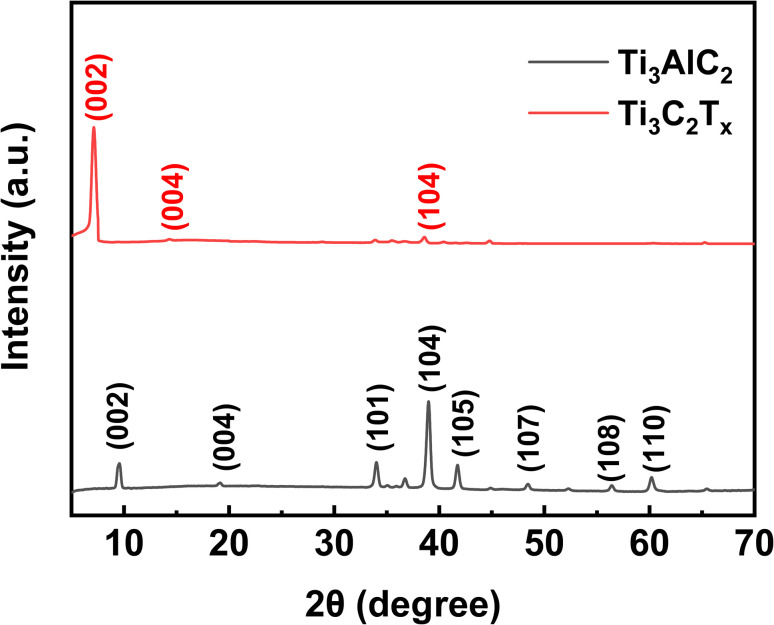
A powder XRD can analyze the crystallinity of Ti3C2Tx MXene. As shown in Fig. 1, the strongest peak of Ti3AlC2 after HCl/LiF etching, 38.9°, which corresponds to the (104) crystallographic plane, has almost completely disappeared. This is strong evidence of the successful transformation of the Ti3AlC2 MAX phase to Ti3C2Tx MXene.22–24 In addition, the disappearance of the Al layer on etching shifts (002) and (004) from 9.5° and 19.1° to a lower 7.1° and 14.3°, respectively. This indicates that the Ti3C2Tx MXene has a wider layer spacing.25
Fig. 1. XRD of Ti3AlC2 powder and Ti3C2Tx powder.
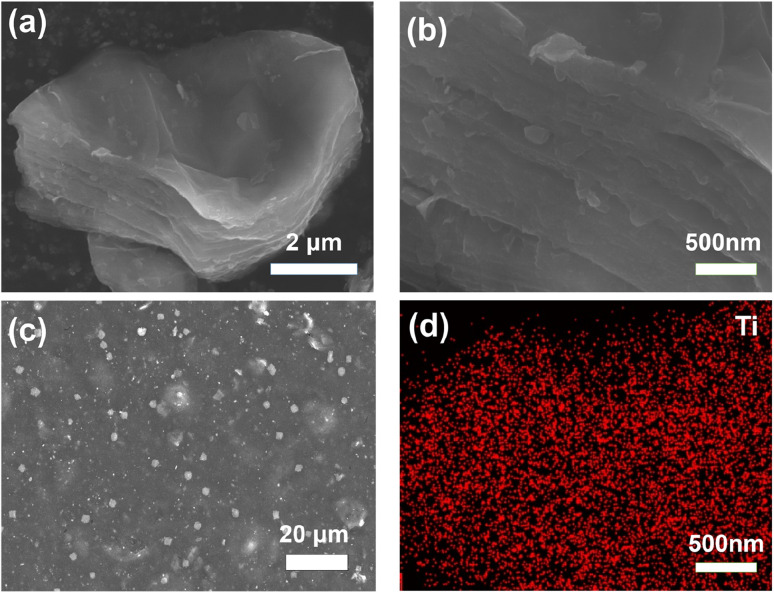
The different morphologies of Ti3C2Tx MXene powder and C/T-1.0 wt% CE are observed by SEM. As shown in Fig. 2(a) and (b), the generated multilayer Ti3C2Tx MXene might be attributed to selective etching to remove the excess Al atomic layer from the MAX phase. This multilayer structure with an open framework can provide a more efficient site for I− and I3− interconversion. As shown in Fig. 2(c), the granular Ti3C2Tx MXene can be found among the CNTs. After zooming in, it should be noticed that there are only CNTs around the Ti3C2Tx, and no inhomogeneous accumulation of Ti3C2Tx MXene can be found (Fig. S1†). The appropriate ratio of Ti3C2Tx MXene avoids inhomogeneous accumulation and increases the number of catalytic active sites and the heterojunction, which ensures that the catalytic efficiency and the electrons can be transferred in time. In addition, the Ti element of Ti3C2Tx MXene was analyzed in Fig. 2(d) using EDS and found to be uniformly distributed on the Ti3C2Tx MXene nanosheets.
Fig. 2. (a and b) Ti3C2Tx MXenes, (c) C/T-1.0 wt% CE surface distribution, (d) EDS-Ti of (a).
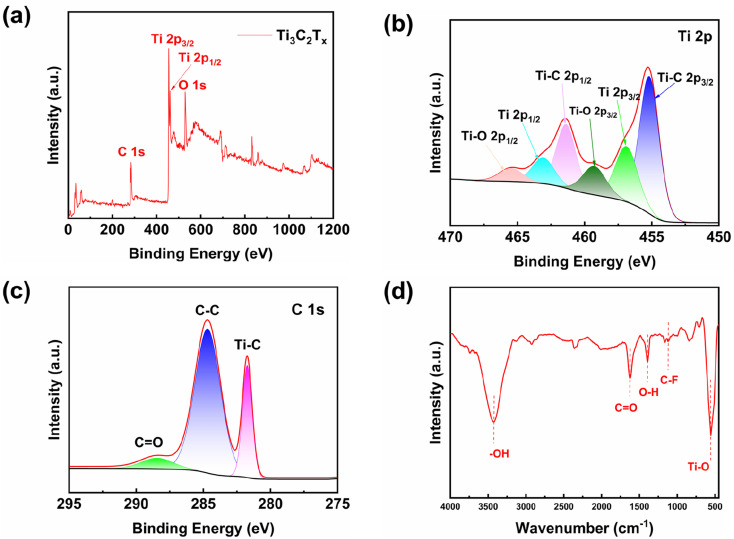
XPS is investigated to confirm the internal elemental and chemical valence states of Ti3C2Tx MXene. The survey spectra and the high-resolution XPS spectra of Ti 2p, O 1s and C 1s are shown in Fig. 3(a)–(c), where the peak with a binding energy of 284.6 eV is the standard energy. The O 1s signal peaks are from the –O and –OH groups on the Ti3C2Tx MXene.19,22 Six peaks, Ti–C 2p3/2 (455.2 eV), Ti 2p3/2 (456.9 eV), Ti–O 2p3/2 (459.3 eV), Ti–C 2p1/2 (461.4 eV), Ti 2p1/2 (463.1 eV) and Ti–O 2p1/2 (465.5 eV),25–28 are present in the Ti 2p curve as shown in Fig. 3(b). The Ti–O bonds is originated from the presence of oxygen-containing groups on the surface of Ti3C2Tx MXene.29 Moreover, the existence of Ti3+ 2p1/2 and Ti3+ 2p3/2 peaks indicates that Ti3C2Tx MXene has not been oxidized; otherwise, the peaks from Ti3+ in Ti3C2Tx will disappear in Ti 2p high-resolution spectrum.30 The high-resolution spectrum of C 1s peaks consists of three peaks at 284.68 eV, 281.37 eV, and 288.43 eV, which correspond to C–C bond, C–Ti bond, and C O bond, respectively.31,32 Obviously, the C–Ti bond originated from Ti3C2Tx MXene.
Fig. 3. (a) Ti3C2Tx MXene total energy spectrum, (b) Ti 2p energy spectrum, (c) C 1s energy spectrum, (d) FTIR spectra of Ti3C2Tx MXene.
FTIR analysis is carried out to further investigate the surface groups of the prepared samples. As shown in Fig. 3(d), it can be seen from the FTIR curve of Ti3C2Tx MXene that the characteristic peaks are located at 3425 cm−1 for asymmetric stretch of –OH,33 1621 cm−1 for C O bonds, 1392 cm−1 for tensile vibrations of O–H, 1106 cm−1 for C–F bonds and 555 cm−1 for Ti–O bonds.34,35 The above results indicate the existence of –O, –OH, and –F functional groups on the surface of Ti3C2Tx MXene. Ti3C2Tx MXene materials prepared by the HCl/LiF method show a significant decrease in –F groups compared with Ti3C2Tx MXene materials produced by direct HF etching. The HCl/LiF synthesis conditions result in a low concentration of –F groups and a high concentration of –O groups.36–38 According to previous literature, the presence of more –O terminals in Ti3C2Tx MXene is beneficial to improve electrochemical performance.39–41
3.2. Electrochemical performance of the CEs
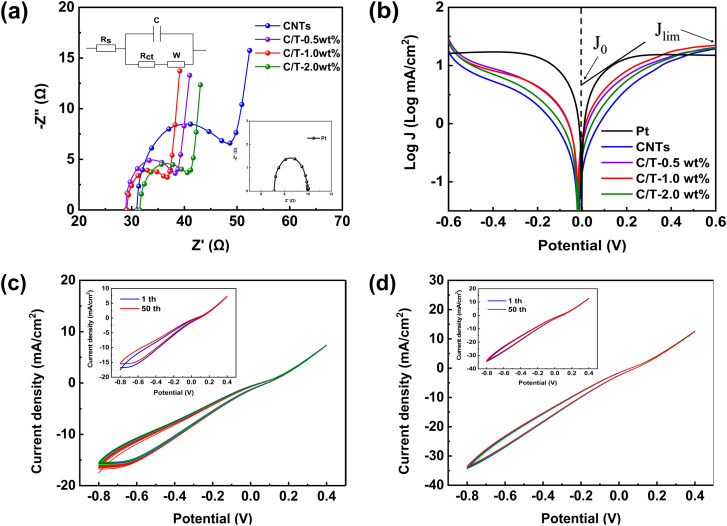
To investigate the electrochemical performance of CEs, EIS and Tafel polarization tests are conducted with symmetric dummy cells with two symmetric CEs facing each other (CE/electrolyte/CE). As shown in Fig. 4(a), Nyquist plots of Pt, CNTs, and various C/T CEs are carried out under dark conditions. The equivalent circuit model is also shown inset of Fig. 4(a). The parameters for comparing the electrochemical activity of different CEs in Table 1 contain the series resistance (Rs) and the charge transfer resistance (Rct). Rct is an important parameter that reflects the charge transfer resistance between the electrode surface and the electrolyte. Therefore, it can be used to evaluate the catalytic activity performance and charge transfer performance of the electrode surface. The lower Rct value indicates that CE has higher electrocatalytic activity and charge transfer capability towards the electrolyte.42–46 The measurement and analysis of Rct can provide an important reference for the fields of CE materials, electrochemical sensors,47–49 and catalysts.50,51 From the results, it can be found that the addition of Ti3C2Tx has a significant effect on the EIS of CEs. When the Ti3C2Tx addition is 1.0 wt%, the C/T-1.0 wt% exhibits a value of Rct of only 6.64 Ω, which is much lower than the CNTs CE (14.39 Ω) and close to the performance of Pt CE (2.85 Ω). The smaller Rct tends to improve the photovoltaic performance, especially the short-circuit current density (Jsc). This is confirmed by the increased Jsc (13.57 mA cm−2) in the J–V results for DSSC based on C/T-1.0 wt% (Table 2). This suggests that the 1.0 wt% of Ti3C2Tx can provide more active sites for redox reactions in iodine-based electrolytes and that good electrical conductivity can accelerate the rate of electron transfer between the CE and the electrolyte.52
Fig. 4. (a) Nyquist plots of the Pt, CNTs, and various C/T CEs symmetric dummy cells and (b) Tafel curves of the symmetric dummy cells, (c) 50 cycles CV for CNTs CE and (d) C/T-1.0 wt% CE.
Electrochemical parameters of symmetric dummy cells.
| CE | R s (Ω) | R ct (Ω) | J 0 (mA cm−2) | J lim (mA cm−2) |
|---|---|---|---|---|
| Pt | 7.10 | 2.85 | 5.25 | 15.14 |
| CNTs | 30.97 | 14.39 | 0.78 | 19.50 |
| C/T-0.5 wt% | 28.87 | 8.74 | 2.10 | 20.42 |
| C/T-1.0 wt% | 29.07 | 6.64 | 2.74 | 22.39 |
| C/T-2.0 wt% | 31.54 | 7.76 | 1.35 | 20.41 |
DSSCs photovoltaic parameters.
| CE | J sc (mA cm−2) | V oc (V) | FF (%) | PCE (%) |
|---|---|---|---|---|
| Pt | 14.92 | 0.71 | 62.55 | 6.61 |
| CNTs | 9.43 | 0.73 | 53.62 | 3.70 |
| C/T-0.5 wt% | 11.24 | 0.71 | 61.72 | 4.96 |
| C/T-1.0 wt% | 13.57 | 0.71 | 60.21 | 5.83 |
| C/T-2.0 wt% | 12.55 | 0.72 | 60.52 | 5.45 |
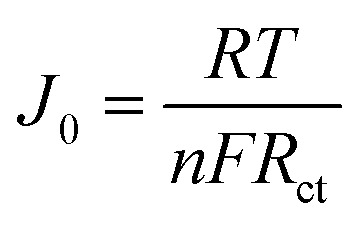
Tafel polarization curve is also a useful method for analyzing electrochemical properties. Fig. 4(b) shows the results of Tafel tests performed on different CEs. The Tafel curve has two important parameters, which are the exchange current density (J0) and the ultimate diffusion current density (Jlim). Larger values of both parameters indicate better catalytic activity and faster rate of electron diffusion.53–57 From Fig. 4(b) and Table 1, C/T-1.0 wt% CE has a larger J0 and Jlim in the Tafel and diffusion regions, which are 2.74 (mA cm−2) and 22.39 (mA cm−2) respectively, and its electrocatalytic activity is higher than that of CNTs CE and other contents of C/T CEs. The increased catalytic activity is attributed to the combination of the active site provided by the unique two-dimensional structure of Ti3C2Tx and the fast electron transport channel. Furthermore, the formula for J0 in eqn (1) is found to be inversely proportional to Rct, which corroborates with the above EIS results.
 |
1 |
where R is the gas constant, T is the temperature in kelvin, n is the number of electrons and F is the Faraday constant.
To further investigate the electrocatalytic activity and stability of the different CEs, CV tests are performed with 50 turns and a sweep rate of 100 mV s−1 as shown in Fig. 4(c) and (d). The peak current density and curve shape of the C/T-1.0 wt% CE remain almost unchanged after 50 consecutive sweeps. In addition, the current density of C/T-1.0 wt% CE is higher than that of CNTs CE, which demonstrates its good electrochemical performance. Meanwhile, the path of the CV curve has not changed after 50 cycles, demonstrating its good electrochemical stability in iodine-based electrolytes. To sum up, the addition of Ti3C2Tx to CNTs not only increases the electrocatalytic properties but also improves the electrochemical stability.58
To further investigate the electrochemical catalytic activity of various CEs in DSSCs, the EIS of DSSCs fabricated with the Pt, CNTs, and various C/T CEs are carried out and the results are displayed in Fig. S2 and Table S1.† The high-frequency intercept on the real axis represents the Rs. The semicircle at the high-frequency region corresponds to the Rct, which represents the resistance at the electrode/electrolyte interface. The Rct has some effects on cell performance. The smaller the Rct, the better the cell performance is.59 The C/T-1.0 wt%-based DSSC has a smaller Rct of 18.04 Ω than that of other C/T CEs, and approximates the 17.98 Ω of the Pt-based DSSC. This further demonstrates that C/T-1.0 wt% CE has a better catalytic activity and electron transport capacity. And this result is consistent with the results of solar cells' performance.
3.3. Photovoltaic performance of DSSC
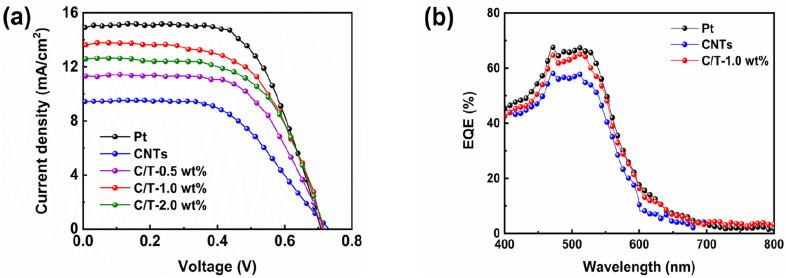
As shown in Fig. 5(a) and Table 2, the photovoltaic performance of various CE-based DSSCs is compared under simulated solar illumination conditions (100 mW cm−2). The DSSCs based on both CNTs CE and CNTs–Ti3C2Tx CE have an open circuit voltage of 0.71 V or higher. This is caused by the adsorption of CNTs in the CE to 4-tert-butylpyridine (4-TBP) in the electrolyte.60 The addition of Ti3C2Tx may affect the adsorption of 4-TBP by CNTs, but this effect did not prevent the enhancement of PCE by Ti3C2Tx. When the DSSC is based on the C/T-1.0 wt% CE, the device has Jsc of 13.57 mA cm−2, Voc of 0.71 V, FF of 0.60 and PCE of 5.83%. These results of DSSC with C/T-1.0 wt% CE outperform CNTs CE (3.70%), C/T-0.5 wt% CE (4.96%), and C/T-2.0 wt% CE (5.45%), and account for about 88.2% of the Pt-based DSSC efficiency (6.61%). The photovoltaic enhancement of DSSCs by CNTs–Ti3C2Tx CE is mainly attributed to the synergistic catalytic ability obtained by the combination of Ti3C2Tx and CNTs, which increases the Jsc and FF values. However, with the increase of Ti3C2Tx amount in CNTs/Ti3C2Tx composites, the Jsc of CNTs/Ti3C2Tx CE devices decreases clearly, which may be due to the excessive accumulation of Ti3C2Tx layer structure, resulting in the decrease of the electrocatalytic activity towards electrolyte.
Fig. 5. (a) J–V plots of DSSCs based on various CEs under simulated solar illumination (AM 1.5, 100 mW cm−2), (b) EQE of DSSCs with different CEs.
To further study the photovoltaic performance of the DSSCs, the EQE of the DSSCs with Pt CE, CNTs CE, and C/T-1.0 wt% CE are shown in Fig. 5(b). These DSSCs have the same spectral response range because the same dyes are used. The C/T-1.0 wt% CE reaches the highest point of 65% at 510 nm, which is higher than that of DSSC based on CNTs. The above improvement in photovoltaic performance can be attributed to a combination of abundant active sites, excellent charge transfer capability, and superior electrocatalytic activity of C/T-1.0 wt% CE.
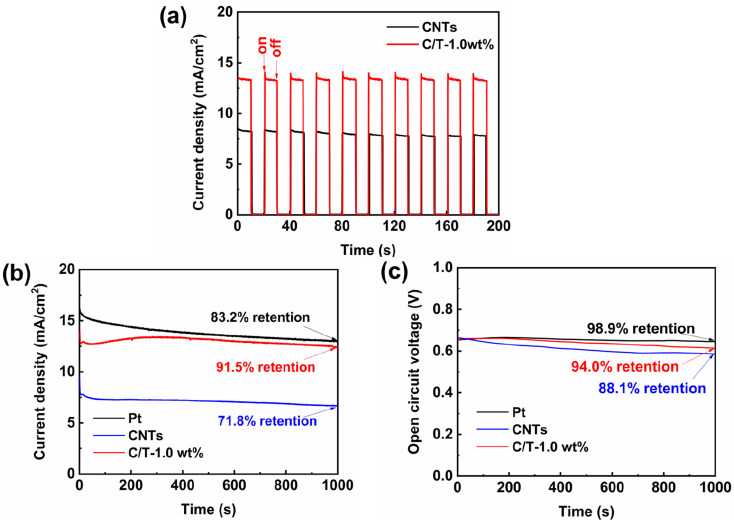
When DSSCs are applied to practical photovoltaic devices, the fast response and multiple start/stop cycles of DSSCs are important performance criteria.19,58 The photocurrent response is analyzed by the time–current method under the simulated light for a total time of 200 s as shown in Fig. 6(a). Under sudden light illumination, C/T-1.0 wt% CE rapidly produces a photocurrent density, which demonstrates that the addition of Ti3C2Tx can improve the photocurrent response. This is attributed to the high electron transport kinetics of the electron within the CE and the low electron recombination kinetics of the electron–hole pairs.58 After ten on/off test cycles, the C/T-1.0 wt% CE-based DSSC still has a good photocurrent reaction.
Fig. 6. (a) On–off test, (b) current density, and (c) open-circuit potential as functions of time for the DSSC.
3.4. Stability of the DSSCs using the composite CEs
The photocurrent density versus time (I–t) and open circuit voltage versus time (V–t) of different CEs are tested to verify the stability of the DSSCs without applying bias and with simulated solar illumination for 1000 s. As shown in Fig. 6(b), at first, all current densities decrease with time. This might be due to the evaporation of the electrolyte because all DSSCs are assembled under an open system without any sealing. In addition, under continuous simulated illumination, the current density of C/T-1.0 wt% CE-based device first decreases, then increases, and finally stabilizes. This is attributed to the fact that the film thickness of both CEs is greater than that of Pt CE, which increases the diffusion length and takes longer to stabilize.61 In addition, the DSSC based on C/T-1.0 wt% CE exhibits good stability with a current density retention of about 91.5% after 1000 s of simulated solar irradiation, which is higher than that of Pt CE (83.2%) and CNTs CE (71.8%). As shown in Fig. 6(c), the open-circuit voltage retention of 94% for the DSSC with C/T-1.0 wt% CE is slightly lower than that of the Pt CE (98.9%) but higher than that of the CNTs CE (88.1%). The high stability of DSSC based on C/T-1.0 wt% CE is attributed to the three-dimensional structure of Ti3C2Tx that facilitates electrolyte diffusion and electron transport, as well as its good chemical durability.58
4. Conclusions
In conclusion, CNTs–Ti3C2Tx composite electrode material is successfully prepared in this work. C/T-1.0 wt% CE shows good electrocatalytic activity and low Rct for the I−/I3− redox reaction by EIS test Tafel curve and CV curve. The DSSC based on C/T-1.0 wt% CE achieves a PCE of 5.83% under the standard illumination of 100 mW cm−2, clearly higher than CNTs CE (3.70%), and slightly lower than Pt CE (6.61%). The enhanced electrochemical and photovoltaic properties are mainly attributed to the highly conductive Ti3C2Tx MXene with a multilayer structure. Its unique structure can provide more catalytic active sites for the electrolyte and improve the conductivity of electrodes. Furthermore, C/T-1.0 wt% CE-based DSSC shows good photostability under continuous light exposure for 1000 s. Therefore, the overall findings indicate that CNTs/Ti3C2Tx is a possible CE to replace Pt CE in DSSC.
Author contributions
Zishan Hu: data curation, formal analysis, methodology, investigation, writing – original draft; Yuanlin Li: investigation, writing – original draft; Aijun Li: supervision, writing – review & editing; Hai-Hua Wang: supervision, writing – review & editing; Xiao-Feng Wang: conceptualization, funding acquisition, supervision, writing – review & editing.
Conflicts of interest
The authors declare that they have no known competing financial interests or personal relationships that could have appeared to influence the work reported in this paper.
Supplementary Material
Acknowledgments
This work was supported by the National Natural Science Foundation of China (X.-F. W. No. 11974129 and X.-F. W. No. 62274075), the Natural Science Foundation of Chongqing, China (CSTB2023NSCQ-MSX0460) and the Fundamental Research Funds for the Central Universities.
Electronic supplementary information (ESI) available. See DOI: https://doi.org/10.1039/d3ra06814e
References
- Mahapatra A. Kumar S. Kumar P. Pradhan B. Mater. Today Chem. 2022;23:100686–100721. [Google Scholar]
- Bi E. Chen H. Yang X. Peng X. Grätzel M. Han L. Energy Environ. Sci. 2014;7:2637–2641. [Google Scholar]
- Xu C. Jiang Y. Yang J. Wu W. Qian X. Hou L. Chem. Eng. J. 2018;343:86–94. [Google Scholar]
- Guo M. Tang B. Zhang H. Yin S. Jiang W. Zhang Y. Li M. Wang H. Jiao L. Chem. Commun. 2014;50:7356–7358. doi: 10.1039/c4cc03221g. [DOI] [PubMed] [Google Scholar]
- Richhariya G. Kumar A. Tekasakul P. Gupta B. Renewable Sustainable Energy Rev. 2017;69:705–718. [Google Scholar]
- Thomas S. Deepak T.-G. Anjusree G.-S. Arun T.-A. Nair S.-V. Nair A.-S. J. Mater. Chem. A. 2014;2:4474–4490. [Google Scholar]
- Wang X. Zhao B. Kan W. Xie Y. Pan K. Adv. Mater. Interfaces. 2022;9:2101229–2101249. [Google Scholar]
- Tomar N. Dhaka V.-S. Surolia P.-K. Mater. Today: Proc. 2021;43:2975–2978. [Google Scholar]
- Wu M. Sun M. Zhou H. Ma J. Ma T. Adv. Funct. Mater. 2020;30:1906451. [Google Scholar]
- Suzuki K. Yamaguchi M. Kumagai M. Yanagida S. Chem. Lett. 2003;32:28–29. [Google Scholar]
- Huang S. Yang Z. Zhang L. He R. Cai Z. Luo Y. Lin H. Cao H. Zhu X. Peng H. J. Mater. Chem. 2012;22:16833–16838. [Google Scholar]
- Ali A. Shehzad K. Ur-Rahman F. Shah S.-M. Khurram M. Mumtaz M. Sagar R.-U. ACS Appl. Mater. Interfaces. 2016;8:25353–25360. doi: 10.1021/acsami.6b08826. [DOI] [PubMed] [Google Scholar]
- Leu Y.-A. Yeh M.-H. Lin L.-Y. Li T.-J. Chang L.-Y. Shen S.-Y. Li Y.-S. Chen G.-L. Chiang W.-H. Lin J.-J. Ho K.-C. ACS Sustainable Chem. Eng. 2017;5:537–546. [Google Scholar]
- Yun D.-J. Ra H. Kim J.-M. Oh E. Lee J. Jeong M.-H. Jeong Y.-J. Yang H. Jang J. Org. Electron. 2019;65:349–356. [Google Scholar]
- Xiao X. Wang H. Urbankowski P. Gogotsi Y. Chem. Soc. Rev. 2018;47:8744–8765. doi: 10.1039/c8cs00649k. [DOI] [PubMed] [Google Scholar]
- Wu M. Lin Y.-N. Guo H. Li W. Wang Y. Lin X. Nano Energy. 2015;11:540–549. [Google Scholar]
- Gao X. Du X. Mathis T.-S. Zhang M. Wang X. Shui J. Gogotsi Y. Xu M. Nat. Commun. 2020;11:6160–6169. doi: 10.1038/s41467-020-19992-3. [DOI] [PMC free article] [PubMed] [Google Scholar]
- Jun B.-M. Kim S. Heo J. Park C.-M. Her N. Jang M. Huang Y. Han J. Yoon Y. Nano Res. 2019;12:471–487. [Google Scholar]
- Chen X. Zhuang Y. Shen Q. Cao X. Yang W. Yang P. Sol. Energy. 2021;226:236–244. [Google Scholar]
- Tian Z. Qi Z. Yang Y. Yan H. Chen Q. Zhong Q. Inorg. Chem. Front. 2020;7:3727–3734. [Google Scholar]
- Nagalingam S.-P. Grace A.-N. Mater. Today Chem. 2020;26:101113–101124. [Google Scholar]
- He Y. Shen Z. Yue G. Gao Y. Huo J. Dong C. Mao Y. Tan F. J. Alloys Compd. 2022;922:166279–166291. [Google Scholar]
- Yang L. Dall'Agnese C. Dall'Agnese Y. Chen G. Gao Y. Sanehira Y. Jena A. Wang X.-F. Gogotsi Y. Miyasaka T. Adv. Funct. Mater. 2019;29:1905694–1905702. [Google Scholar]
- Yang L. Dall'Agnese Y. Hantanasirisakul K. Shuck C.-E. Maleski K. Alhabeb M. Chen G. Gao Y. Sanehira Y. Jena A. Shen L. Dall'Agnese C. Wang X.-F. Gogotsi Y. Miyasaka T. J. Mater. Chem. A. 2019;7:5635–5642. [Google Scholar]
- Zhao S. Zhang H.-B. Luo J.-Q. Wang Q.-W. Xu B. Hong S. Yu Z.-Z. ACS Nano. 2018;12:11193–11202. doi: 10.1021/acsnano.8b05739. [DOI] [PubMed] [Google Scholar]
- Li N. Zhang Y. Jia M. Lv X. Li X. Li R. Ding X. Zheng Y.-Z. Tao X. Electrochim. Acta. 2019;326:134976–134985. [Google Scholar]
- Li H. Hou Y. Wang F. Lohe M. R. Zhuang X. Niu L. Feng X. Adv. Energy Mater. 2017;7:1601847–1601853. [Google Scholar]
- Yang L. Kan D. Dall'Agnese C. Dall'Agnese Y. Wang B. Jena A.-K. Wei Y. Chen G. Wang X.-F. Gogotsi Y. Miyasaka T. J. Mater. Chem. A. 2021;9:5016–5025. [Google Scholar]
- Zhao L. Dong B.-L. Li S.-Z. Zhou L.-J. Lai L.-F. Wang Z.-W. Zhao S.-L. Han M. Gao K. Lu M. Xie X.-J. Chen B. Liu Z. Zhang H. Li H. Zhang H. Huang H. Huang W. ACS Nano. 2017;11:5800–5807. doi: 10.1021/acsnano.7b01409. [DOI] [PubMed] [Google Scholar]
- Wu X. Wang Z. Yu M. Xiu L. Qiu J. Adv. Mater. 2017;29:1607017–1607025. doi: 10.1002/adma.201607017. [DOI] [PubMed] [Google Scholar]
- Xiu L. Y. Wang Z. Y. Yu M. Z. Wu X. H. Qiu J. S. ACS Nano. 2018;12:8017–8028. doi: 10.1021/acsnano.8b02849. [DOI] [PubMed] [Google Scholar]
- Xu C. Zhao X. Sun M. Ma J. Wu M. Electrochim. Acta. 2021;392:138983–138991. [Google Scholar]
- Xiu L. Wang Z. Yu M. Wu X. Qiu J. ACS Nano. 2018;12:8017–8028. doi: 10.1021/acsnano.8b02849. [DOI] [PubMed] [Google Scholar]
- Xue Q. Zhang H. Zhu M. Pei Z. Li H. Wang Z. Huang Y. Huang Y. Deng Q. Zhou J. Du S. Huang Q. Zhi C. Adv. Mater. 2017;29:1604847–1604852. [Google Scholar]
- Wei Y. Luo W. Zhuang Z. Bai D. Ding J. Li T. Ma M. Yin X. Ma Y. Adv. Compos. Hybrid Mater. 2021;4:1082–1091. [Google Scholar]
- Hope M. A. Forse A. C. Griffith K. J. Lukatskaya M. R. Ghidiu M. Gogotsi Y. Grey C. P. Phys. Chem. Chem. Phys. 2016;18:5099–5102. doi: 10.1039/c6cp00330c. [DOI] [PubMed] [Google Scholar]
- Zhang Y. Z. Lee K. H. Anjum D. H. Sougrat R. Jiang Q. Kim H. Alshareefit H. N. Sci. Adv. 2018;4:0098–0105. doi: 10.1126/sciadv.aat0098. [DOI] [PMC free article] [PubMed] [Google Scholar]
- Wang M. Feng S. Bai C. Ji K. Zhang J. Wang S. Lu Y. Kong D. Small. 2023;19:00386–00394. doi: 10.1002/smll.202300386. [DOI] [PubMed] [Google Scholar]
- Gong S. Zhao F. Zhang Y. Xu H. Li M. Qi J. Wang H. Wang Z. Hu Y. Fan X. Peng W. Li C. Liu J. J. Colloid Interface Sci. 2023;632:216–222. doi: 10.1016/j.jcis.2022.11.063. [DOI] [PubMed] [Google Scholar]
- Chen X. Zhu Y. Zhang M. Sui J. Peng W. Li Y. Zhang G. L. Zhang F. Fan X. ACS Nano. 2019;13:9449–9456. doi: 10.1021/acsnano.9b04301. [DOI] [PubMed] [Google Scholar]
- Zou G. Sun J. Fan Z. Jin J. Li C. Cai J. Wei C. Shao Y. ACS Nano. 2021;15:3098–3107. doi: 10.1021/acsnano.0c09646. [DOI] [PubMed] [Google Scholar]
- Gondane V. Bhargava P. Electrochim. Acta. 2016;209:293–298. [Google Scholar]
- Yen M.-Y. Hsieh C.-K. Teng C.-C. Hsiao M.-C. Liu P.-I. Ma C.-C. Tsai M.-C. Tsai C.-H. Lin Y.-R. Chou T.-Y. RSC Adv. 2012;2:2725–2728. [Google Scholar]
- Lou S. Guo X.-M. Fan T.-X. Zhang D. Energy Environ. Sci. 2012;5:9195–9216. [Google Scholar]
- Yang N.-L. Zhai J. Wang D. Chen Y. Jiang L. ACS Nano. 2010;4:887–894. doi: 10.1021/nn901660v. [DOI] [PubMed] [Google Scholar]
- Guo M. Xie K.-Y. Lin J. Yong Z. Yip C.-T. Zhou L. Wang Y. Huang H. Energy Environ. Sci. 2012;5:9881–9888. [Google Scholar]
- Wan C. Qu A. Deng L. Xiang L. Wu C. Environ. Sci. Pollut. Res. 2023;30:7904–7913. doi: 10.1007/s11356-022-22787-2. [DOI] [PubMed] [Google Scholar]
- Umesh N. M. Jesila J. A. Wang S.-F. Govindasamy M. Alshgari R.-A. Ouladsmane M. Asharani I. V. Microchem. J. 2021;167:106244–106254. [Google Scholar]
- Ambaye A. Kebede T. Ntsendwana B. Nxumalo E. Synth. Met. 2023;299:117452–117467. [Google Scholar]
- Chu C. Tang J. Zhao Z. Kong Y. Shen X. Materials. 2022;15:8380–8809. doi: 10.3390/ma15238380. [DOI] [PMC free article] [PubMed] [Google Scholar]
- Liang B. Su M. Zhao Z. He H. Lin S. Liang S.-X. Electrochim. Acta. 2023;462:142779–142788. [Google Scholar]
- Zhang J. Kong N. Uzun S. Levitt A. Seyedin S. Qin S. Han M. Yang W. Liu J. Wang X. Gogotsi Y. Adv. Mater. 2020;32:2001093–2001102. doi: 10.1002/adma.202001093. [DOI] [PubMed] [Google Scholar]
- Du C. Yang L. Yang F.-L. Cheng G. Luo W. ACS Catal. 2017;7:4131–4137. [Google Scholar]
- Tan Y. Wang H. Liu P. Shen Y. Cheng C. Hirata A. Fujita T. Tang Z. Chen M. Energy Environ. Sci. 2016;9:2257–2261. [Google Scholar]
- Zhou L. Shao M.-F. Li J. Jiang S. Wei W. Duan X. Nano Energy. 2017;41:583–590. [Google Scholar]
- Jeong H. Kim J.-Y. Koo B. Son H.-J. Kim D. Ko M.-J. J. Power Sources. 2016;330:104–110. [Google Scholar]
- Gopi C. Venkata-Haritha M. Ravi S. Thulasi-Varma C.-V. Kim S.-K. Kim H.-J. J. Mater. Chem. C. 2015;3:12514–12528. [Google Scholar]
- Akman E. Altintas Y. Gülen M. Yilmaz M. Mutlugün E. Sönmezoğlu S. Renewable energy. 2020;145:2192–2200. [Google Scholar]
- Wang W. Cui Q. Sun D. Yang Q. Xu J. Liao W. Zuo X. Tang H. Li G. Jin S. J. Mater. Chem. C. 2021;9:7046–7056. [Google Scholar]
- Murakami T.-N. Ito S. Wang Q. Nazeeruddin M.-K. Grätzel M. J. Electrochem. Soc. 2006;153:A2255–A2261. [Google Scholar]
- Hou W. Xiao Y. Han G. Zhou H. Electrochim. Acta. 2016;190:720–728. [Google Scholar]
Associated Data
This section collects any data citations, data availability statements, or supplementary materials included in this article.


