Abstract
Three promoter sites (P1, P2, and P3) responsible for the sporulation-associated synthesis of Clostridium perfringens enterotoxin, a common cause of food poisoning in humans and animals, were identified. Nested and internal deletions of the cpe promoter region were made to narrow down the location of promoter elements. To measure the effects of the deletions on the expression of cpe, translational fusions containing the promoter deletions were made with the gusA gene of Escherichia coli, which codes for β-glucuronidase; E. coli-C. perfringens shuttle vectors carrying the fusions were introduced into C. perfringens by electroporation. In addition, in vitro transcription assays were performed with the cpe promoter region as the DNA template for extracts made from sporulating cells. DNA sequences upstream of P1 were similar to consensus SigK-dependent promoters, while P2 and P3 were similar to consensus SigE-dependent promoters. SigE and SigK are sporulation-associated sigma factors known to be active in the mother cell compartment of sporulating cells of Bacillus subtilis, the same compartment in which enterotoxin is synthesized in C. perfringens.
Clostridium perfringens is a common source of food poisoning in humans, being responsible for 10% of the outbreaks of known etiology in the United States alone (17). After ingestion of contaminated food containing vegetative cells, food poisoning symptoms are caused by the production of a potent enterotoxin (CPE) protein made by sporulating cells in the gastrointestinal tract (20). The enterotoxin binds to receptors on the surface of the brush border membranes of intestinal epithelial cells (18, 27). The receptor-CPE complex then seems to form a pore, leading to the loss of solutes and eventual cell death (19).
Sporulation and enterotoxin synthesis are genetically and temporally linked. Duncan (9) performed a kinetic analysis of sporulation and enterotoxin synthesis during the growth and sporulation cycles of C. perfringens NCTC 8798 and showed that entry into the stationary phase (i.e., onset of sporulation) and enterotoxin synthesis are closely linked. In 1972, Duncan et al. (10) provided genetic evidence linking sporulation and CPE synthesis in CPE-positive (CPE+) C. perfringens NCTC 8798. Mutants blocked at stage 0 of sporulation were unable to express CPE, while mutants blocked at stages III, IV, and V continued to do so, although in reduced amounts (10). This pattern of CPE expression indicates that CPE synthesis is dependent on one or more functions that are also needed to reach stage I or II of the sporulation cycle. Electron microscopy and immunological labeling studies of thin sections of sporulating cells indicate that the vast majority of CPE protein is made in the mother cell compartment, rather than in the forespore (24). This result implies compartment-specific regulation of cpe expression. However, CPE synthesis is probably not required to produce a normal spore, since many CPE-negative (CPE−) C. perfringens strains are capable of sporulating (21).
Enterotoxin expression is controlled at the level of transcription during the sporulation cycle (7, 22). When C. perfringens NCTC 10240 was grown in sporulation medium, only very low levels of cpe mRNA and no CPE protein could be detected in the exponential growth phase (0 to 4 h of growth) (22). However, the levels of both cpe mRNA and CPE protein rose rapidly and in synchrony about 1 h after the cells entered the stationary phase, indicating that the increase in CPE expression as cells initiate sporulation results from increased transcription of the cpe gene. In addition, Czeczulin et al. (7), using Northern blot analyses, recently showed that only sporulating cells and not vegetative cells produce the monocistronic, 1.6-kb cpe mRNA, confirming that cpe is regulated at the level of transcription during the sporulation cycle. When several natural CPE− strains of C. perfringens were transformed by electroporation with a C. perfringens-Escherichia coli shuttle vector carrying the cpe gene and ∼0.4 kb of upstream DNA, the synthesis of CPE was still sporulation dependent, indicating that general sporulation-associated factors were responsible for cpe regulation (7).
When the regions immediately upstream of the cpe gene in six CPE+ C. perfringens strains were analyzed, a 45-bp insertion (located about 265 nucleotides upstream of the start of the cpe coding sequence) was detected in three of these strains; this result indicates that there are two populations of upstream regions in cpe+ isolates, designated types A and B (22). Translational fusions made between the E. coli gusA gene (encoding β-glucuronidase [16]) and DNA containing the putative cpe promoter region and N-terminal coding sequence from strains NCTC 8798 (promoter type A) and NCTC 10240 (promoter type B) were cloned in the C. perfringens-E. coli shuttle vector pJIR750 (22). When introduced into strain NCTC 8798 by electroporation, they showed the same pattern of induction as did the direct measurements of cpe mRNA and CPE protein in strain NCTC 10240 (as described above); this result indicates that all of the necessary regulatory elements were present on the promoter regions tested.
Although primer extension analysis identified several apparent mRNA 5′ ends in the cpe promoter region (22), the promoters responsible for sporulation-dependent regulation have not yet been identified. In order to determine if these 5′ ends represent actual promoter elements, we undertook a series of mutational and biochemical analyses of transcription in this region. The results of these studies are reported here.
MATERIALS AND METHODS
Bacterial strains and growth conditions.
All bacterial strains used in this study are listed in Table 1. E. coli strains were cultured in Luria-Bertani medium. C. perfringens strains were grown routinely in PGY medium (22); for experiments involving sporulation, DSSM medium (22) was used. For anaerobic growth on plates, C. perfringens strains were incubated at 37°C in an anaerobic chamber (Coy Laboratory Products, Inc.). Anaerobic medium used to measure cpe-gusA expression in C. perfringens during sporulation was prepared by adding 75 ml of DSSM to 100-ml serum bottles fitted with butyl rubber stoppers. A needle was inserted through the stopper, and the bottles were autoclaved and then allowed to cool to room temperature in the Coy anaerobic chamber. Electroporation of E. coli and C. perfringens strains was carried out as previously described (22).
TABLE 1.
Bacterial strains used in this study
| Strain | Genotype or phenotype | Source or reference |
|---|---|---|
| E. coli | ||
| JM107 | endA1 gyrA96 thi hsdR17 supE44 relA1 λ− Δ(lac-proAB) (F′ traD36 proAB lacIqlacZΔM15) | 29 |
| INVαF′ | F′ endA recA1 hsdR17 (rK− mK+) supE44 thi-1 gyrA96 relA1 φ80lacZΔM15 Δ(lacZYA-argF)U169 λ− | Invitrogen |
| C. perfringens | ||
| NCTC 10240 | CPE+ | C. Duncan |
| NCTC 8798 | CPE+ | C. Duncan |
| SM101 | Derivative of NCTC 8798; high efficiency of electroporation | This study |
Electroporation experiments with C. perfringens NCTC 8798 typically resulted in 8 to 10 transformants per μg of DNA (23). Two chloramphenicol-resistant (Cmr) transformants of strain NCTC 8798 containing the E. coli-C. perfringens shuttle vector pJIR750 were cured of the plasmid by growth in PGY medium lacking chloramphenicol. One of the Cms isolates, strain SM101, was then subjected to electroporation with plasmid pJIR750. It showed a 1,000-fold increase in electroporation efficiency, yielding ∼1 × 10⁴ transformants/μg of DNA. Additionally, this strain showed no other changes in its growth, sporulation, or cpe regulatory characteristics (23).
Plasmid constructs and DNA manipulations.
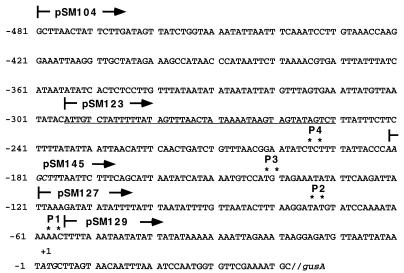
The plasmids used in this study are listed in Table 2. Nested deletions of the NCTC 10240 cpe promoter were made with PCR methods, except for plasmid pSM145 (see below). Primers containing an SphI cleavage site at the 5′ end and primer OSM6, which contains an XbaI cleavage site and anneals to the N-terminal coding region of the cpe structural gene (22), were used to amplify the desired region with pSM100 (NCTC 10240 cpe promoter) as a template. The PCR products were ligated to vector pCRII (Invitrogen Corp.), and the plasmids were then digested with SphI and XbaI. The small fragments containing the deletions in the cpe promoter were ligated to the large fragment of pSM104, which had been digested with SphI and XbaI, thereby replacing the full-length cpe promoter with the deletion constructs fused to gusA. Plasmid pSM145 was made by partial digestion of pSM104 with HindIII. There is a HindIII site in the cpe promoter region at position −183 (Fig. 1), a second HindIII site in the polylinker region upstream of the cpe promoter inserts of pSM104 and pSM105, and a third HindIII site immediately downstream of the gusA gene. After partial digestion with HindIII, self-ligation, and transformation of E. coli, plasmid pSM145 was isolated.
TABLE 2.
Plasmids used in this study
| Plasmid | Parent | Relevant genotype (cpe promoter region present) | Source or reference |
|---|---|---|---|
| pCRII | Invitrogen | ||
| pBS− | Stratagene | ||
| pBluescript SK− | Stratagene | ||
| pSM100 | pBluescript SK− | NCTC 10240 cpe promoter | 22 |
| pSM101 | pBluescript SK− | NCTC 8798 cpe promoter | 22 |
| pJIR750 | J. Rood (2) | ||
| pSM104 | pJIR750 | φ(cpeNCTC 10240-gusA) (−481 to +41) | 22 |
| pSM123 | pSM104 | φ(cpeNCTC 10240-gusA) (−296 to +41) | This study |
| pSM127 | pSM104 | φ(cpeNCTC 10240-gusA) (−121 to +41) | This study |
| pSM129 | pSM104 | φ(cpeNCTC 10240-gusA) (−56 to +41) | This study |
| pSM145 | pSM104 | φ(cpeNCTC 10240-gusA) (−183 to +41) | This study |
| pSM151 | pBS− | cpe terminator region | This study |
| pSM154 | pBS− | NCTC 8798 cpe promoter; in vitro transcription vector | This study |
| pSM155 | pBS− | NCTC 10240 cpe promoter; in vitro transcription vector | This study |
| pSM164 | pSM104 | φ(cpeNCTC 10240-gusA) | This study |
| pSM165 | pSM104 | φ(cpeNCTC 10240-gusA) | This study |
| pSM170 | pSM104 | φ(cpeNCTC 10240-gusA) | This study |
| pSM183 | pSM104 | φ(cpeNCTC 10240-gusA) | This study |
FIG. 1.
Location of cpe promoter constructs (arrows) and putative promoter elements (asterisks) in the NCTC 10240 cpe type B promoter. The numbering is relative to the A of the initiator Met codon (italics) of the cpe structural gene. The HindIII site described in the text is also shown in italics. A 45-bp insertion present in type B cpe promoters but absent in type A promoters is underlined.
Plasmid pSM170 was made in two steps. First, two BglII sites were introduced into pSM104 by sequential PCR mutagenesis (6) at positions −56 to −61 and −122 to −127 (Fig. 1). The resulting double mutant, pSM164, was tested for cpe-gusA expression during sporulation and showed very little difference from that seen with pSM104. After digestion with BglII, the large fragment was self-ligated, yielding pSM165, in which promoter sites P1 and P2 are deleted. Second, pSM165 was subjected to partial HindIII digestion to delete the region upstream of the HindIII site in the cpe promoter (Fig. 1), as described above for pSM145, creating pSM170, in which only the P3 region of the cpe promoter is intact. pSM183 was also made by sequential PCR mutagenesis. After BglII sites were introduced at positions −56 to −61 and −177 to −182, the intervening region was deleted by digestion with BglII and self-ligation. All mutations were confirmed by DNA sequence analysis (26).
Plasmids pSM154 and pSM155, used as templates for in vitro transcription, were made in several steps. First, a PCR product of 129 bp, containing 28 bp upstream of the thymidine in the cpe gene stop codon (TAA) and 100 bp downstream of the stop codon, was made with chromosomal DNA from strain NCTC 8798 and cloned in vector pCRII. This region contains the proposed cpe terminator (8). An EcoRI fragment containing the terminator region was then cloned in the EcoRI site of plasmid pBS− (Stratagene Corp.). A plasmid with the desired orientation, determined by sequencing, was named pSM151. Next, XbaI-PstI fragments containing the cpe promoters from strains NCTC 10240 and NCTC 8798 were cut from plasmids pSM100 and pSM101, respectively, and cloned between the XbaI and PstI sites of the polylinker in plasmid pSM151 to make pSM155 and pSM154, respectively.
Primer extension and β-glucuronidase assays.
For experiments analyzing cpe promoter induction with primer extension, 300 ml of anaerobic DSSM was inoculated with 3 ml of an overnight culture of the appropriate strain. Growth was monitored by measuring the optical density of the culture at 600 nm. At various times, 10 ml of culture was removed, and total RNA was extracted from the sample with Trizol reagent (Gibco/BRL) as described previously (22). Primer extension was then carried out by previously described techniques for C. perfringens mRNA (22).
Measurements of β-glucuronidase activity in C. perfringens cells expressing cpe-gusA fusions were carried out as previously described (22).
In vitro transcription assays.
Extracts from sporulating cells used in in vitro transcription assays were prepared as follows. Five hundred milliliters of anaerobic DSSM in a round-bottom flask was inoculated with 5 ml of an overnight culture of C. perfringens cells grown in PGY medium. Growth in DSSM was monitored by measuring the optical density of the culture at 600 nm. The cells were harvested by centrifugation 1.5 h after entry into the stationary phase (T1.5) and washed once in buffer containing 20 mM NaHPO4 (pH 7.0); the pellet was stored at −80°C. The frozen pellet was thawed and resuspended in buffer A (13), which contained 10 mM Tris-HCl (pH 8.0), 1 mM EDTA, 1 mM dithiothreitol, 400 mg of phenylmethylsulfonyl fluoride per liter, 100 mM KCl, and 10% glycerol. The cells were then disrupted by sonication, and cell debris was removed by centrifugation at 15,000 × g for 10 min at 4°C. The cell extract was then subjected to ultracentrifugation at 100,000 × g for 1 h at 5°C. Solid ammonium sulfate was added to the supernatant from the centrifugation step just to saturation, and the protein precipitate was retrieved by centrifugation. The pellet was then resuspended in 1 to 2 ml of buffer A and dialyzed against 2 liters of buffer A at 4°C. After dialysis, the extracts were stored in 100-μl aliquots at −80°C. Protein was measured with a protein assay kit (Bio-Rad Laboratories).
The in vitro transcription assays were carried out in microcentrifuge tubes with 40-μl volumes containing (13) 40 mM Tris (pH 8.0), 10 mM MgCl2, 1 mM EDTA, 1 mM dithiothreitol, 50 mM KCl, ATP, GTP, and CTP at 125 μM each, 12.5 μM UTP, 12.5 μCi of [α-32P]UTP, 1.5 to 2.2 μg of plasmid template DNA, and 5% glycerol. The reaction was started by the addition of 17 μg of protein from the cell extracts, the reaction mixture was incubated for 10 min at 37°C, and the reaction was stopped by phenol extraction and ethanol precipitation. mRNA was electrophoresed on 5% polyacrylamide–7.5 M urea gels along with RNA Century size markers synthesized according to the manufacturer’s instructions (Ambion, Inc.).
RESULTS
Nested deletions of cpe promoter regions.
In a previous report (22), primer extension experiments with cpe mRNA identified four potential 5′ ends corresponding to mRNAs induced during sporulation. These apparent 5′ termini were at positions −58, −73, −142, and −196 (termed P1, P2, P3, and P4, respectively), relative to the start of translation of the cpe structural gene (Fig. 1). However, RNase T2 protection experiments could only confirm the presence of P1, P2, and P3 (30). We sought to determine whether these 5′ ends represent actual transcription start sites or are processing sites for mRNA originating from a single, upstream promoter. To address this question, we performed a series of deletion mutagenesis experiments with the cpe promoter region.
The locations of a series of nested deletions in the NCTC 10240 (type B) cpe promoters are shown in Fig. 1. Each of the cpe-gusA fusion constructs shown in Fig. 1 was cloned in the C. perfringens-E. coli shuttle vector pJIR750 and used to transform C. perfringens SM101 by electroporation (22). Strain SM101 is a derivative of NCTC 8798 selected for high transformation efficiency (see Materials and Methods). Strain NCTC 10240 cannot be transformed by electroporation (23), so expression from the NCTC 10240 cpe promoter was studied in the heterologous strain, SM101. The transformants were grown in sporulation medium DSSM, and samples were removed for measurements of β-glucuronidase activity during growth and the sporulation cycles as previously described (22).
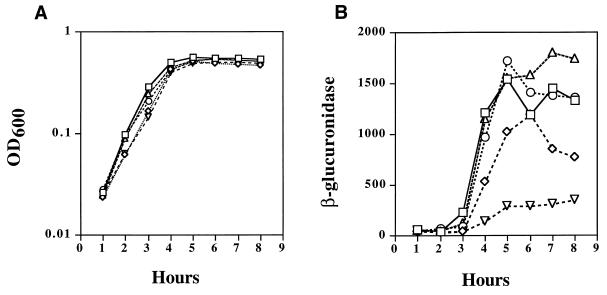
The activities of gusA fusions containing nested deletions of the NCTC 10240 cpe promoter (type B) are shown in Fig. 2. In comparison to the longest cpe construct, pSM104, the nested deletions encompassing the region between pSM104 and pSM127 showed activity levels 80 to 100% that seen with pSM104. However, the level of expression for pSM129, which lacks all the potential transcription start sites, was only 20% the level shown by pSM104 (Fig. 2). With all of these cpe-gusA fusions, the induction of β-glucuronidase activity did not occur until the cells entered the stationary phase, consistent with our previous results (22). These results suggest that most cpe transcription in NCTC 10240 is derived from P1 and P2.
FIG. 2.
Growth (A) and cpe expression (B) of the NCTC 10240 cpe-gusA fusion constructs shown in Fig. 1 and grown in DSSM sporulation medium. Symbols: □, pSM104; ○, pSM123; ▵, pSM145; ◊, pSM127; ▿, pSM129. OD600, optical density at 600 nm.
Separation of the cpe promoters from strain NCTC 10240.
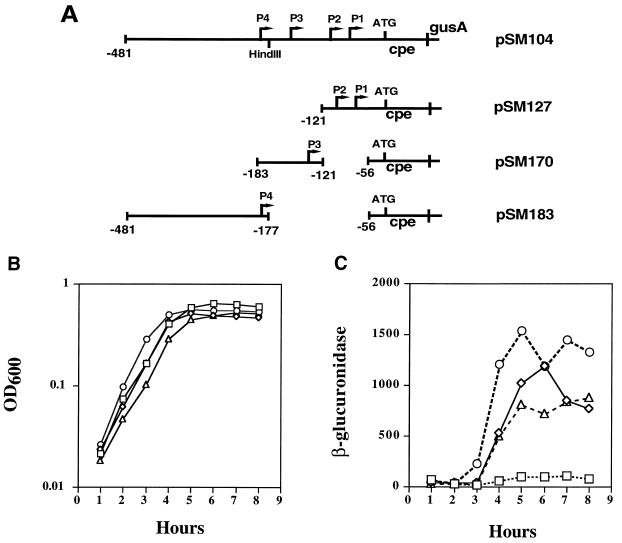
The nested deletion experiments with the cpe promoter region described above are useful for locating a single promoter but are less effective in locating multiple promoter elements that may not have simple, additive levels of expression. In order to determine if P1, P2, P3, and P4 reflect independent promoters, we made deletions in the cpe promoter region to isolate the region corresponding to each potential start site and to test its expression during growth and sporulation. At the present time, we do not have sufficient information to differentiate potential promoters for P1 and P2, since they are separated by only 15 bp and their proposed −10 and −35 elements would overlap to a considerable extent (Fig. 1). Constructs that carry only P3 (pSM170), P4 (pSM183), or P1 and P2 are shown in Fig. 3A. As shown in Fig. 3B and C, the complete promoter region (in pSM104) and pSM127, which contains both P1 and P2 (Fig. 3A), had similar activities. pSM170, containing the P3 promoter alone, exhibited about 50% the stationary-phase-induced expression seen with pSM104. However, the construct containing P4 alone (pSM183) exhibited only ∼7% the level of expression observed during the stationary phase with pSM104. These results indicate that P1 and P2 together provide nearly wild-type levels of expression, while P3 can also function as an independent promoter. The apparent P4 transcription start site is probably an artifact of primer extension.
FIG. 3.
(A) Schematic diagram showing the extent of internal deletions in the NCTC 10240 cpe promoter region. Growth (B) and cpe expression (C) of the NCTC 10240 cpe-gusA fusion constructs shown in Fig. 3A and grown in DSSM sporulation medium. Symbols: ○, pSM104, ◊, pSM127; ▵, pSM170; □, pSM183. OD600, optical density at 600 nm.
Similar results were obtained with nested deletions of the type A cpe promoter from NCTC 8798 (30). In addition, a 1-kb region of DNA upstream of the cpe gene from NCTC 8798 (made by PCR amplification using previously published sequences [5]) fused to gusA resulted in no significant increase in expression from the clone containing only 439 bp (22, 30), indicating there are probably no other promoters upstream of P3.
In vitro transcription of cpe promoters by use of extracts from sporulating cells.
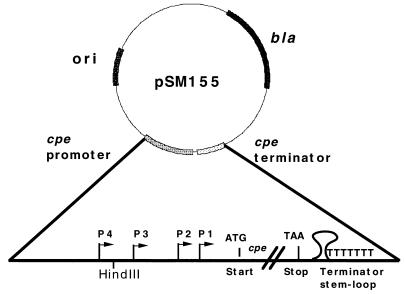
In order to confirm our results from the cpe-gusA fusions, we wished to obtain direct biochemical evidence of transcription from the cpe promoters using extracts from sporulating cells. Presumably, sporulating cell extracts contain all the factors necessary for transcription of the cpe promoters. Previous reports of in vitro transcription assays with purified C. perfringens RNA polymerase and extracts from sporulating cells strongly indicated that linear DNA does not function efficiently as a template when C. perfringens RNA polymerase is used to initiate transcription (13, 22). To overcome this problem, we constructed specialized vectors to use as supercoiled templates for in vitro transcription assays. A schematic diagram illustrating the structures of these vectors is shown in Fig. 4. The relevant parts of the plasmids consist basically of the cpe promoter regions from NCTC 8798 (pSM154) and NCTC 10240 (pSM155) connected by a short polylinker region to the proposed terminator region of the cpe structural gene (8). The terminator region of cpe contains a potential stem-loop structure followed by seven consecutive thymidine residues (8), features common to rho-independent terminators in Clostridium and other bacteria (12–14). The plasmids were designed so that transcription initiating from the cpe promoters will terminate at the run of thymidines downstream of the stem-loop. The length of the transcript can then be used to estimate the point at which transcription was initiated in the cpe promoter region.
FIG. 4.
Schematic diagram showing the relevant features of the plasmids used as DNA templates in in vitro transcription assays.
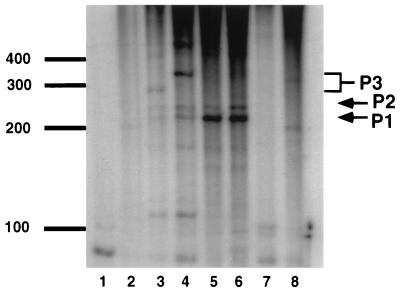
We obtained cell extracts from sporulating cells of strains NCTC 8798 and NCTC 10240 harvested at T1.5 (see Materials and Methods) and used them to perform in vitro transcription assays with pSM154 and pSM155 as templates. The results are shown in Fig. 5. If transcription does terminate at the first thymidine in the run of seven thymidines in the cpe terminator region, we predict that a transcript initiating at P1 should be 228 bases long; those initiating at P2, P3, and P4 should be 243, 317, and 372 bases long, respectively. cpe-specific transcripts of 217 and 240 bases, estimated from the RNA size markers, were seen in Fig. 5, lanes 3 to 6. These corresponded quite well with the predicted sizes of transcripts from P1 and P2. With NCTC 8798 extracts, however, a transcript of 276 bases was observed with pSM154 as a template (Fig. 5, lane 3), but a transcript of 320 bases was seen with pSM155 as a template (lane 4). Since P3 is predicted to be 317 bases long, it most closely matches the upper band in lane 4 (320 bases). No additional transcripts corresponding in length to P3 were seen when NCTC 10240 extracts were used (Fig. 5, lanes 5 and 6), but transcripts longer than 400 bases were seen in these lanes. Transcripts of these lengths could have initiated within the cpe promoter region (Fig. 1). Lanes 3 and 4 of Fig. 5 also contained a band of ∼115 bases. This would be the length expected for a transcript originating from P3 in a region of the cpe mRNA that can potentially form a secondary structure (see below). This result may indicate that termination or mRNA processing occurs in cell extracts.
FIG. 5.
In vitro transcription assays with extracts from sporulating C. perfringens cells. Lanes: 1, 3, 4, and 7, NCTC 8798 extract; 2, 5, 6, and 8, NCTC 10240 extract. Plasmids used were none (lanes 1 and 2), pSM154 (lanes 3 and 5), pSM155 (lanes 4 and 6), and pBS− (lanes 7 and 8). Markers on the left show the migration of RNA Century size markers (bases).
In addition to the complete cpe promoter regions present on pSM154 and pSM155, we cloned the following cpe internal deletion fragments into pSM151 for use as in vitro transcription templates: the cpe promoters from pSM127 (P1 and P2), pSM170 (P3 alone), and pSM183 (P4 alone). However, we could not generate any significant levels of transcription using these plasmids as templates (30), even though the cpe promoters from pSM127 and pSM170 showed significant levels of expression in vivo (Fig. 3). The reason for the differences between the in vivo and in vitro activities is unknown.
Kinetics of induction of transcription from cpe promoters P2 and P3.
The results shown above allowed us to identify three promoter elements in the cpe promoter region (i.e., P1, P2, and P3). In order to determine if these cpe promoters are induced at similar times during the developmental cycle, we wished to determine the kinetics of promoter induction during the stationary phase. We did this by using primer extension analysis of cpe mRNA extracted at different times during the growth and sporulation cycles. However, the use of a primer that annealed near the N terminus of the cpe structural gene consistently gave a very strong termination signal near positions −35 to −37, and the 5′ ends of P1, P2, and P3 could only be detected after long exposure times (22, 30). The 5′ end at positions −35 to −37 may represent an additional promoter downstream of P1 but more likely is due to premature termination of the reverse transcriptase, since it corresponds to the 5′ side of a potential hairpin secondary structure that can form in the cpe mRNA between positions −32 and −55 (30). To overcome the premature termination of the reverse transcriptase, we used a primer (OSM71) that annealed to the downstream half of the putative hairpin structure (from positions −17 to −44) to both inhibit secondary structure formation and act as a primer for the reverse transcriptase. Unfortunately, this primer annealed too closely to P1 (at position −55) for us to be able to resolve it on a polyacrylamide sequencing gel. Therefore, we could only analyze the kinetics of P2, P3, and P4 induction.
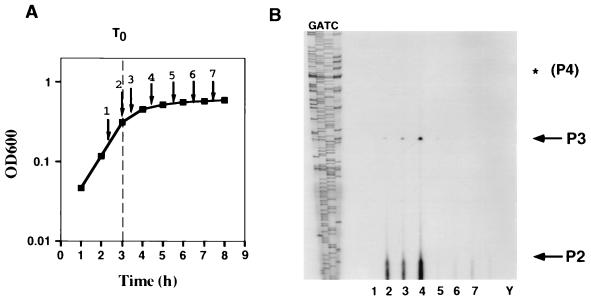
The results of the primer extension analysis of cpe mRNA for strain NCTC 10240 are shown in Fig. 6. The cells entered the stationary phase (T0) after about 3 h of growth. Interestingly, the intensity of the signal from P2 was much higher than that of the signal from P3, and a 5′ end at P4 could not be detected at all in this experiment (Fig. 6), supporting our previous finding that little transcription originates from P4 under the conditions tested here. There was a sustained signal from P2 beginning at the entry into the stationary phase, T0 (Fig. 6, lane 2), until T1.5, with the signal intensity dropping sharply between T1.5 and T2.5. There was also induction of P3 at T0; this induction was sustained at a high level through T1.5 (lane 4) before dropping off. Although the signal from P2 was much stronger than that from P3, the promoters showed similar kinetics of induction. Quantitative densitometry analysis of these data was difficult due to the extended, smeared signal exhibited by P2.
FIG. 6.
Growth (A) and primer extension analysis (B) of cpe mRNA from strain NCTC 10240 with primer OSM71. The numbered arrows in panel A show the times sampled for RNA extraction and correspond to the lanes in panel B. Y, yeast RNA control. The arrows in panel B designate cpe promoters discussed in the text. The asterisk denotes the location of P4, based on the sequence shown at the left. GATC lanes show the sequence of the template strand of pSM104 derived with primer OSM71. OD600, optical density at 600 nm.
A similar pattern of P2 and P3 induction was seen with primer extension products from strain NCTC 8798 during the growth and sporulation cycles (30); in addition, a 5′ end at P4 was not detected in this strain.
DISCUSSION
In a previous report, we identified by primer extension analysis several 5′ ends that may indicate the location of cpe sporulation-dependent promoters (22). In this study, we used nested and internal deletions of the cpe promoter regions to narrow down the locations where transcription can be initiated and confirmed the presence of at least three promoters, P1, P2, and P3. In vitro transcription assays done with extracts from sporulating cells provided additional biochemical evidence for transcription being initiated at these three promoters. A fourth 5′ end detected by primer extension (P4) in our previous report (22) could not be detected with the techniques described here, including primer extension (Fig. 6), RNase T2 protection (30), and in vitro transcription (Fig. 5) assays. In addition, deletion analysis in which a P4-gusA fusion was assayed showed very little sporulation-dependent expression (Fig. 3C). These results suggest either that P4 is a primer extension artifact or that it requires sequences downstream of the start site of transcription for activity.
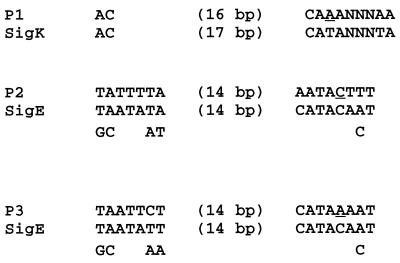
The DNA sequences immediately upstream of the apparent start sites for P1, P2, and P3 show significant similarity to consensus recognition sequences for RNA polymerase containing the sporulation-dependent sigma factors SigE and SigK. In particular, sequences upstream of P1 are similar to SigK-dependent promoters, while sequences upstream of P2 and P3 exhibit strong similarity to SigE-dependent promoters (Fig. 7). These results could indicate that the synthesis of these sigma factors during the course of sporulation is, at least in part, responsible for the sporulation-dependent synthesis of CPE. Indirect support for this regulatory model comes from the kinetic analysis of P2 and P3 induction (Fig. 6). Transcription of both P2 and P3 was initiated immediately upon entry into the stationary phase. This coinduction was consistent with P2 and P3 being regulated by a common mechanism, e.g., the synthesis and activity of SigE in the mother cell. If P1 is regulated by the synthesis and activity of SigK, it presumably would be induced at a later time in the sporulation cycle than P2 and P3. However, C. perfringens produces a spore in a very short time (∼2.5 h) compared to B. subtilis (∼6 to 8 h). This rapid spore production may compress the time differences between which SigE- and SigK-dependent promoters are expressed.
FIG. 7.
Alignment of cpe promoters P1, P2, and P3 with consensus SigE and SigK promoter recognition sequences derived from B. subtilis (15). Degenerate bases in the consensus are shown below each line, the spacing between the promoter −10 and −35 regions is shown in parentheses, and the −10 base relative to the start site of transcription in the cpe promoters is underlined.
It should be pointed out that the consensus recognition sequences shown in Fig. 7 are derived from studies with Bacillus spp., mostly Bacillus subtilis (15). In addition, B. subtilis does not regulate the cpe promoter in a sporulation-dependent fashion and does not seem to initiate transcription from any of the promoters described in this report (22). There are at least two possible reasons for this. (i) B. subtilis may not recognize the promoters due to the differences that exist between the proposed recognition sequences for P1, P2, and P3 and the consensus sequences of SigE- and SigK-dependent promoters. (ii) C. perfringens may contain additional transcriptional regulators, absent from B. subtilis, that allow it to recognize and initiate transcription from P1, P2, and P3.
An important point to consider is whether C. perfringens possesses homologs of SigE and SigK. The genes encoding these sigma factors as well as SigA and SigG homologs have recently been cloned and sequenced from Clostridium acetobutylicum (25, 28). In addition, we have also recently cloned and sequenced the genes encoding homologs of SigE, SigK, and SigG from C. perfringens (30). Therefore, these sigma factor proteins are present in C. perfringens and could function as potential regulators of transcription at the cpe promoters. Unfortunately, with cpe+ strains, it is not possible at the present time to make specific knockout mutations in the sigma factor genes to test our model directly.
Interestingly, it has been clearly shown that SigE and SigK are active only in the mother cell compartment of the developing sporangium in B. subtilis (see references 11 and 15 for reviews). If this is also the case with C. perfringens, then SigE and SigK would be active in the same compartment in which the large majority of CPE protein is made. Such compartment-specific regulation of toxin synthesis has also been seen with the cryIA gene from Bacillus thuringiensis, which encodes an insecticidal toxin and is transcriptionally regulated by SigE and SigK (1, 3, 4). If the regulation of cpe promoters also is found to be SigE and SigK dependent, this finding would represent a remarkable example of convergent evolution, where two toxins, with no evident sequence homology, have a similar regulatory mechanism and are active on intestinal mucosal cells but in completely different hosts (mammals versus insects).
Definitive proof of our model that transcription from P1, P2, and P3 requires SigE and SigK will come from the purification of RNA polymerase forms that can initiate transcription from these promoters. Such experiments are currently under way in our laboratory.
ACKNOWLEDGMENTS
This work was initiated at Tufts University School of Medicine with support from U.S. Public Health Service grant GM42219 to A. L. Sonenshein. Studies at the University of Tennessee were supported by NRICGP/USDA grant 96-01542 and by grant IN-176-E from the American Cancer Society, both awarded to S.B.M.
REFERENCES
- 1.Adams L F, Brown K L, Whiteley H R. Molecular cloning and characterization of two genes encoding sigma factors that direct transcription from a Bacillus thuringiensis crystal protein gene promoter. J Bacteriol. 1991;173:3846–3854. doi: 10.1128/jb.173.12.3846-3854.1991. [DOI] [PMC free article] [PubMed] [Google Scholar]
- 2.Bannam T L, Rood J I. Clostridium perfringens-Escherichia coli shuttle vectors that carry single antibiotic resistance determinants. Plasmid. 1993;29:233–235. doi: 10.1006/plas.1993.1025. [DOI] [PubMed] [Google Scholar]
- 3.Brown K L, Whiteley H R. Isolation of a Bacillus thuringiensis RNA polymerase capable of transcribing crystal protein genes. Proc Natl Acad Sci USA. 1988;85:4166–4170. doi: 10.1073/pnas.85.12.4166. [DOI] [PMC free article] [PubMed] [Google Scholar]
- 4.Brown K L, Whiteley H R. Isolation of the second Bacillus thuringiensis RNA polymerase that transcribes from a crystal protein gene promoter. J Bacteriol. 1990;172:6682–6688. doi: 10.1128/jb.172.12.6682-6688.1990. [DOI] [PMC free article] [PubMed] [Google Scholar]
- 5.Brynestad S, Iwanejko L A, Stewart G S, Granum P E. A complex array of Hpr consensus DNA recognition sequences proximal to the enterotoxin gene in Clostridium perfringens type A. Microbiology. 1994;140:97–104. doi: 10.1099/13500872-140-1-97. [DOI] [PubMed] [Google Scholar]
- 6.Cormack B. Introduction of a point mutation by sequential PCR steps. In: Ausubel F M, Brent R, Kingston R E, Moore D D, Seidman J G, Smith J A, Struhl K, editors. Current protocols in molecular biology. New York, N.Y: Greene Publishing Associates, Inc./John Wiley & Sons, Inc.; 1994. pp. 8.5.7–8.5.9. [Google Scholar]
- 7.Czeczulin J R, Collie R C, McClane B A. Regulated expression of Clostridium perfringens enterotoxin in naturally cpe-negative type A, B, and C isolates of C. perfringens. Infect Immun. 1996;64:3301–3309. doi: 10.1128/iai.64.8.3301-3309.1996. [DOI] [PMC free article] [PubMed] [Google Scholar]
- 8.Czeczulin J R, Hanna P C, McClane B A. Cloning, nucleotide sequencing, and expression of the Clostridium perfringens enterotoxin gene in Escherichia coli. Infect Immun. 1993;61:3429–3439. doi: 10.1128/iai.61.8.3429-3439.1993. [DOI] [PMC free article] [PubMed] [Google Scholar]
- 9.Duncan C L. Time of enterotoxin formation and release during sporulation of Clostridium perfringens type A. J Bacteriol. 1973;113:932–936. doi: 10.1128/jb.113.2.932-936.1973. [DOI] [PMC free article] [PubMed] [Google Scholar]
- 10.Duncan C L, Strong D H, Sebald M. Sporulation and enterotoxin production by mutants of Clostridium perfringens. J Bacteriol. 1972;110:378–391. doi: 10.1128/jb.110.1.378-391.1972. [DOI] [PMC free article] [PubMed] [Google Scholar]
- 11.Errington J. Bacillus subtilis sporulation: regulation of gene expression and control of morphogenesis. Microbiol Rev. 1993;57:1–33. doi: 10.1128/mr.57.1.1-33.1993. [DOI] [PMC free article] [PubMed] [Google Scholar]
- 12.Garnier T, Cole S T. Characterization of a bacteriocinogenic plasmid from Clostridium perfringens and molecular genetic analysis of the bacteriocin-encoding gene. J Bacteriol. 1986;168:1189–1196. doi: 10.1128/jb.168.3.1189-1196.1986. [DOI] [PMC free article] [PubMed] [Google Scholar]
- 13.Garnier T, Cole S T. Studies of UV-inducible promoters from Clostridium perfringens in vivo and in vitro. Mol Microbiol. 1988;2:607–614. doi: 10.1111/j.1365-2958.1988.tb00069.x. [DOI] [PubMed] [Google Scholar]
- 14.Graves M C, Rabinowitz J C. In vivo and in vitro transcription of the Clostridium pasteurianum ferredoxin gene. J Biol Chem. 1986;261:11409–11415. [PubMed] [Google Scholar]
- 15.Haldenwang W G. The sigma factors of Bacillus subtilis. Microbiol Rev. 1995;59:1–30. doi: 10.1128/mr.59.1.1-30.1995. [DOI] [PMC free article] [PubMed] [Google Scholar]
- 16.Jefferson R A, Burgess S M, Hirsh D. β-Glucuronidase from Escherichia coli as a gene-fusion marker. Proc Natl Acad Sci USA. 1986;83:8447–8451. doi: 10.1073/pnas.83.22.8447. [DOI] [PMC free article] [PubMed] [Google Scholar]
- 17.Johnson C C. Clostridium perfringens food poisoning. In: Finegold S M, George W L, editors. Anaerobic infections in humans. London, England: Academic Press Ltd.; 1989. pp. 629–638. [Google Scholar]
- 18.Kokai-Kun J F, McClane B A. Evidence that a region(s) of the Clostridium perfringens enterotoxin molecule remains exposed on the external surface of the mammalian plasma membrane when the toxin is sequestered in small or large complexes. Infect Immun. 1996;64:1020–1025. doi: 10.1128/iai.64.3.1020-1025.1996. [DOI] [PMC free article] [PubMed] [Google Scholar]
- 19.McClane B A. Clostridium perfringens enterotoxin acts by producing small molecule permeability alterations in plasma membranes. Toxicology. 1994;87:43–67. doi: 10.1016/0300-483x(94)90154-6. [DOI] [PubMed] [Google Scholar]
- 20.McDonel J L. Mechanism of action of Clostridium perfringens enterotoxin. Food Technol. 1980;1980(April):91–95. [Google Scholar]
- 21.Melville S B, Collie R E, McClane B A. Regulation of enterotoxin production in Clostridium perfringens. In: Rood J I, McClane B A, Songer J G, Titball R W, editors. The clostridia: molecular biology and pathogenesis. San Diego, Calif: Academic Press, Inc.; 1997. pp. 471–490. [Google Scholar]
- 22.Melville S B, Labbe R, Sonenshein A L. Expression from the Clostridium perfringens cpe promoter in C. perfringens and Bacillus subtilis. Infect Immun. 1994;62:5550–5558. doi: 10.1128/iai.62.12.5550-5558.1994. [DOI] [PMC free article] [PubMed] [Google Scholar]
- 23.Melville, S. B., and A. L. Sonenshein. 1995. Unpublished data.
- 24.Roper G, Short J A, Walker D A. The ultrastructure of Clostridium perfringens spores. In: Baker A M, Wold J, Ellar D J, Dring G H, Gould G W, editors. Spore research. London, England: Academic Press Ltd.; 1976. pp. 279–296. [Google Scholar]
- 25.Sauer U, Treuner A, Buchholz M, Santangelo J D, Durre P. Sporulation and primary sigma factor genes in Clostridium acetobutylicum. J Bacteriol. 1994;176:6572–6582. doi: 10.1128/jb.176.21.6572-6582.1994. [DOI] [PMC free article] [PubMed] [Google Scholar]
- 26.Tabor S, Richardson C C. DNA sequence analysis with a modified bacteriophage T7 DNA polymerase. Proc Natl Acad Sci USA. 1987;84:4767–4771. doi: 10.1073/pnas.84.14.4767. [DOI] [PMC free article] [PubMed] [Google Scholar]
- 27.Wieckowski E U, Wnek A P, McClane B A. Evidence that an approximately 50-kDa mammalian plasma membrane protein with receptor-like properties mediates the amphiphilicity of specifically bound Clostridium perfringens enterotoxin. J Biol Chem. 1994;269:10838–10848. [PubMed] [Google Scholar]
- 28.Wong J, Sass C, Bennett G N. Sequence and arrangement of genes encoding sigma factors in Clostridium acetobutylicum ATCC 824. Gene. 1995;153:89–92. doi: 10.1016/0378-1119(94)00818-d. [DOI] [PubMed] [Google Scholar]
- 29.Yanisch-Perron C, Vieira J, Messing J. Improved M13 phage cloning vectors and host strains: nucleotide sequences of the M13mp18 and pUC19 vectors. Gene. 1985;33:103–119. doi: 10.1016/0378-1119(85)90120-9. [DOI] [PubMed] [Google Scholar]
- 30.Zhao, Y., and S. B. Melville. 1997. Unpublished data.


