

Abstract
Background
Neuroendocrine tumors (NETs) are a group of biologically and clinically heterogeneous neoplasms predominantly found in the gastrointestinal and bronchopulmonary tractus. Despite a rising incidence, implementation of evidence‐based standardized care for this heterogenous group remains challenging. The European Neuroendocrine Tumor Society regularly reviews guidelines regarding diagnostic and treatment strategies for NETs. The aim of this study is to shed light on the care of patients with a NET in Belgian Limburg, to provide data as a basis for future studies and to check whether data and results are according to consensus guidelines and outcomes described in literature.
Methods
Our study concerned a detailed observational data collection of two large Belgian hospitals (Jessa Hospital Hasselt and Hospital Oost‐Limburg Genk) with special interest in patient profile, quality of pathology reports, use of diagnostic imaging, and overall survival. Data on 188 patients were assembled between January 2010 and December 2014 with follow‐up until June 2016 (median follow‐up: 33.6 months).
Results
Fifty percent of patients were male. NETs were located mainly in the digestive tract (63.8%) and lung (20.2%). Appendiceal NETs were diagnosed at a significantly younger age than other tumors (41.3 vs. 64.0 years). Overall, a mean pathology report quality score of 3.0/5 was observed with the highest scores for small bowel NETs. Diagnostic and nuclear imaging was performed in 74.5% and 29.8% of cases, respectively. Seventy‐four percent of the population survived until the end of the observation period with highest survival rates for appendiceal and small bowel NETs.
Conclusion
Overall, epidemiological results were comparable with findings in the literature. Gastrointestinal NETs met most of the requirements of qualitative pathology reporting and diagnostic imaging as listed in the European Neuroendocrine Tumor Society consensus guidelines. However, consensus with regard to bronchopulmonary NETs is still scarce and remains an objective for future research. Moreover, discussing treatment strategies in specialized multidisciplinary tumor boards would facilitate regional care.
Keywords: neuroendocrine tumors, epidemiology, quality, pathology report, Ki67, overall survival, guidelines
Overall, the epidemiological results of our neuroendocrine tumor (NET) cohort were comparable with findings in literature. Gastrointestinal NETs met most of the requirements of qualitative pathology reporting and diagnostic imaging as listed in the European Neuroendocrine Tumor Society consensus guidelines. Discussing treatment strategies in specialized multidisciplinary tumor boards would facilitate regional care.

Abbreviations
- BP‐NET
bronchopulmonary neuroendocrine tumor
- CD56
neural cell adhesion molecule
- ENETS
European Neuroendocrine Tumor Society
- FDG‐PET
fluorodeoxyglucose‐positron emission tomography
- GEP‐NET
gastrointestinal neuroendocrine tumor
- MTB
medical tumor board
- NET
neuroendocrine tumor
- SRS
somatostatin receptor scintigraphy
- TAM
time from pathology to first multidisciplinary tumor board
1. INTRODUCTION
Neuroendocrine tumors (NETs) are a rare group of biologically and clinically heterogenous neoplasms. Nonetheless, its incidence has significantly risen over the last 40 years to 6.98 per 100,000 [1]. This can mainly be attributed to improved diagnostics and specialist awareness [2]. NETs are predominantly found in the gastrointestinal and respiratory system, but can occur throughout the entire body. NETs are in general characterized by their capability to produce and secrete hormones, which can cause functional neuroendocrine syndromes. However, most NETs cause only few symptoms and mimic nonmalignant diseases [3]. This frequently leads to delayed diagnosis and treatment.
Despite the introduction of guidelines in 2005, epidemiological, diagnostic, and therapeutic data remain scarce. Therefore, implementation of routine care for these patients has been difficult. The European Neuroendocrine Tumor Society (ENETS) regularly publishes and updates consensus guidelines regarding diagnostic and treatment strategies of NETs. However, elaborate data collection and further research are paramount to improve standard of care. The aim of this study was to shed light on the care of patients with a NET in Belgian Limburg and to assess whether our data are according to international guidelines and clinical practice.
2. MATERIALS AND METHODS
2.1. Patient inclusion and data acquisition
Patients diagnosed with a NET between January 2010 and December 2014 in Jessa Hospital Hasselt and Hospital Oost‐Limburg (ZOL) Genk were identified using specific search terms provided by two specialized pathologists. This resulted in a total of 434 patients. All patients without NET or a definite pathologic confirmation were excluded, as well as patients with small‐cell lung cancer. Ultimately, 188 patients were included in the study (Hospital 1: 93; Hospital 2: 95).
Files were reviewed and data were acquired by two trained medical students (K. K. and H. B.). Demographics, clinicopathologic characteristics, and data concerning early outcome were collected prospectively, and reviewed and analyzed retrospectively. The quality of data collection was assessed by random revision of the data and patients' files by two experienced NET specialists. This study followed the Strengthening The Reporting of Observational Studies in Epidemiology (STROBE) reporting guidelines [4].
The quality of the pathology reports was based on the documentation of proliferation index (Ki67), WHO classification, TNM staging (ENETS guidelines 2012 and 2016 [5, 6, 7, 8, 9, 10, 11, 12, 13, 14]) lymphangiographic invasion and markers of neuroendocrine pathology (chromogranin A, neuron‐specific enolase, synaptophysin, neural cell adhesion molecule [CD56]). Every marker was awarded 1 point in this score. Each report was given a score between 0 and 5 and indicates adherence to ENETS recommendation guidelines (ENETS guidelines 2012 and 2016 [15, 16]). Patients were followed until June 30, 2016 (median follow‐up: 33.6 months, range: 21–2749) and overall survival was assessed as primary endpoint. General practitioners were contacted in case patients did not receive follow‐up in the hospital. Only 23 patients were lost to follow‐up.
This study was approved by the institutional review board and ethics committee, conform national privacy legislation, and conducted according to the revised version of the Declaration of Helsinki. The need for informed consent was waived given the retrospective character of the study.
2.2. Statistics
Multiple imputation (MI) was adopted to handle the incompleteness in the data called missingness. This approach has been accepted by the European Medicines Agency for application in clinical trials. MI [17, 18, 19, 20] consists of three steps. In the first or imputation step, the principle is to replace missing values with M copies or so‐called imputations. These are drawn from the predictive distribution of what is missing, given what is observed. The modeler obtains M completed datasets. In the second or modeling step, each of these is analyzed separately as if the data were complete. Thus, M estimates of the model parameters are obtained. In the third or analysis step, these M estimates are combined into a single set of parameter and precision estimates, using so‐called Rubin's rules. The NET dataset is imputed using a fully conditional specification approach [19]. M imputed datasets were generated and appropriate combination rules were applied for all analyzes in the final step of MI [18]. Furthermore, linear, logistic or survival regression was applied to assess the association between the response and independent variables, depending on the type of the response variable. Based on the original data and explorative data analysis (histogram, boxplot, normal probability plot) no deviation from normality was observed. After combining the results from the completed datasets, the Wald χ 2 and type‐III ANOVA F tests were applied to test the significance of the association. Of note, if the response and independent variables had no missing data, the same F test was applied without using the combination rule. Results will be presented as means with standard error unless otherwise indicated.
For survival analysis, the accelerated failure time model was selected as it is a parametric model that accounts for censoring and is considered the most accurate in the context of MI for independent variables with missing data.
All statistical analyses were conducted with SAS® (version 9.4, SAS Institute).
3. RESULTS
3.1. Patient characteristics
In the total population of 434 patients, 188 patients with NET were identified of which 94 (50%) were male (Table 1). Tumors were located mainly in the digestive tract (n = 120, 63.8%), followed by lung (n = 38, 20.2%), unknown primary site (n = 19, 10.1%), urogenital (n = 8, 4.3%) and other locations (n = 3, 1.6%). A significant difference in age at diagnosis for tumor location was observed (p < 0.001). However, the interaction between gender and tumor location was not significant (p = 0.65, Supporting Information: Table 1A–C). Patients with appendiceal NET were younger than other tumor locations, respectively, a mean age of 41.3 and 64.0 years (Supporting Information: Table 2).
Table 1.
Patient and tumor characteristics.
| No. (%) | p value | |
|---|---|---|
| Tumor location (n = 188) | ||
| Appendix | 32 (17.0) | |
| Colon incl. rectum | 28 (14.9) | |
| Lung | 38 (20.2) | |
| Pancreas | 18 (9.6) | |
| Small bowel | 31 (16.5) | |
| Age (years, mean/SE) | 59.8/1.33 | |
| Appendix | 41.3/2.89 | |
| Colon incl. rectum | 64.4/3.09 | |
| Lung | 64.9/2.65 | |
| Pancreas | 62.1/3.86 | |
| Small bowel | 62.7/2.94 | |
| Sex | 0.56 | |
| Male | 94 (50) | |
| Female | 94 (50) | |
| Active smoker, smoking <5 years ago | 46 (24.5) | |
| Symptomatic | 95 (50.5) | |
| Metastases at diagnosis | 37 (19.7) | |
| Second primary | 48 (25.5) | |
| Center of diagnosis (Hospital 1/2) | 0.06 | |
| Overall | 93/95 (49.5/50.5) | |
| Appendix | 13/19 (40.6/59.4) | |
| Colon | 15/13 (53.6/46.4) | |
| Lung | 11/27 (28.9/71.1) | |
| Pancreas | 14/4 (77.8/22.2) | |
| Small bowel | 19/12 (61.3/38.7) |
Note: Wald test of comparison with the empty model was used to test for significance. 0.05 significance level is applied.
Abbreviation: SE, standard error.
There was no significant difference in age between known and unknown tumor location (p = 0.59, Supporting Information: Table 3A,B). Tumor location did not differ between the two medical centers (p = 0.06, Table 1), except for pancreatic NET: almost 78% of all pancreatic NETs were diagnosed at Hospital 1 (Supporting Information: Table 4A,B).
Table 3.
Use of diagnostic modalities.
| Nuclear (PET/SRS) (%) | Imaging (US/X‐ray/CT/MRI) (%) | |
|---|---|---|
| Tumor location | ||
| Overall | 29.8 | 74.5 |
| Appendix | 6.3 | 71.1 |
| Colon | 7.1 | 67.9 |
| Lung | 65.3 | 88.2 |
| Pancreas | 44.5 | 83.3 |
| Small bowel | 17.1 | 93.2 |
| Hospital 1/2 | ||
| Overall | 23.7/35.8 | 75.3/73.7 |
| GEP‐NETs | 13.6/14.8 | 74.2/72.2 |
| Lung | 50.0/66.7 | 83.3/81.5 |
Abbreviations: CT, computerized tomography; GEP‐NET, gastroenteropancreatic neuroendocrine tumor; MRI, magnetic resonance imaging; PET, positron emission tomography; SRS, somatostatin receptor scintigraphy; US, ultrasonography.
Table 4.
First‐line therapy according to tumor location and effect of tumor location on choice of first‐line therapy.
| 1st line surgery | 1st line chemoRx | 1st line radioRx | 1st line medical Rx | No therapy | |
|---|---|---|---|---|---|
| Overall | 65.4% | 6.9% | 3.7% | 6.4% | 17.6% |
| Tumor location | |||||
| Appendix (n = 32) | 31 (96.9%) | 0 | 0 | 0 | 1 (3.1%) |
| Colon (n = 28) | 23 (82.1%) | 0 | 0 | 0 | 5 (17.9%) |
| Lung (n = 38) | 23 (60.5%) | 4 (10.5%) | 3 (7.9%) | 0 | 8 (21.1%) |
| Pancreas (n = 18) | 9 (50%) | 3 (16.7%) | 1 (5.6%) | 3 (16.7%) | 2 (11.1%) |
| Small bowel (n = 31) | 25 (80.6%) | 0 | 0 | 2 (6.5%) | 4 (12.9%) |
| p value | 0.004 | 0.048 | 0.197 | 0.014 |
Note: Logistic regression was applied given a certain first‐line therapy as response and tumor location as main effect. F test was applied to test if the effect of tumor location on a certain first‐line therapy is significant. 0.05 significance level is applied.
Abbreviation: Rx, therapy.
Half of the study population (n = 95, 50.5%) presented with symptoms at the time of diagnosis. In 19.7% of the cases, patients presented with metastasis at time of diagnosis. In more than a quarter of the patients (25.5%), a second primary tumor was found.
3.2. Pathology
Overall, a mean quality score of 3.0 was achieved in pathological reporting (Table 2). Only one pathology report, concerning a bronchial NET, had a score of 0. Of all remaining pathology reports, 6.9% scored 1 point, 29.3% scored 2 points, 29.3% scored 3 points, 24.5% scored 4 points and 9.6% scored 5 points. A significant difference in quality score between different tumor locations could be observed (p < 0.001, Supporting Information: Table 5A). Patients with small bowel NETs had a higher quality score (mean: 3.9) compared with all other tumor locations (Supporting Information: Table 5B). Hospital 1 had higher mean quality scores than Hospital 2 (3.16 [0.12] vs. 2.82 [0.12], p = 0.0367, Supporting Information: Table 6). A higher score corresponded with a better overall survival in univariate analysis (p = 0.0035, OR: 1.58, 95% confidence interval [CI] 1.16–2.16; Supporting Information: Table 7A). However, after correction for age, sex, WHO grading, and location in a multivariate regression, this could no longer be observed (p = 0.1813; Supporting Information: Table 7B).
Table 2.
Pathology reports.
| Mean | 95% CI | p value | |
|---|---|---|---|
| Quality score (0–5) | <0.001 | ||
| Overall | 3.0 | 2.8–3.2 | |
| Appendix | 3.1 | 2.7–3.5 | |
| Colon | 3.3 | 2.9–3.7 | |
| Lung | 2.5 | 2.2–2.8 | |
| Pancreas | 3.2 | 2.7–3.7 | |
| Small bowel | 3.9 | 3.5–4.2 | |
| Time APO–MTB (days) | |||
| Overall | 48.3 | 18.7–77.9 | |
| Appendix | 45.8 | −10.8 to 102.4 | |
| Colon | 30.5 | −45.4 to 106.4 | |
| Lung | 99.7 | 12–187.6 | |
| Pancreas | 13.5 | −70.7 to 97.8 | |
| Small bowel | 50.6 | −6.2 to 107.3 |
Note: A linear model was applied with quality score as response and tumor location as main effect to test for significance. 0.05 significance level is applied.
Abbreviations: APO, pathology diagnosis; CI, confidence interval; MTB, first medical tumor board.
Table 5.
Association between overall survival and respective tumor location, referral from general practitioner, presence of symptoms and number of therapies.
| Effect | DF | Wald χ 2 | p value |
|---|---|---|---|
| Tumor location | 8 | 19.2971 | 0.0133 |
| Referral by GP | 1 | 0.1612 | 0.6881 |
| Presence of symptoms | 1 | 7.1217 | 0.0076 |
| Number of therapies | 1 | 2.6845 | 0.1013 |
Note: Survival analysis was based on the original data using accelerated failure time model. The Type III Anova test was used to test the association. 0.05 significance level is applied.
Abbreviations: DF, degrees of freedom; GP, general practitioner.
The overall time between pathology (APO) diagnosis and the first medical tumor board (MTB) (time APO‐MTB [TAM]) was on average 48 (15.06) days. Running pairwise t tests, only two tumor location group comparisons had a significantly different mean TAM (Supporting Information: Table 8A): unknown location versus esophagus and lung respectively. For tumors with unknown location, pathology was reported on average 23 (41.76) days after the first MTB. A shorter TAM did not correspond with a better overall survival (p = 0.47; OR: 1.002, 95% CI: 0.997–1.006, Supporting Information: Table 8B). No significant influence of TAM on disease progression could be observed (p = 0.74, Supporting Information: Table 8C).
3.3. Diagnostics
In the total study, cohort 29.8% received a fluorodeoxyglucose or 68 Ga‐DOTA‐somatostatin analog PET‐scan or somatostatin receptor scintigraphy (SRS). This was higher (61.3%) in case of unknown primary site. Patients with colorectal or appendiceal NET underwent nuclear imaging in, respectively, only 7.1% and 6.3% of cases. Hospital 2 performed more nuclear imaging compared with Hospital 1. This could be attributed to the percentage of lung NETs, respectively 66.7% and 50.0% (shown in Table 3).
Other imaging (ultrasonography, X‐ray, computerized tomography [CT], and/or magnetic resonance imaging; Figure 1) was performed in 74.5% of the patients. Nearly 85% of the patients with an unknown tumor location underwent one of the latter. Almost three quarter of the patients with gastric NET did not receive any kind of imaging and diagnosis was mainly based on endoscopy. No relationship between diagnostic imaging and overall survival (p = 0.067), neither progression free survival (p = 0.32) could be observed Supporting Information: Table 9A,B).
Figure 1.
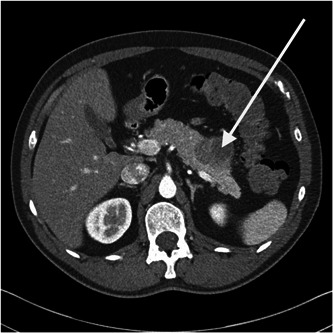
Computed tomography of the abdomen (arterial phase) showing a pancreatic neuroendocrine tumor (arrow).
3.4. Therapy
In total, 81.4% (n = 153) of the patients received therapeuti interventions. Table 4 shows the first‐line therapy according to tumor location. The time between diagnosis and first treatment was on average 12 (13.62) days.
Overall, 3 out of 5 patients (n = 126) underwent surgery, followed by medical therapy in 31.8% (n = 41), chemotherapy in 15.4% (n = 29), and radiotherapy in 6.4% (n = 12).
Second‐line therapy was administered in almost one‐third of the patients (n = 43, 28.1%) of which more than half received medical therapy as treatment of choice (n = 23, 53.5%).
Tumor location was significantly associated with the use of surgery (p = 0.004) or chemotherapy (p = 0.048) as first‐line therapy. Most GEP‐NETs received surgery as first‐line therapy (90/120, 75.0%), with the exception of esophageal NET which primarily received chemoradiotherapy.
Only 10.5% of patients received adjuvant chemotherapy. In patients who received chemotherapy as first‐line therapy, medical therapy (e.g., somatostatin analogs) was associated with 53.4%. More than 85% of patients that received first‐line radiotherapy also received concomitant chemotherapy.
There was no association between overall survival or progression‐free survival and time between first medical tumor board and start of therapy (p = 0.79 and p = 0.84, respectively).
3.5. Survival
In total, 49 patients (26.1%) had died of which 45 due to their NET and 4 due to other causes. Eleven patients (5.9%) had progressive disease, in 39 patients (20.7%) stable disease could be observed and 50 patients (26.6%) were in remission. Sixteen patients (8.5%) had no evidence of disease. Twenty‐three patients (12.3%) survival data could not be retrieved.
Median overall survival was 362 days (468) (range: 12–2161 days) and 74% of the population was alive at the end of follow‐up. The median overall survival was not reached in this study (Figure 2).
Figure 2.
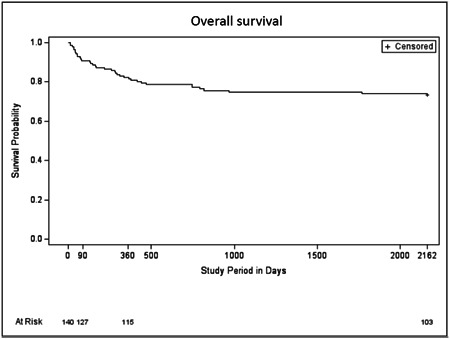
Accelerated failure time model for the overall cohort
A significant association between overall survival and tumor location (p = 0.013; Figure 3; Table 5) and symptoms at diagnosis (p = 0.008) could be observed. Referral from the general practitioner (p = 0.69) or number of therapies (p = 0.10) were not associated with a change in overall survival.
Figure 3.

Accelerated failure time model for the most important tumor locations.
4. DISCUSSION
4.1. Patient characteristics
We found most NETs to be located in the digestive (63.8%) and respiratory (20.2%) systems. A similar distribution was found in other studies [21, 22] with 62%–67% gastrointestinal NETs (GEP‐NETs) and 22%–27% bronchopulmonary NETs (BP‐NETs); however, Helland et al. found a higher percentage of small bowel NETs (53%).
A mean age of 60 years (range 9–89 years) at diagnosis was similar to other studies with a significantly lower age for appendiceal NETs as well [23]. The presence of metastasis in 19.7% of patients at the time of diagnosis was also similar to the literature ranging from 12% to 23% [21, 22].
We observed a difference in the incidence of pancreatic NETs in between hospitals. This could be explained by the implementation of expert centers for complex tumors. This resulted in an allocation of pancreatic tumors to one center and esophageal tumors to the other.
Half of the study population experienced nonspecific symptoms at the time of diagnosis. This was also the case in other studies [21], where most of the diagnoses were made on technical investigations for nonspecific symptoms or during surgery for various other reasons. On the other hand, only 2.1% of our patients experienced a typical neuroendocrine syndrome. This incidence is substantially lower than what could be found in literature [24] with up to 13% of small bowel NETs (in the presence of liver metastases) and 30% of pancreatic NETs presenting with endocrine symptoms. We believe our findings could be explained by the retrospective nature of this study and consequently less adequate documentation of symptoms rather than an absolute difference in the presence of a neuroendocrine syndrome. Only 26.3% of symptomatic tumors were metastatic at diagnosis.
Selection bias may play a role in some of the findings of our study. We subtracted our data from pathology records linked to the national cancer registry to reduce this potential bias to a minimum. However, because we obtained our data from regional hospitals, we could not exclude center bias.
In 25.5% of patients, a synchronous or metachronous second primary malignancy (SPM) could be diagnosed. Patients with a GEP‐NET were diagnosed with an SPM more frequently. This is a slighter higher proportion than described in literature, ranging from 9.8% to 18.9% [25, 26, 27]. This can be explained by the fact that we included all patients with an SPM, whilst other studies excluded patients with any genetic predisposition syndrome.
4.2. Pathology
In general, pathology reports had a mean quality score of 3 out of 5, with small bowel NETs scoring significantly higher with 3.9 (p < 0.02). This can be explained by the higher specialist awareness for NETs in the case of small bowel tumors. In Belgian clinical practice, surgeons are more likely to request Ki67 in case of small bowel tumors than for colorectal carcinomas since colorectal NETs are uncommon, comprising less than 1% of all colorectal cancers [28]. The lower quality score of BP‐NETs according to our scoring system can be explained by the fact that Ki67 was not a criterium for grading of BP‐NETs back in 2015 [29]. Another explanation could be the lower exposure of pulmonary pathologists to NETs, given its low incidence in pulmonary malignancies.
The importance of a qualitative pathology report was confirmed by the ENETS in 2017, in which they proposed a list of minimal requirements, including Ki67‐index, to allow proper differentiation and to be able to compare different studies [30]. Perren et al. stated that Ki67 was more accurate to assess tumor grade than mitotic count. Similarly, Jann et al. [31] showed that TNM staging and grading are the main parameters to identify prognostically distinct subgroups in GEP‐NETs. So far no consensus exists on the prognostic role of Ki67 in BP‐NETs due to lack of evidence [32, 33]. Nonetheless, Ki67 is often required by oncologists for therapy planning [33].
Pathologists should remain prudent to use NET‐specific TNM staging, since using TNM staging for adenocarcinoma may lead to incorrect therapy and assessment of prognosis. As other studies propose, both histopathologic and clinical parameters should be combined for risk stratification to determine treatment strategies for these patients.
4.3. Diagnostics
According to the ENETS consensus guidelines of 2016, SRS or preferably PET should be part of the tumor staging preoperative imaging and restaging process, particularly in high‐grade tumors or when metastatic disease is suspected. In our study, 29.8% of cases underwent a PET or SRS, which can be explained by a large portion of appendiceal NETs and low‐grade NETs. Additionally, one center did not have a PET scan at their disposal, and it was not common practice to perform a PET‐CT for gastrointestinal tumors, even in case of unknown origin. In case of appendiceal NET it is not necessary to perform nuclear imaging when Ki67 is low [34, 35]. The opposite is true for pulmonary tumors, where it is common practice to perform PET‐CT [36]. This resulted in a significant higher number of PET‐CTs in pulmonary NETs. The low incidence of imaging in gastric NETs can be explained by the fact that most diagnoses were made early based on endoscopy and endoscopic ultrasonography. Indeed, only when there is a risk of metastases, extensive imaging must be performed [5]. Nevertheless, given endoscopy's moderate sensitivity for locating primary tumors and its inability to detect distant metastases, imaging remains crucial to establish the extent of disease in advanced neoplasms and in type 3 NENs [11, 37].
4.4. Therapy
In general, local NETs are more often treated with surgery and/or surveillance, whereas advanced stage or metastatic NETs require a more patient‐tailored approach with a combination of surgery, systemic therapy and radiotherapy.
Almost all appendiceal NETs were surgically resected since most appendiceal NETs are incidental findings. Of colorectal and small bowel NETs, 81% got resected. There are several surgical options for small bowel NETs and even in the case of unresectable disease, resection of the primary tumor may avert gut obstruction [38]. Rectal NETs are relatively indolent in nature and an incidental finding in which the risk of lymph node metastasis is the most important factor in surgical strategy. Also, colon NETs are usually diagnosed either at biopsy of a mass or after surgical resection [39]. They behave more aggressively than rectal NETs and recommendations considering surgical strategies have yet to be elaborated [40]. In our population, we grouped colon and rectal NETs together.
We grouped typical carcinoid tumor, atypical carcinoid tumor, and large cell neuroendocrine carcinoma together as BP‐NETs. Of BP‐NETs, 60% got resected. None of the resected tumors and less than half of non‐resected NETs had metastases at diagnosis. Whether surgery is applied and the choice of surgical technique depends on the type of BP‐NET and tumor stage [41].
Given their heterogeneity and diverse presentation, it remains difficult to standardize treatment strategies. Therefore, treatment should be discussed and determined in a multidisciplinary tumor board to improve treatment efficiency and clinical outcome [42, 43, 44]. Hence, we assessed time from pathology to first multidisciplinary tumor board (TAM) as a parameter of quality of care. We could not observe a significant correlation between TAM and disease‐free survival or overall survival (p > 0.05). However, we believe this could be a result of a relatively small patient population making it harder to detect marginal differences.
The wide range of therapeutic options, especially systemic therapy, is rapidly evolving. Nowadays, patients can receive somatostatin analogs (SSAs), mammalian target of rapamycin (mTOR) inhibitors, cytotoxic chemotherapy, peptide receptor radionuclide therapy (PRRT) or vascular endothelial growth factor (VEGF) pathway inhibitors, which further allows for a more patient‐ and tumor‐tailored approach [45]. In the future, therapy can be supported and largely guided by epigenetic characterization of NETs [46], making tumor localization as a marker for therapy possibly less important. This again highlights the importance of an elaborate and correct histopathologic evaluation.
4.5. Outcome
The overall 5‐year survival rate was 74.29% for all NETs regardless of site, which corresponded to findings in literature [47]. Overall mortality was significantly related to tumor location with the highest death rates for pancreatic NETs and the lowest for appendiceal NETs, comparable to other studies [48]. According to Dasari et al., survival for NETs has improved over time, reflecting improvement in diagnosis and therapy [1].
The Belgian healthcare system offers low‐threshold services in terms of access to practitioners, diagnostics, and treatment. Therefore, the socioeconomic status was not taken into consideration when evaluating survival in this study.
5. CONCLUSION
This 6‐year analysis of NETs provides epidemiological information as well as insights in clinical practice and quality of pathology reports of two large regional Belgian hospitals. Overall, epidemiological results were comparable with findings in literature. Gastrointestinal NETs met most of the requirements of qualitative pathology reporting and diagnostic imaging as listed in the ENETS consensus guidelines. However, consensus with regard to bronchopulmonary NETs is still scarce and remains an objective for future research.
Given the heterogeneity and diverse presentation of NETs, treatment strategies should be discussed in specialized multidisciplinary tumor boards in the presence of a dedicated pathologist, oncologist, and surgeon. This could prevent unnecessary referral to tertiary centers and would facilitate regional care in these patients, despite the rarity of the disease.
AUTHOR CONTRIBUTIONS
Hannah Bloemen: Formal analysis (lead); writing – original draft (lead); writing – review and editing (lead). Kristien Kneepkens: Writing – original draft (equal); writing – review and editing (supporting). Karen Deraedt: Data curation (equal); writing – review and editing (equal). Anna Ivanova: Formal analysis (equal); writing – review and editing (supporting). Gregory Sergeant: Conceptualization (equal); data curation (equal); funding acquisition (equal); methodology (equal); project administration (equal); supervision (equal); writing – review and editing (equal). Jeroen Mebis: Conceptualization (equal); data curation; funding acquisition (equal); methodology (equal); project administration (equal); supervision (equal); writing – review and editing (equal). Kurt Van der Speeten: Conceptualization (equal); data curation; funding acquisition (equal); methodology (equal); project administration (equal); supervision (equal); writing – review and editing (supporting).
CONFLICT OF INTEREST
The authors declare no conflict of interest.
ETHICS STATEMENT
This study was approved by the institutional review board and ethics committee (approval ID CME2015/620), conform national privacy legislation and conducted according to the revised version of the Declaration of Helsinki.
INFORMED CONSENT
The need for informed consent was waived given the retrospective character of the study.
Supporting information
Supporting information.
ACKNOWLEDGMENTS
This study was designed and conducted by the Limburg Clinical Research Center (LCRC), a collaboration between Hasselt University, Jessa Hospital (Jessa) and Hospital Oost‐Limburg (ZOL). We thank Helene Piccard for the coordination of the study.
Bloemen H, Kneepkens K, Deraedt K, Ivanova A, Sergeant G, Mebis J, et al. Evaluation of quality of clinical management of neuroendocrine tumors. Cancer Innovation. 2022;1:305–315. 10.1002/cai2.41
DATA AVAILABILITY STATEMENT
The data that support the findings of this study are available from the corresponding author upon reasonable request.
REFERENCES
- 1. Dasari A, Shen C, Halperin D, Zhao B, Zhou S, Xu Y, et al. Trends in the incidence, prevalence, and survival outcomes in patients with neuroendocrine tumors in the United States. JAMA Oncol. 2017;3(10):1335–42. 10.1001/jamaoncol.2017.0589 [DOI] [PMC free article] [PubMed] [Google Scholar]
- 2. Hallet J, Law CHL, Cukier M, Saskin R, Liu N, Singh S. Exploring the rising incidence of neuroendocrine tumors: a population‐based analysis of epidemiology, metastatic presentation, and outcomes. Cancer. 2015;121(4):589–97. 10.1002/cncr.29099 [DOI] [PubMed] [Google Scholar]
- 3. Stordeur S, Vrijens F, Henau K, Schillemans V, De Gendt CLR. Organisation of care for adults with a rare or complex cancer. 2014. Heal. Serv. Res. Brussels Belgian Heal. Care Knowl. Cent. D/2014/10.(KCE Reports 219) (2014).
- 4. Von Elm E, Altman DG, Egger M, Pocock SJ, Gøtzsche PC, Vandenbroucke JP. The strengthening the reporting of observational studies in epidemiology (STROBE) statement: guidelines for reporting observational studies. Bull World Health Organ. 2007;85:867–72. 10.2471/BLT.07.045120 [DOI] [PMC free article] [PubMed] [Google Scholar]
- 5. Delle Fave G, Kwekkeboom DJ, Van Cutsem E, Rindi G, Kos‐Kudla B, Knigge U, et al. ENETS consensus guidelines for the management of patients with gastroduodenal neoplasms. Neuroendocrinology. 2012;95(2):74–87. 10.1159/000335595 [DOI] [PubMed] [Google Scholar]
- 6. Caplin M, Sundin A, Nillson O, Baum RP, Klose KJ, Kelestimur F, et al. ENETS consensus guidelines for the management of patients with digestive neuroendocrine neoplasms: colorectal neuroendocrine neoplasms. Neuroendocrinology. 2012;95(2):88–97. 10.1159/000335594 [DOI] [PubMed] [Google Scholar]
- 7. Jensen RT, Cadiot G, Brandi ML, de Herder WW, Kaltsas G, Komminoth P, et al. ENETS consensus guidelines for the management of patients with digestive neuroendocrine neoplasms: functional pancreatic endocrine tumor syndromes. Neuroendocrinology. 2012;95(2):98–119. 10.1159/000335591 [DOI] [PMC free article] [PubMed] [Google Scholar]
- 8. Falconi M, Bartsch DK, Eriksson B, Klöppel G, Lopes JM, O'Connor JM, et al. ENETS consensus guidelines for the management of patients with digestive neuroendocrine neoplasms of the digestive system: well‐differentiated pancreatic non‐functioning tumors. Neuroendocrinology. 2012;95(2):120–34. 10.1159/000335587 [DOI] [PubMed] [Google Scholar]
- 9. Pape UF, Perren A, Niederle B, Gross D, Gress T, Costa F, et al. ENETS consensus guidelines for the management of patients with neuroendocrine neoplasms from the jejuno‐ileum and the appendix including goblet cell carcinomas. Neuroendocrinology. 2012;95(2):135–56. 10.1159/000335629 [DOI] [PubMed] [Google Scholar]
- 10. Pavel M, Baudin E, Couvelard A, Krenning E, Öberg K, Steinmüller T, et al. ENETS consensus guidelines for the management of patients with liver and other distant metastases from neuroendocrine neoplasms of foregut, midgut, hindgut, and unknown primary. Neuroendocrinology. 2012;95:157–76. 10.1159/000335597 [DOI] [PubMed] [Google Scholar]
- 11. Delle Fave G, O'Toole D, Sundin A, Taal B, Ferolla P, Ramage JK, et al. ENETS consensus guidelines update for gastroduodenal neuroendocrine neoplasms. Neuroendocrinology. 2016;103(2):119–24. 10.1159/000443168 [DOI] [PubMed] [Google Scholar]
- 12. Niederle B, Pape UF, Costa F, Gross D, Kelestimur F, Knigge U, et al. ENETS consensus guidelines update for neuroendocrine neoplasms of the jejunum and ileum. Neuroendocrinology. 2016;103(2):125–38. 10.1159/000443170 [DOI] [PubMed] [Google Scholar]
- 13. Pape UF, Niederle B, Costa F, Gross D, Kelestimur F, Kianmanesh R, et al. ENETS consensus guidelines for neuroendocrine neoplasms of the appendix (excluding goblet cell carcinomas). Neuroendocrinology. 2016;103(2):144–52. 10.1159/000443165 [DOI] [PubMed] [Google Scholar]
- 14. Ramage JK, De Herder WW, Delle Fave G, Ferolla P, Ferone D, Ito T, et al. ENETS consensus guidelines update for colorectal neuroendocrine neoplasms. Neuroendocrinology. 2016;103(2):139–43. 10.1159/000443166 [DOI] [PubMed] [Google Scholar]
- 15. Rindi G, Klöppel G, Alhman H, Caplin M, Couvelard A, de Herder WW, et al. TNM staging of foregut (neuro)endocrine tumors: a consensus proposal including a grading system. Virchows Arch. 2006;449(4):395–401. 10.1007/s00428-006-0250-1 [DOI] [PMC free article] [PubMed] [Google Scholar]
- 16. Rindi G, Klöppel G, Couvelard A, Komminoth P, Körner M, Lopes JM, et al. TNM staging of midgut and hindgut (neuro) endocrine tumors: a consensus proposal including a grading system. Virchows Arch. 2007;451(4):757–62. 10.1007/s00428-007-0452-1 [DOI] [PubMed] [Google Scholar]
- 17. Little R, Rubin D. Statistical analysis with missing data. John Wiley Sons; 2002. [Google Scholar]
- 18. Rubin DB. Multiple imputation for nonresponse in surveys, John Wiley & Sons. [Google Scholar]
- 19. Van Buuren S. Flexible imputation of missing data. Boca Raton: CRC Press. [Google Scholar]
- 20. Molenberghs G, Kenward MG. Missing data in clinical studies. John Wiley Sons, Inc.; 2007. [Google Scholar]
- 21. Oronsky B, Ma PC, Morgensztern D, Carter CA. Nothing but NET: a review of neuroendocrine tumors and carcinomas. Neoplasia. 2017;19(12):991–1002. 10.1016/j.neo.2017.09.002 [DOI] [PMC free article] [PubMed] [Google Scholar]
- 22. Riihimäki M, Hemminki A, Sundquist K, Sundquist J, Hemminki K. The epidemiology of metastases in neuroendocrine tumors. Int J Cancer. 2016;139(12):2679–86. 10.1002/ijc.30400 [DOI] [PubMed] [Google Scholar]
- 23. Helland SK, Prøsch AM, Viste A. Carcinoid tumours in the gastrointestinal tract–a population‐based study from Western Norway. Scand J Surg. 2006;95(3):158–61. 10.1177/145749690609500305 [DOI] [PubMed] [Google Scholar]
- 24. Ito T, Lee L, Jensen RT. Treatment of symptomatic neuroendocrine tumor syndromes: recent advances and controversies. Expert Opin Pharmacother. 2016;17(16):2191–2205. 10.1080/14656566.2016.1236916 [DOI] [PMC free article] [PubMed] [Google Scholar]
- 25. Massironi S, Campana D, Pusceddu S, Falconi M. Second primary neoplasms in patients with lung and gastroenteropancreatic neuroendocrine neoplasms: data from a retrospective multi‐centric study. Dig Liver Dis. 2021;52:367–74. 10.1016/j.dld.2020.09.031 [DOI] [PubMed] [Google Scholar]
- 26. Clift AK, Drymousis P, Al‐Nahhas A, Wasan H, Martin J, Holm S, et al. Incidence of second primary malignancies in patients with neuroendocrine tumours. Neuroendocrinology. 2015;102(1–2):26–32. 10.1159/000381716 [DOI] [PubMed] [Google Scholar]
- 27. Reina JJ, Serrano R, Codes M, Jiménez E, Bolaños M, Gonzalez E, et al. Second primary malignancies in patients with neuroendocrine tumors. Clin Transl Oncol. 2014;16(10):921–6. 10.1007/s12094-014-1174-x [DOI] [PubMed] [Google Scholar]
- 28. Bernick PE, Klimstra DS, Shia J, Minsky B, Saltz L, Shi W, et al. Neuroendocrine carcinomas of the colon and rectum. Dis Colon Rectum. 2004;47(2):163–9. 10.1007/s10350-003-0038-1 [DOI] [PubMed] [Google Scholar]
- 29. Caplin ME, Baudin E, Ferolla P, Filosso P, Garcia‐Yuste M, Lim E, et al. Pulmonary neuroendocrine (carcinoid) tumors: European Neuroendocrine Tumor Society expert consensus and recommendations for best practice for typical and atypical pulmonary carcinoids. Ann Oncol. 2015;26(8):1604–20. 10.1093/annonc/mdv041 [DOI] [PubMed] [Google Scholar]
- 30. Perren A, Couvelard A, Scoazec JY, Costa F, Borbath I, Delle Fave G, et al. ENETS consensus guidelines for the standards of care in neuroendocrine tumors: pathology‐diagnosis and prognostic stratification. Neuroendocrinology. 2017;105(3):196–200. 10.1159/000457956 [DOI] [PubMed] [Google Scholar]
- 31. Jann H, Roll S, Couvelard A, Hentic O, Pavel M, Müller‐Nordhorn J, et al. Neuroendocrine tumors of midgut and hindgut origin: tumor‐node‐metastasis classification determines clinical outcome. Cancer. 2011;117(15):3332–41. 10.1002/cncr.25855 [DOI] [PubMed] [Google Scholar]
- 32. Yatabe Y, Dacic S, Borczuk AC, Warth A, Russell PA, Lantuejoul S, et al. Best practices recommendations for diagnostic immunohistochemistry in lung cancer. J Thorac Oncol. 2019;14(3):377–407. 10.1016/j.jtho.2018.12.005 [DOI] [PMC free article] [PubMed] [Google Scholar]
- 33. Naheed S, Holden C, Tanno L, Jaynes E, Cave J, Ottensmeier CH, et al. The utility of Ki‐67 as a prognostic biomarker in pulmonary neuroendocrine tumours: protocol for a systematic review and meta‐analysis. BMJ Open. 2019;9(8):e031531. 10.1136/bmjopen-2019-031531 [DOI] [PMC free article] [PubMed] [Google Scholar]
- 34. Garcia‐Carbonero R, Capdevila J, Crespo‐Herrero G, Díaz‐Pérez JA, Martínez del Prado MP, Alonso Orduña V, et al. Incidence, patterns of care and prognostic factors for outcome of gastroenteropancreatic neuroendocrine tumors (GEP‐NETs): results from The National Cancer Registry of Spain (RGETNE). Ann Oncol. 2010;21(9):1794–1803. 10.1093/annonc/mdq022 [DOI] [PubMed] [Google Scholar]
- 35. Yu YJ, Li YW, Shi Y, Zhang Z, Zheng MY, Zhang SW. Clinical and pathological characteristics and prognosis of 132 cases of rectal neuroendocrine tumors. World J Gastrointest Oncol. 2020;12(8):893–902. 10.4251/wjgo.v12.i8.893 [DOI] [PMC free article] [PubMed] [Google Scholar]
- 36. Grahek D, Montravers F, Mayaud C, Regnard JF, Kerrou K, Younsi N, et al. [Positron emission tomography (PET) with [18F]‐FDG in bronchopulmonary cancer and its impact on medical decision at the time of diagnosis, staging, or recurrence evaluation]. Rev Pneumol Clin. 2001;57(6):393–403. [PubMed] [Google Scholar]
- 37. Maxwell JE, O'Dorisio TM, Howe JR. Biochemical diagnosis and preoperative imaging of GEP NETs. Surg Oncol Clin N Am. 2016;25(1):171–94. 10.1016/j.soc.2015.08.008 [DOI] [PMC free article] [PubMed] [Google Scholar]
- 38. Clift AK, Kidd M, Bodei L, Toumpanakis C, Baum RP, Oberg K, et al. Neuroendocrine neoplasms of the small bowel and pancreas. Neuroendocrinology. 2020;110(6):444–76. 10.1159/000503721 [DOI] [PMC free article] [PubMed] [Google Scholar]
- 39. Volante M, Grillo F, Massa F, Maletta F, Mastracci L, Campora M, et al. Neuroendocrine neoplasms of the appendix, colon and rectum. Pathologica. 2021;113(1):19–27. 10.32074/1591-951X-230 [DOI] [PMC free article] [PubMed] [Google Scholar]
- 40. Xiao C, Song B, Yi P, Xie Y, Li B, Lian P, et al. Deaths of colon neuroendocrine tumors are associated with increasing metastatic lymph nodes and lymph node ratio. J Gastrointest Oncol. 2020;11(6):1146–54. 10.21037/jgo-20-444 [DOI] [PMC free article] [PubMed] [Google Scholar]
- 41. Gustafsson BI, Kidd M, Chan A, Malfertheiner MV, Modlin IM. Bronchopulmonary neuroendocrine tumors. Cancer. 2008;113(1):5–21. 10.1002/cncr.23542 [DOI] [PubMed] [Google Scholar]
- 42. Kozak VN, Khorana AA, Amarnath S, Glass KE, Kalady MF. Multidisciplinary clinics for colorectal cancer care reduces treatment time. Clin Colorectal Cancer. 2017;16(4):366–71. 10.1016/j.clcc.2017.03.020 [DOI] [PubMed] [Google Scholar]
- 43. El Saghir NS, Keating NL, Carlson RW, Khoury KE, Fallowfield L. Tumor boards: optimizing the structure and improving efficiency of multidisciplinary management of patients with cancer worldwide. Am Soc Clin Oncol Educ Book. 2014;34:e461–6. 10.14694/EdBook_AM.2014.34.e461 [DOI] [PubMed] [Google Scholar]
- 44. Zhang P. Implementation of multidisciplinary team in the diagnosis and treatment of gastroenteropancreatic neuroendocrine neoplasm. Zhonghua Wei Chang Wai Ke Za Zhi. 2016;19(11):1205–10. [PubMed] [Google Scholar]
- 45. Kunz PL. Carcinoid and neuroendocrine tumors: building on success. J Clin Oncol. 2015;33(16):1855–63. 10.1200/JCO.2014.60.2532 [DOI] [PubMed] [Google Scholar]
- 46. Colao A, de Nigris F, Modica R, Napoli C. Clinical epigenetics of neuroendocrine tumors: the road ahead. Front Endocrinol. 2020;11:604341. 10.3389/fendo.2020.604341 [DOI] [PMC free article] [PubMed] [Google Scholar]
- 47. Modlin IM, Lye KD, Kidd M. A 5‐decade analysis of 13,715 carcinoid tumors. Cancer. 2003;97(4):934–59. 10.1002/cncr.11105 [DOI] [PubMed] [Google Scholar]
- 48. Ploeckinger U, Kloeppel G, Wiedenmann B, Lohmann R. The German NET‐registry: an audit on the diagnosis and therapy of neuroendocrine tumors. Neuroendocrinology. 2009;90(4):349–63. 10.1159/000242109 [DOI] [PubMed] [Google Scholar]
Associated Data
This section collects any data citations, data availability statements, or supplementary materials included in this article.
Supplementary Materials
Supporting information.
Data Availability Statement
The data that support the findings of this study are available from the corresponding author upon reasonable request.