

Abstract
Saccharomyces cerevisiae cells regulate progress through the G1 phase of the cell cycle in response to nutrients, moving quickly through G1 in rich medium and slowly in poor medium. Recent work has shown that the levels of Cln3 protein, a G1 cyclin, are low in cells growing in poor medium and high in cells growing rapidly in rich medium, consistent with the previously recognized role of Cln3 in promoting passage through Start. Cln3 protein levels appear to be regulated both transcriptionally and posttranscriptionally. We have worked to define the nutrient signals that regulate CLN3 mRNA levels. We find that CLN3 mRNA levels are high during log-phase growth in glucose medium, low in postdiauxic cells growing on ethanol, and slightly lower still in cells in stationary phase. CLN3 mRNA levels are induced by glucose in a process that involves transcriptional control, requires metabolism of the glucose, and is independent of the Ras-cyclic AMP pathway. CLN3 mRNA levels are also positively regulated by nitrogen sources, but phosphorus and sulfur limitation do not affect CLN3 message levels.
Eukaryotic cells regulate proliferative growth in response to a variety of external signals. This is not only important to the survival of individual cells but also a critical part of the coordinated processes involved in the growth and differentiation of multicellular organisms. One approach to understanding the regulation of proliferation in eukaryotic cells has been to use the budding yeast Saccharomyces cerevisiae as a model system. This strategy is based on the observation that many processes found in yeast are conserved in larger, more complex eukaryotes and takes advantage of the genetic techniques available with yeast. Proliferation in S. cerevisiae is regulated in response to two known types of environmental signals, mating pheromones and nutrients (21). The details of the mating pheromone pathway are being rapidly pursued, but much less is known about how nutrients regulate progress through the cell cycle.
Although yeast cells grow in mass at widely varying rates in different media, they are able to maintain almost a constant cell size. This means that the rate of progress through the cell cycle must be adjusted to match changes in the rate of growth in mass. Much of this regulation of the cell cycle occurs by controlling the length of the G1 phase of the cell cycle (14). Specifically, yeast cells modulate passage through a point in late G1 referred to as Start in response to changes in their growth media. In this way, cells growing slowly on poor medium are delayed in passing from G1 into S, allowing the cells more time to grow to the proper size before budding. Cells growing rapidly on rich medium spend only a short time in G1.
Progress through Start is dependent on the kinase activity of the protein encoded by CDC28 (22). The Cdc28 kinase is itself regulated by a set of proteins called cyclins (19). It is therefore reasonable to expect some sort of connection between nutrient signals and the cyclin-Cdc28 kinase system. Of the G1 cyclin genes, CLN3 appears to play a distinct role in controlling passage through Start, and it has been proposed to be an initiator of a cascade of G1 cyclin expression (25, 26). Manipulation of CLN3 expression has been shown to alter G1 length: loss of CLN3 delays Start, producing larger cells. Increasing CLN3 expression, either by increasing transcript levels or by mutations that produce a hyperstable Cln3 protein, shortens G1 (5, 27). Recent work has shown that Cln3 protein levels are regulated by the growth medium, with high levels of Cln3 protein found in log-phase cells growing in rich medium and low levels found in cells growing slowly in the oxidative phase of growth following the diauxic shift (10). The finding that levels of Cln3-Cdc28 activity correlate with G1 length in media of varying quality suggests a model in which Cln3 protein activity serves to regulate G1 length to adjust for changes in growth rate in different media.
The decrease in Cln3 protein levels in poor medium is in part due to postranscriptional effects, involving translational regulation as well as the Ras-cyclic AMP (cAMP) pathway (9, 20). The decrease in Cln3 protein levels also clearly involves a substantial decrease in CLN3 mRNA levels (10, 13). This is consistent with a system in which multiple inputs can regulate Cln3.
In this report, we describe a set of experiments intended to identify what types of nutrient signals regulate CLN3 transcription. We find that both fermentable carbon sources and nitrogen are required for maximum CLN3 mRNA expression. In contrast, limitation for sulfur, phosphorus, or cAMP, while arresting growth, does not decrease CLN3 transcript levels. We find that regulation of CLN3 transcription by glucose is sensitive to very low levels of glucose and is distinct from the processes that regulate glucose repression.
MATERIALS AND METHODS
Yeast strains and media.
The yeast strains used in this study were TW38 (isogenic to HR125 except Ura+; MATa leu2-3 leu2-112 trp1-1 his3-532 his4), TC41-1 (12) (isogenic to HR125 except Δcyr1; MATa leu2-3 leu2-112 ura3-52 trp1-1 his3-532 his4 cyr::URA3 cam), and DS10 (1) (wild type; MATa his3-11,15 leu2-3 leu2-112 lys1 lys2 ura3-52 Δtrp1). Cells were grown in liquid culture with vigorous shaking at 30°C in rich medium (yeast extract-peptone [YEP]) containing either glucose (YEPD; 1% yeast extract, 2% Bacto Peptone, 2% glucose) or ethanol (YEPEtOH; same as YEPD but with 2% ethanol in place of glucose) or in synthetic complete medium (SC) containing yeast nitrogen base (6.7 g/liter; Difco) supplemented with adenine, uracil, amino acids, and 2% glucose (24) except as noted. When necessary, cells were transferred to different media by spinning in a Beckman J6 centrifuge for 5 min at 3,000 rpm. For experiments involving nitrogen limitation, prototrophic yeast cells were grown in synthetic medium prepared with yeast nitrogen base without ammonium sulfate (Difco) and with no supplemental amino acids. For experiments involving sulfate limitation, the synthetic medium was made with chloride salts substituted for sulfate and methionine was omitted from the amino acid supplements. For low-phosphate medium, potassium chloride was substituted for potassium phosphate. Log-phase cells were growing rapidly at an optical density at 660 nm (OD660) of 1 or less.
Preparation of RNA and RNA blots.
RNA was prepared as previously described (5a). The RNA samples (15 μg/lane) were separated by formaldehyde agarose gel electrophoresis and transferred to a GeneScreen Plus membrane as instructed by the manufacturer (New England Nuclear). To ensure uniform loading and transfer of RNA, ethidium bromide was added to the samples prior to loading of the gel. Following blotting, ethidium-stained rRNA was visualized on the blots by UV illumination and photographed. The blots were probed with a 1-kb SacI/EcoRI fragment from CLN1, a 1-kb SacI/XhoI fragment from CLN2, a 1-kb EcoRI fragment from CLN3, a 1.4-kb BstXI/HindIII fragment from UBI4, a 0.5-kb EcoRI/PstI fragment from SSA3, or a 1.7-kb fragment from GAC1 as indicated. A 0.6-kb SacI fragment was used to probe for U2 RNA as a loading and transfer control. Probes were radiolabeled with 32P by the random primer method to a specific activity of 109 cpm/mg. Probes were used in quantities in excess over the RNA being measured.
RESULTS
Carbon source regulation of CLN3 mRNA levels.
Cells growing in log phase on glucose have substantially more CLN3 message than cells growing oxidatively after the diauxic shift (10). To compare CLN3 mRNA levels in log phase, postdiauxic growth, and stationary phase, we collected samples from a YEPD culture for RNA preparation at day 1 (log), days 2 and 3 (OD of 4 to 6, postdiauxic), and day 4 (OD of 10, stationary phase). The major change in CLN3 message levels occurred between day 1 and day 2, when CLN3 mRNA levels fell approximately sevenfold as cells moved from fermentative to oxidative growth. A small additional decrease of approximately twofold occurred between the postdiauxic phase and stationary phase (Fig. 1).
FIG. 1.

CLN3 expression decreases as cells end fermentative growth on glucose. (A) Wild-type cells (TW38) were grown in YEPD with shaking at 30°C, and samples were collected for RNA preparation and blotting at log phase (day 1, OD of 0.7), day 2 (OD of 4, postdiauxic), day 3 (OD of 6, postdiauxic), and day 4 (OD of 10, stationary phase). RNA blots were probed with a CLN3 probe and analyzed with a phosphorimager as described in Materials and Methods. (B) CLN3 mRNA levels normalized to the U2 loading controls and plotted graphically. The scale is arbitrary.
To determine whether the shift from glucose to ethanol metabolism at the diauxic shift could account for the decrease in CLN3 mRNA levels, we compared CLN3 mRNA levels in cells growing in several different carbon sources. Cells were grown in YEP medium containing either glucose, galactose, glycerol and lactate, or ethanol as the carbon source, and samples were collected for Northern blotting as each culture passed OD = 0.5, a point at which the cells are still early in log-phase growth. Cells in glucose or galactose had substantially higher levels of CLN3 message than cells in ethanol medium, while cells in glycerol-lactate had somewhat intermediate levels (Fig. 2). Fermentable carbon sources such as glucose, galactose, or fructose (not shown) consistently gave the highest levels of CLN3 mRNA, while nonfermentable carbon sources produced lower levels.
FIG. 2.

CLN3 mRNA levels are decreased in cells growing on nonfermentable carbon sources. Wild-type cells (DS10) were grown in YEPD to mid-log phase and transferred to YEP containing either 2% glucose, 2% galactose, 2% glycerol and 2% lactate, or 2% ethanol at an OD of 0.1. Samples were collected at the indicated times for density measurements (B) and, as they passed OD = 0.5, for RNA preparation and Northern blotting with a CLN3 probe (A). (C) CLN3 mRNA levels normalized to the U2 loading controls and plotted graphically. The scale is arbitrary.
Addition of glucose to postdiauxic-phase cells (OD of 5 to 7) consistently produced about a 5- to 10-fold increase in the levels of CLN3 mRNA within 5 min of glucose addition. This rapid and dramatic increase in CLN3 expression was not produced in response to any of the nonmetabolizable glucose analogs that we tested, including l-glucose, which is not transported into the cell, 6-deoxyglucose, which is transported but not phosphorylated, and 2-deoxyglucose, which can be transported and phosphorylated but does not enter glycolysis (Fig. 3). These results suggest that the signal affecting CLN3 expression is generated not directly by glucose but rather by some process that involves glucose metabolism such as glycolysis. We found that deletion of GCR1 produces cells that fail to induce CLN3 mRNA in response to glucose (not shown). Since GCR1 is required for the proper expression of many glycolytic genes (4), this result seems to be in agreement with the results of the experiments using glucose analogs, indicating that fermentation of glucose rather than the sugar itself is needed for induction of CLN3 mRNA levels.
FIG. 3.

Glucose analogs fail to stimulate CLN3 expression. (A) Wild-type cells (TW38) were grown in YEPD until they had exhausted glucose from the medium (36 h after inoculation, OD of 6), and then either d-glucose (G) or a nonmetabolizable glucose analog (2-deoxyglucose [2-deoxy]) was added to produce a final concentration of 2%. Control cells received an equivalent volume of water. Cells were incubated for the indicated time (minutes) and then collected for RNA blotting with a CLN3 probe as described in Materials and Methods. All lanes are from the same exposure of a single blot. Some irrelevant intervening lanes have been removed. (B) Cells were treated as described above with either d-glucose, l-glucose, or 6-deoxyglucose and then incubated with the added sugar for 30 min.
Changes in glucose concentrations in the growth medium have been linked to effects on intracellular cAMP. Addition of glucose to stationary-phase S. cerevisiae cells has been shown to produce a rapid increase in intracellular cAMP levels (6), while cAMP levels fall as cells deplete the glucose in the medium (7, 23). To determine whether changes in cAMP are required for the glucose regulation of CLN3 message levels, we used a strain (TC41) carrying a deletion in CYR1, in which we can manipulate cAMP levels. This strain carries a deletion of the internal EcoRI fragments from within the coding region of the CYR1 gene, the deletion has been confirmed by Southern blotting, the mutants have no adenylate cyclase activity, and they have no Cyr1 protein (12). The cells are dependent on exogenous cAMP in the medium and arrest in G1 as unbudded cells when cAMP is withdrawn from the medium. Using this cyr1 mutant strain, we found that CLN3 mRNA levels responded to glucose in the complete absence of cAMP (Fig. 4). In this experiment, cells were washed and incubated in synthetic medium without cAMP, and glucose levels were manipulated in the absence of added cAMP. These cells remained arrested in G1 as a population of unbudded cells (not shown). Cells washed in glucose medium without cAMP maintained high levels of CLN3 mRNA (lane A). However, when the cells were transferred to otherwise identical medium lacking glucose, CLN3 expression decreased dramatically (lane B). When glucose was added back to the cells, CLN3 message levels were quickly restored (lane C) despite the fact that no cAMP was included in the medium. Thus, CLN3 message levels respond dramatically to glucose in the absence of cAMP. An interesting additional point illustrated by this experiment is that although removal of cAMP caused the cells to arrest growth in G1, preventing the cells from growing did not appear to prevent CLN3 expression (see also below).
FIG. 4.
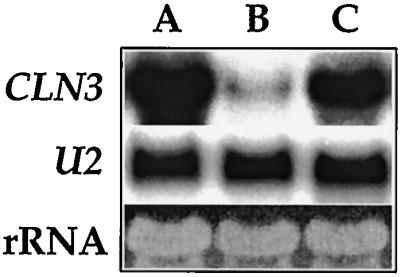
Glucose regulation of CLN3 expression is independent of cAMP. Cells carrying a CYR1 deletion (TC41-1) were grown to mid-log phase (OD of 1), and cAMP was then removed by washing the cells in SC (2% glucose) with no cAMP and resuspending them in this cAMP-free medium at an OD of 1. After 1 h, a sample was removed and the remaining cells were transferred to glucose-free SC with no cAMP at an OD of 1. After incubating without glucose for 4 h, another sample was collected and the remaining cells were again transferred into fresh SC (2% glucose) with no cAMP at an OD of 1 and incubated for an additional 30 min. The samples were used for RNA preparation and RNA blotting with a CLN3 probe. Lane A, RNA from cells after the 1-h incubation in fresh SC (2% glucose) without cAMP; lane B, RNA from cells after 4 h of starvation for glucose; lane C, RNA from glucose-starved cells after 30 min of reincubation in SC (2% glucose) without cAMP.
Glucose repression and CLN3.
We wanted to determine whether the signals produced by glucose that inhibit transcription of glucose-repressible genes might be in some way also involved in the induction of transcription by glucose. We found that glucose could induce CLN3 expression at levels that were lower than those required for glucose repression. When cells were transferred to YEP medium (containing no glucose), CLN3 mRNA levels fell very rapidly. At the same time, transfer to YEP caused the induction of a number of stress response genes that are repressed by glucose (Fig. 5). In contrast, transfer to YEP with 0.1% glucose, a level of glucose that allows derepression of many glucose-repressed transcripts, did not decrease CLN3 transcription even though the move produced an immediate derepression of UBI4 and GAC1. CLN3 transcripts remained at high levels for over an hour until glucose was depleted from the medium. We also examined cells carrying null mutations in genes that play a role in glucose repression, HXK2, MIG1, SNF1, and SNF4 (15), to determine whether genes involved in transmitting signals needed for repression of transcription might also be involved in glucose induction of transcription. None of these glucose mutations appeared to interfere with CLN3 message levels (not shown). These results indicate that the processes mediated by these genes are not necessary for glucose induction of CLN3 transcription. However, the signals generated by glucose that lead to repression of transcription are poorly understood. We therefore cannot rule out the possibility that common upstream signaling components, or events, produce both glucose induction of CLN3 and glucose repression of other genes.
FIG. 5.

CLN3 mRNA levels remain high at nonrepressing levels of glucose. Wild-type cells (TW38) were grown in SC medium (2% glucose) to mid-log phase (OD660 of 1), centrifuged, and resuspended at the same density in SC containing either no glucose, 0.1% glucose, or 2% glucose as a control. The cells were incubated for the indicated times (minutes) at 30°C before being harvested for RNA preparation and Northern blotting with the indicated probes.
Effects of nitrogen, sulfur, and phosphorus limitation on CLN3 expression.
In addition to regulating the cell cycle in response to glucose depletion, yeast cells also arrest growth in G1 in response to limitation for nitrogen, sulfur, or phosphorus. It therefore seemed possible that these nutrients also affect CLN3 mRNA levels. To test this, we passaged wild-type yeast cells through medium lacking either nitrogen, sulfur, or phosphorus until the cells stopped growing. We confirmed that the cells were indeed limited for the nutrient in question by demonstrating that the cells would resume growth in response to addition of that nutrient. We then determined whether CLN3 expression changes in these cells as they return to proliferative growth in response to fresh nutrients.
In the experiment shown in Fig. 6, cells were washed and incubated in nitrogen-free medium to deplete cellular nitrogen stores. The cells were then transferred to synthetic medium without nitrogen and grown overnight. During this incubation, the cells in the nitrogen-free medium grew less than one generation and arrested growth at an OD of approximately 0.4 (Fig. 6A, time zero). Samples from the nitrogen-starved cells showed reduced CLN3 message levels. When either ammonium chloride or amino acids were added as a source of nitrogen to the culture, growth resumed, demonstrating that nitrogen was limiting growth. This was accompanied by an increase in CLN3 message levels (Fig. 6B). As expected for cells arrested in G1, CLN1 and CLN2 mRNA levels were quite low in cells depleted of nitrogen and increased after the cells resumed proliferation in response to readdition of nitrogen.
FIG. 6.

CLN3 message levels are decreased by nitrogen starvation. Prototrophic wild-type yeast cells (S288C) were passaged through synthetic medium without nitrogen until nitrogen availability limited growth. These cells were then transferred at a final OD660 of 0.2 to synthetic medium without nitrogen and incubated overnight with shaking at 30°C. At time zero, the nitrogen-starved cells were divided and received either water as a control (filled squares in panel A; lanes −N in panel B), the amino acid supplements found in SC medium (filled triangles and lanes +aa), or 5 mg of ammonium chloride per ml (open squares and lanes +N). Samples were collected for OD readings (A) and RNA preparation (B) at the indicated times. RNA blots were probed for CLN1, CLN2, or CLN3 as described in Materials and Methods.
In contrast, when cells were grown in sulfur-free medium, CLN3 expression did not decrease (Fig. 7). In this experiment, cells were washed in sulfur-free medium and incubated for 8 h to reduce sulfur stores. The cells were then transferred to either sulfur-free synthetic medium or control medium with sulfur added and then allowed to grow overnight. As in the nitrogen starvation experiment, the cells in the control medium grew for several generations until they became limited for glucose, while the cells in the sulfur-free medium remained arrested for lack of sulfur (Fig. 7A, time zero). In contrast to the cells that had become glucose limited, the arrested cells in the sulfur-free medium had much higher CLN3 message levels. Although addition of sulfur to these cells allowed them to resume growth, CLN3 expression did not increase any further in these cells in response to sulfur addition. Over the course of several hours, the level of CLN3 message again declined as the growing culture depleted glucose from the medium at later time points. As expected for cells arrested in G1, CLN1 and CLN2 expression was very low in the cultures starved for sulfur.
FIG. 7.

CLN3 message levels are not decreased by starvation for sulfur. Wild-type cells (TW38) were passaged through sulfate-deficient medium until growth became limited by lack of sulfur. The cells were then transferred to sulfate-deficient medium to a final OD660 of 0.2 and grown overnight with shaking at 30°C (closed squares in panel A; lanes −S in panel B). For comparison and as a control to demonstrate sulfur limitation, cells were also transferred to synthetic medium with sulfate added. These cells grew overnight until they had depleted the glucose from the medium (open circles and lane −G). At time zero, sodium sulfate was added to a portion of the sulfate-limited culture to a final concentration of 1 mg/ml (open squares and lanes +S), and samples were collected for RNA blotting with a CLN1, CLN2, or CLN3 probe (B) or to monitor culture density at the indicated times (A).
Phosphorus limitation also seemed to have little, if any, effect on CLN3 mRNA levels (Fig. 8). As in the other experiments, cells were depleted of phosphorus and then incubated overnight either in phosphate-free medium or in control medium with phosphate to demonstrate phosphorus limitation. Phosphate-starved cells arrested growth but had substantially higher CLN3 mRNA levels than cells in the control culture that grew until they became limited for glucose (Fig. 8B, compare lanes −P and −G). Although addition of phosphate allowed the phosphorus-limited cells to resume growth, phosphate addition produced no further increase in CLN3 expression, and as seen in the other experiments, CLN3 expression gradually declined as the growing cells depleted glucose from the medium. Again, CLN1 and CLN2 message levels were very low in the cells arrested by phosphate depletion, consistent with a population of cells not passing Start.
FIG. 8.

CLN3 message levels are not decreased by starvation for phosphorus. Wild-type cells (TW38) were passaged through phosphate-deficient medium until growth became limited by lack of phosphorus. The cells were then transferred to phosphate-deficient medium at a final OD660 of 0.2 and grown overnight with shaking at 30°C (closed squares in panel A; lane −P in panel B). For comparison and as a control to demonstrate phosphorus limitation, cells were also transferred to synthetic medium with phosphate added. These cells grew overnight until they had depleted the glucose from the medium (open circles and lane −G). At time zero, potassium phosphate was added to a portion of the phosphate-limited culture to a final concentration of 1 mg/ml (open squares and lane +P), and samples were collected for RNA blotting with a CLN1, CLN2, or CLN3 probe (B) or to monitor culture density at the indicated times (A).
These experiments demonstrate that while glucose and nitrogen clearly affect CLN3 mRNA levels, lack of sulfur or phosphate does not. Thus, the two groups of nutrients are likely to affect cell cycle progression via different mechanisms. Additionally, these experiments show that CLN3 message levels are not affected by growth rate per se, in that sulfur or phosphorus limitation effectively stopped growth but failed to lower CLN3 mRNA levels. Thus, growth arrest in response to nutrient limitation is not sufficient to prevent CLN3 mRNA accumulation.
DISCUSSION
Nutrients and the cell cycle.
The need to coordinate the rate of cellular growth in mass and volume with the rate of progress through the cell division cycle has been recognized for many years (11). Because nutrient availability places major constraints on the rate of cellular growth, nutrients must in some way also regulate progression through the cell cycle. The fact that yeast cells grow at vastly different rates on different media with only modest changes in cell size tells us that such coordination indeed takes place. Most of the normal regulation of the cell cycle in response to differing growth rates occurs at the G1-to-S boundary. Measurements of cell cycle progression show that the G1 phase of the cell cycle lengthens as cells grow more slowly in poor medium and contracts as cells grow more rapidly in rich medium (14). It should be noted that nutrient regulation of G1, at least in mother cells, is independent of cell size. Nutrients affect the cell cycle length of mother cells almost as much as daughter cells (10, 16), and both for mother cells and for daughter cells that are above the normal size for bud emergence, size is not correlated with G1 length. In these populations of cells, larger cells are no more likely than smaller cells to pass Start (16, 17, 30).
Role of CLN3.
The fact that nutrients can regulate the length of G1 suggests that nutrients in some way influence the activity of the cyclin-dependent Cdc28 kinase that is thought to regulate Start. Recent reports have shown that Cln3 protein levels are increased in cells growing in rich medium (10), a process that involves both transcriptional and posttranscriptional regulation (9, 10, 20). These results, taken together with those of past experiments showing that manipulation of CLN3 expression can affect the timing of Start, support a model in which nutrients that allow rapid growth in size also increase CLN3 expression to promote rapid progress through the cell cycle.
The relative importance between transcriptional and posttranscriptional mechanisms for regulating CLN3 expression remains to be determined; however, manipulation of CLN3 mRNA levels has consistently been shown to produce changes in the timing of Start (5, 18a, 25–27). In addition, the leaky scanning mechanism for decreasing Cln3 translation in poor medium proposed by Polymenis and Schmidt (20) would be expected to work in concert with the decreases in message levels that we report here. It seems likely that regulation of both transcription and translation contributes to the decrease in Cln3 protein levels observed in cells growing on poor medium.
As an initial step in understanding the processes that regulate CLN3 expression, we have sought to identify the nutrient signals that regulate CLN3 transcription. We find that maximal induction of CLN3 mRNA levels requires a fermentable carbon source and a source of nitrogen. Surprisingly, other factors that are necessary for growth, sulfur, phosphorus, and cAMP, are not needed for high-level expression of CLN3 message. Thus, while nutrients that promote rapid growth in cellular size are needed for the highest levels of CLN3 message, growth itself is not. These results and experiments with glucose analogs suggest that a signal regulating CLN3 mRNA levels is in some way generated by glycolytic metabolism. The lack of glucose induction of CLN3 message in gcr1 mutants, which are defective in the transcription of a number of genes involved in glycolysis (4), also points to a signal generated by glucose metabolism. The decrease in CLN3 expression upon nitrogen depletion suggests the possibility that CLN3 expression is regulated by a metabolic pathway that involves both glucose and nitrogen, such as amino acid synthesis. In this regard, it is worth noting that a connection between the biosynthesis of charged tRNA and regulation of Start has been previously proposed (28).
Glucose appears to regulate CLN3 message at the level of transcription. In addition to finding that a portion of the CLN3 promoter can drive glucose-dependent expression of reporter genes, we have observed that glucose addition does not significantly alter the half-life of the CLN3 message (19a).
Regulation of CLN3 and the cell cycle as part of a global regulatory process.
As cells deplete glucose from the medium and enter the postdiauxic phase of growth, both mRNA synthesis and protein synthesis dramatically fall (2, 3, 8). This has been termed a global change in transcription, but that term must be carefully qualified. Although transcription of most messages decreases, transcription of many other messages, most notably those that are repressed by glucose, actually increases (15, 29). In addition, the levels of some messages seem to remain constant. This finding suggests that the activity of RNA polymerase II is not simply shut off but rather is turned down for one class of messages and redirected toward others. The finding that so many messages are affected by this process lends itself to the idea that it is not specific, but again caution is in order. Glucose affects so many aspects of yeast metabolism and growth that one might well expect that a proper and specific response to changes in carbon source would indeed involve regulation on a very wide scale. Much of the observed decrease in transcription in response to glucose depletion is consistent with keeping metabolic demand in line with the availability of nutrients and energy. Although it is plausible that all or most of this global change in transcription serves such a purpose, we simply do not know how many of these changes have functional significance. Slowing down cell division is one obvious response to decreased nutrient availability.
Evidence for other mechanisms coupling nutrients and the cell cycle.
While our results point to a role for the transcriptional regulation of CLN3 in controlling G1 length in response to changing nutrients, several other results indicate that other mechanisms also play important roles in this process. Glucose and other fermentable sugars have long been known to regulate intracellular cAMP (6), which in turn has been shown to be necessary for progress through Start (18). We have reported that cAMP plays a positive role in transcription of Start-specific genes, most notably CLN1 and CLN2 (13), and more recently we have found that cAMP positively regulates Cln3 protein levels at the posttranscriptional level (9). Polymenis and Schmidt have recently shown that rich medium increases the translation of Cln3 (20). Beyond that, there is evidence for transcriptional regulation of CDC28 and BCK2, genes that are also involved in regulating the timing of Start (10). While not lending themselves to a simple model, these results illustrate the potential for multiple levels of input for linking nutrient signals with regulation of cell cycle progression.
ACKNOWLEDGMENTS
We thank Kelly Tatchell, Bonnie Baxter, Elizabeth Craig, Dennis Thiele, Henry Baker, and Michael Holland for providing strains and plasmids.
This work was supported by Public Health Service grant GM42406 from the National Institutes for Health.
REFERENCES
- 1.Boorstein W R, Craig E A. Transcriptional regulation of SSA3, an HSP70 gene from Saccharomyces cerevisiae. Mol Cell Biol. 1990;10:3262–3267. doi: 10.1128/mcb.10.6.3262. [DOI] [PMC free article] [PubMed] [Google Scholar]
- 2.Choder M. A general topoisomerase I-dependent transcriptional repression in the stationary phase of yeast. Genes Dev. 1991;5:2315–2326. doi: 10.1101/gad.5.12a.2315. [DOI] [PubMed] [Google Scholar]
- 3.Choder M, Young R A. A portion of the RNA polymerase II molecules has a component essential for stress responses and stress survival. Mol Cell Biol. 1993;13:6984–6991. doi: 10.1128/mcb.13.11.6984. [DOI] [PMC free article] [PubMed] [Google Scholar]
- 4.Clifton D, Weinstock S B, Fraenkel D G. Glycolysis mutants in Saccharomyces cerevisiae. Genetics. 1977;88:1–11. doi: 10.1093/genetics/88.1.1. [DOI] [PMC free article] [PubMed] [Google Scholar]
- 5.Cross F. DAF1, a mutant gene affecting size control, pheromone arrest, and cell cycle kinetics of Saccharomyces cerevisiae. Mol Cell Biol. 1988;8:4675–4684. doi: 10.1128/mcb.8.11.4675. [DOI] [PMC free article] [PubMed] [Google Scholar]
- 5a.Ellwood M S, Craig E A. Differential regulation of the 70K heat shock gene and related genes in Saccharomyces cerevisiae. Mol Cell Biol. 1984;4:1454–459. doi: 10.1128/mcb.4.8.1454. [DOI] [PMC free article] [PubMed] [Google Scholar]
- 6.Eraso P, Gancedo J P. Use of glucose analogues to study the mechanism of glucose-mediated cAMP increase in yeast. FEBS Lett. 1985;191:51–54. [Google Scholar]
- 7.François J, Eraso P, Gancedo C. Changes in the concentration of cAMP, fructose 2,6-biphosphate and related metabolites and enzymes in Saccharomyces cerevisiae during growth on glucose. Eur J Biochem. 1987;164:369–373. doi: 10.1111/j.1432-1033.1987.tb11067.x. [DOI] [PubMed] [Google Scholar]
- 8.Fuge E K, Braun E L, Werner-Washburne M. Protein synthesis in long-term stationary-phase cultures of Saccharomyces cerevisiae. J Bacteriol. 1994;176:5802–5813. doi: 10.1128/jb.176.18.5802-5813.1994. [DOI] [PMC free article] [PubMed] [Google Scholar]
- 9.Hall, D. D., D. D. Markwardt, and W. Heideman. Positive regulation of Cln3/Cdc28 activity by the Ras/cAMP pathway in Saccharomyces cerevisiae. Submitted for publication.
- 10.Hall, D. D., D. D. Markwardt, F. Parviz, and W. Heideman. Nutrients regulate Cln3/Cdc28 activity and G1 length in Saccharomyces cerevisiae. Submitted for publication.
- 11.Hartwell L H. Saccharomyces cerevisiae cell cycle. Bacteriol Rev. 1974;38:164–198. doi: 10.1128/br.38.2.164-198.1974. [DOI] [PMC free article] [PubMed] [Google Scholar]
- 12.Heideman W, Casperson G F, Bourne H R. Adenylyl cyclase in yeast: antibodies and mutations identify a regulatory domain. J Cell Biochem. 1990;42:229–242. doi: 10.1002/jcb.240420406. [DOI] [PubMed] [Google Scholar]
- 13.Huble L, Bradshaw-Rouse J, Heideman W. Connections between the Ras-cyclic AMP pathway and G1 cyclin expression in the budding yeast, Saccharomyces cerevisiae. Mol Cell Biol. 1993;13:6274–6282. doi: 10.1128/mcb.13.10.6274. [DOI] [PMC free article] [PubMed] [Google Scholar]
- 14.Jagadish M N, Carter B L A. Genetic control of cell division in yeast cultured at different growth rates. Nature. 1977;269:145–147. doi: 10.1038/269145a0. [DOI] [PubMed] [Google Scholar]
- 15.Johnston M, Carlson M. Regulation of carbon and phosphate utilization. In: Jones E W, Broach J R, editors. The molecular and cellular biology of the yeast Saccharomyces: gene expression. Vol. 2. Cold Spring Harbor, N.Y: Cold Spring Harbor Laboratory Press; 1992. pp. 193–281. [Google Scholar]
- 16.Lord P, Wheals A. Variability in individual cell cycles of Saccharomyces cerevisiae. J Cell Sci. 1981;50:361–376. doi: 10.1242/jcs.50.1.361. [DOI] [PubMed] [Google Scholar]
- 17.Lord P, Wheals A. Rate of cell cycle initiation of yeast cells when cell size is not a rate-determining factor. J Cell Sci. 1983;59:183–201. doi: 10.1242/jcs.59.1.183. [DOI] [PubMed] [Google Scholar]
- 18.Matsumoto K, Uno I, Ishikawa T. Control of cell division in Saccharomyces cerevisiae mutants defective in adenylate cyclase and cAMP-dependent protein kinase. Exp Cell Res. 1983;146:151–161. doi: 10.1016/0014-4827(83)90333-6. [DOI] [PubMed] [Google Scholar]
- 18a.Nash R, Tokiwa G, Anand S, Erickson K, Futcher A B. The WHI1 gene of Saccharomyces cerevisiae tethers cell division to cell size and is a cyclin homolog. EMBO J. 1988;7:4335–4346. doi: 10.1002/j.1460-2075.1988.tb03332.x. [DOI] [PMC free article] [PubMed] [Google Scholar]
- 19.Nasmyth K. Control of the yeast cell cycle by the Cdc28 protein kinase. Curr Opin Cell Biol. 1993;5:166–179. doi: 10.1016/0955-0674(93)90099-c. [DOI] [PubMed] [Google Scholar]
- 19a.Parviz, F., and W. Heideman. Unpublished data.
- 20.Polymenis M, Schmidt E V. Coupling cell division to cell growth by translational control of the G1 cyclin CLN3 in yeast. Genes Dev. 1997;11:2522–2531. doi: 10.1101/gad.11.19.2522. [DOI] [PMC free article] [PubMed] [Google Scholar]
- 21.Pringle J R, Hartwell L H. The Saccharomyces cerevisiae cell cycle. In: Jones E W, Broach J R, editors. The molecular biology of the yeast Saccharomyces cerevisiae: life cycle and inheritance. Cold Spring Harbor, N.Y: Cold Spring Harbor Laboratory Press; 1981. pp. 97–142. [Google Scholar]
- 22.Reed S I, Hadwiger J A, Lörincz A T. Protein kinase activity associated with the product of the yeast cell division cycle gene CDC28. Proc Natl Acad Sci USA. 1985;82:4055–4059. doi: 10.1073/pnas.82.12.4055. [DOI] [PMC free article] [PubMed] [Google Scholar]
- 23.Russell M, Bradshaw-Rouse J, Markwardt D, Heideman W. Changes in gene expression in the Ras/adenylate cyclase system of Saccharomyces cerevisiae: correlation with cAMP levels and growth arrest. Mol Biol Cell. 1993;4:757–765. doi: 10.1091/mbc.4.7.757. [DOI] [PMC free article] [PubMed] [Google Scholar]
- 24.Sherman F. Getting started with yeast. Methods Enzymol. 1991;194:3–21. doi: 10.1016/0076-6879(91)94004-v. [DOI] [PubMed] [Google Scholar]
- 25.Stuart D, Wittenberg C. CLN3, not positive feedback, determines the timing of CLN2 transcription in cycling cells. Genes Dev. 1995;9:2780–2794. doi: 10.1101/gad.9.22.2780. [DOI] [PubMed] [Google Scholar]
- 26.Tyers M, Tokiwa G, Futcher B. Comparison of the Saccharomyces cerevisiae G1 cyclins: Cln3 may be an upstream activator of Cln1, Cln2 and other cyclins. EMBO J. 1993;12:1955–1968. doi: 10.1002/j.1460-2075.1993.tb05845.x. [DOI] [PMC free article] [PubMed] [Google Scholar]
- 27.Tyers M, Tokiwa G, Nash R, Futcher B. The Cln3-Cdc28 kinase complex of S. cerevisiae is regulated by proteolysis and phosphorylation. EMBO J. 1992;11:1773–1784. doi: 10.1002/j.1460-2075.1992.tb05229.x. [DOI] [PMC free article] [PubMed] [Google Scholar]
- 28.Unger M W, Hartwell L H. Control of cell division in Saccharomyces cerevisiae by methionyl-tRNA. Proc Natl Acad Sci USA. 1976;73:1664–1668. doi: 10.1073/pnas.73.5.1664. [DOI] [PMC free article] [PubMed] [Google Scholar]
- 29.Werner-Washburne M, Braun E, Johnston G C, Singer R A. Stationary phase in the yeast Saccharomyces cerevisiae. Microbiol Rev. 1993;57:383–401. doi: 10.1128/mr.57.2.383-401.1993. [DOI] [PMC free article] [PubMed] [Google Scholar]
- 30.Wheals A E. Size control models of Saccharomyces cerevisiae cell proliferation. Mol Cell Biol. 1982;2:361–368. doi: 10.1128/mcb.2.4.361. [DOI] [PMC free article] [PubMed] [Google Scholar]