

Abstract
Acetylcholinesterase (AChE) and butyrylcholinesterase (BChE) play important roles in human neurodegenerative disorders such as Alzheimer's disease. In this study, machine learning methods were applied to develop quantitative structure-activity relationship (QSAR) models for the prediction of novel AChE and BChE inhibitors based on data from quantitative high-throughput screening (qHTS) assays. The models were used to virtually screen an in-house collection of ~360K compounds. The optimal models achieved good performance with area under the receiver operating characteristic curve (AUC-ROC) values ranging from 0.83 ± 0.03 to 0.87 ± 0.01 for the prediction of AChE/BChE inhibition activity and selectivity. Experimental validation showed that the best performing models increased the assay hit rate by several folds. We identified 88 novel AChE and 126 novel BChE inhibitors, 25% (AChE) and 53% (BChE) of which showed potent inhibitory effects (IC50 < 5 μM). In addition, structure-activity relationship (SAR) analysis of the BChE inhibitors revealed scaffolds for chemistry design and optimization. In conclusion, machine learning models were shown to efficiently identify potent and selective inhibitors against AChE and BChE, and novel structural series for further design and development of potential therapeutics against neurodegenerative disorders.
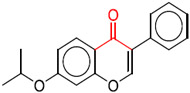
Graphical Abstract

Introduction
Acetylcholinesterase (AChE; EC 3.1.1.7) and butyrylcholinesterase (BChE; EC 3.1.1.8) play significant roles in maintaining normal cholinergic neurotransmission by catalyzing the hydrolysis of acetylcholine (ACh) into choline and acetate in the synaptic cleft. In some neurodegenerative disorders, such as Alzheimer's disease (AD), the decrease of ACh in the hippocampal and cortical regions of the brain is further amplified by the catalytic hydrolysis of AChE/BChE 1, 2. Some AChE/BChE inhibitors, e.g., rivastigmine (a dual inhibitor of AChE and BChE for the treatment of AD), have been approved by the U.S. Food and Drug Administration (FDA) for clinical use to relieve the symptoms of these diseases related to ACh deficiency 3-6. Because AChE and BChE are therapeutic targets responsible for the early and advanced stages of AD 7, respectively, selective inhibitors of AChE or BChE could provide more effective and precise therapeutics for AD treatment. For example, galantamine, an FDA-approved drug, may be more suitable for patients with mild-to-moderate stages of AD because of its potent and selective inhibition of AChE activity (50-fold versus BChE) 8. To date, only 15 AChE inhibitors have been investigated in clinical trials with 10 approved (https://go.drugbank.com/bio_entities/BE0000426) for clinical use according to DrugBank (Version 5.1.9) 9. Therefore, identification of additional AChE/BChE selective inhibitors will help to expand the options available for the treatment of AD and other neurodegenerative diseases.
Quantitative high-throughput screening (qHTS) is a powerful tool for the identification of novel lead compounds for various molecular targets. The qHTS was applied to identify AChE/BChE inhibitors using two cell-free enzyme assays, a colorimetric and a fluorescence- based assay, at the National Center for Advancing Translational Sciences (NCATS) of the U.S. National Institutes of Health (NIH) 10. The colorimetric assay uses an optimized Ellman's method, in which the absorption intensity of the 5,5'-dithiobis-(2-nitrobenzoic acid) adduct was used to measure the AChE/BChE activity. Compared to the colorimetric assay, the fluorescence-based assay is a more sensitive method, in which the fluorescence intensity of Thiolite Green was used to measure the AChE/BChE activity. However, it is costly to screen large chemical libraries consisting of tens of thousands to millions of compounds using these two assays.
Machine learning based quantitative structure-activity relationship (QSAR) models, a practical and effective alternative to traditional wet lab experiments, have been leveraged to virtually screen large chemical libraries for the identification of AChE/BChE active inhibitors11, 12. However, there is still a lack of machine learning models for the prediction of selective AChE/BChE inhibitors. The AChE/BChE qHTS assay data provides a robust dataset for the development of machine learning models to predict small molecule activity and selectivity against AChE/BChE. A well-known class of compounds that can act as AChE/BChE inhibitors is organophosphates, which are commonly used in pesticides 13, 14 Screening a large diverse compound library may reveal new chemical scaffolds that are more suitable for therapeutic development.
In this study, we applied machine learning methods to build QSAR models for the prediction of compound activity and selectivity against AChE/BChE. The optimal models were employed to virtually screen a large library of ~360K diverse compounds. The models identified potent lead compounds that were experimentally confirmed. A structure-activity relationship (SAR) analysis in addition revealed new chemical scaffolds for further chemistry optimization. The findings of this study provided efficient strategies for the development of lead compounds based on AChE/BChE inhibitors.
Materials and Methods
Materials
The Amplite™ colorimetric assay kit (Ellman assay) and fluorescence assay kit (Green Fluorescence) for measuring AChE/BChE inhibitory activity were purchased from AAT Bioquest, Inc. (Sunnyvale, CA, USA). The purified recombinant human AChE protein was purchased from Sigma-Aldrich Co. (St. Louis, MO, USA). The purified recombinant human BChE protein was purchased from R&D Systems, Inc. (Minneapolis, MN, USA). The purity of lead compounds was determined to be greater than 95% by HPLC and copies of the HPLC traces were provided in Figure S1.
AChE Inhibition Assay
The AChE inhibition assay was performed according to protocols described in a previous study 15. Briefly, the recombinant human AChE (50 mU/mL for the colorimetric assay, or 20 mU/mL for the fluorescence assay) was dispensed at 4 μL/well into 1536-well black wall/solid bottom plates (Greiner Bio-One North America, Monroe, NC, USA). The test compounds or controls (23 nL) were transferred into the assay plates, and then incubated at room temperature for 30 min. Next, 4 μL of the colorimetric or the fluorescent detection cocktail solution was added to each well. The final DMSO concentration in each well was 0.29%. After incubation at room temperature for another 10 min, the absorbance readout (excitation = 405 nm) or the fluorescence readout (excitation = 490 nm, emission = 520 nm) of the assay plates were measured. Compounds were tested at 7- or 11- concentrations starting at the top concentration of 57.5 μM in a 1:3 titration for the colorimetric and fluorescence assay, respectively.
BChE Inhibtion Assay
The BChE inhibition assay was performed according to a previous study 10. Briefly, the recombinant human BChE (50 mU/mL for the colorimetric assay, or 10 mU/mL for the fluorescence assay) was dispensed at 4 μL/well into 1536-well black wall/solid bottom plates (Greiner Bio-One North America, Monroe, NC, USA). BChE in the presence of 0.05% Triton was used in a parallel colorimetric assay to exclude the aggregation of compounds. The test compounds or controls (23 nL) were transferred into the assay plates. After incubation at room temperature for 30 min, 4 μL of the colorimetric or the fluorescent detection cocktail solution was added to each well. The final DMSO concentration in each well was 0.29%. After incubation at room temperature for another 10 min, the absorbance readout (excitation = 405 nm) or the fluorescence readout (excitation = 480 nm, emission = 540 nm) of assay plates were measured. Compounds were tested at 7- or 11- concentrations starting at the top concentration of 57.5 μM in a 1:3 titration for the colorimetric and fluorescence assay, respectively.
Chemical Structure Processing
Chemical structures were converted to 729-bit fingerprints where the presence or absence of a particular substructure within a given compound was represented by a 1 or 0, respectively, using the publicly available ChemoTyper application (https://chemotyper.org/) with the chemotype feature set (V2.0_r711.XML) 16. The structural features significantly associated with AChE/BChE activity were determined using the Fisher's exact test, and a P value < 0.05 was considered statistically significant. Structural similarity between any two compounds was determined by calculating the Tanimoto Coefficient (TC), which ranges from 0 (no similarity) to 1 (maximum similarity).
Machine Learning Modeling
The machine learning modeling process was carried out according to protocols described in previous studies 17-21. Briefly, the overall modeling process consisted of three major steps: feature selection, data balancing, and model construction and evaluation. The feature selection process was performed using four methods, including Fisher’s exact test with P values ranging from 0.01 to 0.05 with intervals of 0.01, area under the receiver operating characteristic curve (AUC-ROC) values ranging from 0.52 to 0.58 with intervals of 0.02, importance scores from Random Forests (RF) and eXtreme Gradient Boosting (XGboost) algorithms ranging from the top 10 to top 50 with an interval of 10 using the “Random Forest” and “xgboost” packages, respectively. The data balancing process was performed using four sampling methods, including Down sampling, Up sampling, Random Over Sampling Examples (ROSE) using the “ROSE” package, and Synthetic Minority Over-sampling Technique (SMOTE) using the “DMwR” packages 22. Five machine learning-based classification models, including Naïve Bayes (NB) and Support Vector Machine (SVM) using the “e1071” package, Neural Networks (NNET) using the “nnet” package, RF using the “Random Forest” package, and XGboost using the “xgboost” package 23, were built. Implementation of the NB classifier was adapted with the settings of Laplace smoothing, and the Gaussian Radial Basis Function kernel was used for the SVM classifier. In addition, the other parameters of the SVM, RF, and NNET classifiers were set to default values. The parameters of the XGboost classifier were set as follows: maximum depth of a tree, 3; control the learning rate, 0.01; and subsample ratio of columns when constructing each tree, 0.5. All combinations of the four feature selection methods and five machine learning algorithms, i.e., a total of 20 combinations, were tested to construct models for each activity endpoint (e.g., AChE inhibition). The model performance was measured by AUC-ROC and balanced accuracy (BA) using the “ROCR” and “pROC” packages and Matthews correlation coefficient (MCC) using the “mltools” package. Each model was evaluated by an internal 3-fold cross validation and was repeated 20 times. The whole machine learning modeling process was carried out in R version 4.1.3.
Virtual Screening of Compound Libraries
The optimal models were applied to virtually screen the NCATS in-house collection of ~360K compounds for AChE/BChE activity and selectivity. Compounds with a predicted probability > 0.5 for a specific outcome were further clustered based on structural similarity using the k-means (k = 100) algorithm. The compounds with the highest probabilities in each cluster were selected for experimental validation.
Statistical Analysis
qHTS assay data were analyzed according to protocols described in previous studies 24-26. Curve rank, ranging from −9 and 9, was used as a measure of compound activity. Inhibitors were assigned negative curve ranks and activators were assigned positive curve ranks. A curve rank of 0 means inactive. For modeling purposes, compounds with curve rank values < 0 were set as active (1), and inactive (0) otherwise. The AChE/BChE activity assignments for all the compounds in the original qHTS assays are provided in Table S1. Example concentration-response curves from experimental validation were fit using the four-parameter logistic regression method, with the % assay activity as the response and log10 compound concentration as the independent variable, within the “drc” statistical package in R. Plots were generated using the “ggplot2” package in R. Representative chemical structures were drawn using the ChemDraw Professional software (version 17.1).
Results
AChE/BChE Activity and Selectivity Dataset
The compounds in the Toxicology in the 21st Century (Tox21) 10K compound library, which includes drugs and environmental chemicals, were screened for AChE inhibition (6,995) 27, while the BChE qHTS assays screened compounds from known bioactive collections including drugs and drug-like molecules (7,292) 10. The AChE and BChE screening collections have 2,195 compounds in common, which are mostly approved and investigational drugs (Figure 1A, and Table S1). For both assays, the number of active compounds (i.e., inhibitors) was much smaller than the number of inactive compounds, resulting in an active rate of 6.8% for the AChE assay and 10.5% for the BChE assay, respectively. The compounds were further divided into two subcategories: those tested in either the AChE or BChE assay only, and those tested in both the AChE and BChE assays. The former category included 251 active and 4,549 inactive compounds in the AChE assay, and 393 active and 4,704 inactive compounds in the BChE assay. The compounds in the latter category were used to determine the selectivity of compounds for AChE or BChE (Figures 1B). Compounds (98) that were active inhibitors of AChE and inactive against BChE were considered AChE selective inhibitors. Compounds (201) that were active inhibitors of BChE and inactive against AChE were considered BChE selective inhibitors (Figure 1A, and Table S1). The detailed list of 2,195 compounds that constitute the AChE/BChE selectivity dataset was provided in Table S1, which contains 4.5% AChE selective inhibitors, and 9.2% BChE selective inhibitors.
Figure 1.

Original AChE/BChE quantitative high-throughput screening (qHTS) assay data. (A) Compound activity distribution in the AChE/BChE qHTS assays. (B) Definition of AChE and BChE selectivity.
To assess the structural similarity between different datasets, we calculated the max TC values within the active inhibitors and between the active inhibitors and the inactives for each AChE and BChE dataset. The max TC of a compound is the TC between this compound and the compound that is the most similar to this compound in a dataset. We found that the average max TC values (AmaxTCs) among the active inhibitors were much larger than that between the active inhibitors and inactive compounds in each AChE/BChE activity or selectivity dataset (Figure S2), indicating that the active inhibitors are more similar to each other than the inactive compounds, i.e., active compounds and inactive compounds are structurally distinguishable and well separable.
Predictive Models and Significant Chemical Features
We applied five different machine learning algorithms, i.e., NB, NNET, RF, SVM, and XGboost, to build predictive models for AChE/BChE inhibitors (activity) and selective inhibitors (selectivity). Model performance was measured by AUC-ROC, BA and MCC, the optimal values of which followed the same trend for each model (Figure 2A, Table S2), e.g., when the AUC-ROC value was large, the BA and MCC showed large values as well. As the primary measure of model performance, the AUC-ROC values varied depending on the type of feature selection method, data rebalancing approach, and the machine learning classification algorithm (Table S2). Figure 2A shows the performance of the optimal model from the five machine learning algorithms for each dataset, the AUC-ROC values of which ranged from 0.74 to 0.87. Furthermore, the best classification algorithm for each dataset was as follows: XGboost (feature selection method: XGboost; data rebalancing approach: original) for AChE activity dataset (AUC-ROC value = 0.86±0.02); RF (feature selection method: Fisher’s exact test; data rebalancing approach: original) for BChE activity dataset (AUC-ROC value = 0.87±0.01); SVM (feature selection method: XGboost; data rebalancing approach: original) for AChE selectivity dataset (AUC-ROC value = 0.83±0.03); and RF (feature selection method: XGboost; data rebalancing approach: original) for BChE selectivity dataset (AUC-ROC value = 0.87±0.02) (Table S2). The number of features involved in the optimal model for predicting each target and activity type varied, i.e., 105 features were used in the AChE inhibitor prediction model, 50 features in the BChE inhibition model, 40 features in the AChE selectivity model, and 69 features used in the BChE selectivity model (Figure 2B, and Table S3). In addition, the top five most significant structural features for each AChE/BChE activity and selectivity model are provided in Table 1, e.g., “bond: P═O_phosphorus_oxo” (P value =3.73×10⁻¹⁵) for AChE activity, “group: carbohydrate_pentopyranose” (P value <10−20) for BChE activity, “bond: P═O_phosphate_dithio” (P value =9.14×10⁻⁵) for AChE selectivity, and “ring: hetero_[6]_N_piperidine” (P value =4.23×10⁻⁶) for BChE selectivity. Some features were found to be significant for multiple AChE/BChE activity and selectivity data types, for example, the feature “bond: C(═O)N_carboxamide_generic” is significant for AChE activity, AChE selectivity, and BChE selectivity, and “bond:CN_amine_ter-N_aliphatic” is significant for all AChE/BChE activity and selectivity data types. More details on the significant features can be found in Table S4.
Figure 2.

Optimal machine learning models and virtual screening. (A) Performance of the best model from each machine learning algorithm measured by the area under the receiver operating characteristic curve (AUC-ROC), balanced accuracy (BA) and Matthews correlation coefficient (MCC). Results are presented as mean ± standard deviation (SD), and the error bars represent the SD of 20 model iterations. The asterisk indicates the model with the maximum AUC-ROC value, BA, or MCC. (B) The distribution of features selected for each optimal model indicated by AUC-ROC value. (C) Comparison of hit rates between the original qHTS assay and the model prediction. The model predictions were experimentally validated using the colorimetric assay (Ellman assay).
Table 1.
Top chemical features (red) significant for AChE/BChE activity and/or selectivity.
| Dataset | Feature | P value | Representative structure |
|---|---|---|---|
| AChE activity | bond:P═O_phosphorus_oxo | 3.73×10⁻¹⁵ |

|
| group:ligand_path_5_tridentate_3-hydroxycadaverine | 1.57×10⁻⁵ |

|
|
| bond: quatP_phosphonium | 1.95×10⁻⁵ |

|
|
| bond:S═O_sulfonyl_S_(connect_Z=2) | 2.97×10⁻⁵ |

|
|
| bond:P~N_generic | 3.01×10⁻⁴ |

|
|
| BChE activity | group: carbohydrate_pentopyranose | <10−20 |

|
| bond:COH_alcohol_allyl | 3.64×10⁻¹³ |

|
|
| ring:hetero_[6_6_6]_O_benzopyran_dibenzo[b_e] | 1.31−10−2 |

|
|
| bond:CX_halide_aromatic-X_halo_phenol_meta | 1.34×10⁻² |

|
|
| bond:P═O_phosphonate_aliphatic_ester | 2.14×10⁻² |

|
|
| AChE selectivity | bond:P═O_phosphate_dithio | 9.14 ×10⁻⁵ |

|
| bond:C#N_nitrile | 3.63×10⁻³ |

|
|
| bond:CC(═O)C_ketone_aliphatic_acyclic | 3.12×10⁻² |

|
|
| ring:hetero_[5]_O_furan | 3.16×10⁻² |

|
|
| bond:NN_hydrazine_alkyl_generic | 4.55×10⁻² |

|
|
| BChE selectivity | ring:hetero_[6]_N_piperidine | 4.23×10⁻⁶ |

|
| bond:CC(═O)C_ketone_alkane_cyclic | 7.17×10⁻⁶ |
|
|
| ring:fused_steroid_generic_[5_6_6_6] | 1.40×10⁻⁴ |

|
|
| ring:hetero_[7]_generic_1-Z | 2.30×10⁻⁴ |

|
|
| ring:hetero_[6_6_6]_N_S_phenothiazine | 5.00×10⁻⁴ |

|
Experimental Validation and Orthogonal Confirmation
A total of 2,762 structurally diverse compounds with a predicted probability >0.5 was selected for experimental validation using the colorimetric assay, including 789 compounds for AChE inhibition, 465 compounds for BChE inhibition, 785 compounds for AChE selectivity, and 723 compounds for BChE selectivity (Table S5, and Table S6). Compared with the original qHTS assay hit rates, the optimal prediction models were found to significantly increase the assay hit rates, i.e., a 3.6-fold increase (from 6.4% to 23.3%) for the AChE inhibition assay and a 7.3-fold increase (from 9.5% to 68%) for the BChE inhibition assay. The number of selective inhibitors was also significantly enriched in the model predicted compounds. The AChE selectivity dataset used to train the AChE selectivity models contained 4.5% AChE selective inhibitors, while 8.9% the model predicted compounds were experimentally confirmed as true AChE selective inhibitors, corresponding to a 2-fold increase in hit rate. Similarly, for BChE selectivity, the model training dataset contained 9.2% selective inhibitors while 44% of the model predictions were experimentally confirmed as BChE selective inhibitors, corresponding to a 4.8-fold increase in hit rate for the identification of BChE selective inhibitors (Figure 2C). Some of the model identified AChE/BChE inhibitors confirmed in the colorimetric assay were further tested in the orthogonal fluorescence-based assay (Table S7). For example, 88 AChE inhibitors active in the colorimetric assay remained active in the fluorescence-based assay, yielding a confirmation rate of 87% (Figure 3A). Of the AChE inhibitors confirmed in the fluorescence assay, 7 were known drugs or bioactive compounds that were not previously identified as AChE inhibitors, while the other 81 inhibitors were diverse compounds with no previously reported biological activity (Table S7). Moreover, 22 (25%) compounds showed potent AChE inhibition in the fluorescence assay with IC50s < 5 μM, with 4 AChE inhibitors showing IC50s <1 μM (Table S7). The most potent novel AChE inhibitor was NCGC00526830 with an IC50 of 0.13±0.02 μM. Of the 127 BChE inhibitors identified in the colorimetric assay, 126 also showed inhibitory effect in the fluorescence assay, yielding a confirmation rate of 99% (Figure 4A). Of the BChE inhibitors confirmed by both assays, 25 were known drugs or bioactive compounds (including four known BChE inhibitors 10, i.e., alverine citrate, dapoxetine HCl, nafronyl oxalate, and nylidrin hydrochloride), while the other 101 inhibitors were diverse compounds with no previously reported biological activity (Table S7). Moreover, 67 (53%) compounds showed potent BChE inhibition with IC50s < 5 μM in the fluorescence assay, and 13 BChE inhibitors showed IC50s <1 μM (Table S7). The most potent novel BChE inhibitor was NCGC00481524 with an IC50 of 0.04±0.01 μM. Furthermore, the IC50 values of the compounds active in both assay formats exhibited good correlations as measured by the Pearson’s correlation coefficient (r value) (Figure 3B and 4B). The r value between the two AChE assays was 0.81, and the r value between the two BChE assays was 0.87. Examples of potent AChE and BChE inhibitors that were active in both the colorimetric and fluorescence assays are shown in Figures 3C-E and 4C-E. Figure 3F-H showed three representative AChE selective inhibitors, and Figure 4F-H showed three representative BChE selective inhibitors.
Figure 3.

Experimental validation and orthogonal confirmation of model predicted AChE inhibitors. (A) Comparison of results from the colorimetric assay and the fluorescence assay. (B) IC50 correlation of AChE inhibitors confirmed by both assays. (C-E) Representative AChE inhibitors active in both assays. (F-H) Representative AChE selective inhibitors. Results are presented as mean ± standard deviation (SD), and the error bars represent the SD of three independent experiments.
Figure 4.

Experimental validation and orthogonal confirmation of model predicted BChE inhibitors. (A) Comparison of results from the colorimetric assay and the fluorescence-based assay. (B) IC50 correlation of BChE inhibitors confirmed by both assays. (C-E) Representative BChE inhibitors active in both assays. (F-H) Representative BChE selective inhibitors. Results are presented as mean ± standard deviation (SD), and the error bars represent the SD of three independent experiments.
SAR Analysis of BChE Inhibitors
This study yielded many novel and potent BChE inhibitors, a SAR analysis on which revealed three structural series (compounds that share a common substructure or scaffold form a structural series) (Table S8, and Figures 5-7). Series 1 (i.e., (1,3-diphenyl-1H-pyrazol-4-yl)methanamine derivatives) comprised of seven active compounds and one inactive analog, with IC50s for the actives ranging from 0.71±0.20 to 30.61±0.00 μM depending on the substituent groups (Table S8, and Figure 5). Series 2 (i.e., N-((1-(piperidin-1-yl)cyclohexyl)methyl) benzamide derivatives) comprised four active compounds and eight inactive analogs, with IC50s for the actives ranging from 0.25±0.07 to 17.29±1.99 μM depending on the substituent groups (Table S8, and Figure 6). Series 3 (i.e., 2-(1-phenylethoxy)ethan-1-amine derivatives) comprised twelve active compounds and eight inactive analogs, with IC50s for the actives ranging from 0.17±0.09 to 41.67±2.71 μM depending on the substituent groups (Table S8, and Figure 7).
Figure 5.

Example BChE inhibitors and inactive analogs from the 1,3-diphenyl-1H-pyrazol-4-yl)methanamine series (1). (A) Concentration response curves of compounds in the colorimetric assay. (B) Compound structures and IC50 values. Results are presented as mean ± standard deviation (SD), and the error bars represent the SD of three independent experiments.
Figure 7.

Example BChE inhibitors and inactive analogs from the 2-(1-phenylethoxy)ethan-1-amine series (3). (A) Concentration response curves of compounds in the colorimetric assay. (B) Compound structures and IC50 values. Results are presented as mean ± standard deviation (SD), and the error bars represent the SD of three independent experiments.
Figure 6.

Example BChE inhibitors and inactive analogs from the N-((1-(piperidin-1-yl)cyclohexyl)methyl)benzamide series (2). (A) Concentration response curves of compounds in the colorimetric assay. (B) Compound structures and IC50 values. Results are presented as mean ± standard deviation (SD), and the error bars represent the SD of three independent experiments.
Discussion and Conclusions
The identification of new lead compounds, especially those with target selectivity, is an important step in early drug discovery. In this study, we constructed machine learning models for the prediction of AChE/BChE inhibitors, including target selective inhibitors, and applied the best performing models to virtually screen a diverse library of ~360K compounds. The model predicted actives were experimentally validated using the primary colorimetric assay and further confirmed using the orthogonal fluorescence assay. Finally, we performed SAR analysis on the novel BChE inhibitors to identify structural series and features that are important for BChE inhibition.
Although the inhibition of AChE and/or BChE activity can relieve some of the clinical symptoms and improve the cognitive impairment in patients with AD, the therapeutic effects of AChE/BChE inhibitors have been shown to vary greatly depending on the stage of the disease. For example, BChE inhibitors, compared to AChE inhibitors, may have better therapeutic performance and fewer side-effects in patients with moderate to severe AD 3-6. In addition, BChE in human plasma has been demonstrated to act as an endogenous scavenger for a variety of toxic compounds, such as cocaine and potent organophosphorus nerve agents 28. Therefore, we also evaluated the target selectivity of the AChE/BChE inhibitors in this study (Figure 1) in order to form more precise therapeutic strategies for diseases associated with ACh deficiency or trigger a specific biological function.
In addition to building models for the prediction of generic inhibitors of AChE or BChE, we also built models to identify AChE or BChE selective inhibitors. The best models showed robust performance with AUC-ROC values ranging from 0.83±0.03 to 0.87±0.01 (Figure 2A). Consistent with our results, several previous studies have reported that machine learning models can successfully predict inhibitors of AChE/BChE activity, such as NB and SVM models for the prediction of BChE inhibitors 12, and AChE inhibitors 29-31. However, these machine learning models were intended to predict generic inhibitors of either AChE or BChE with no consideration for target selectivity. Molecular docking methods were mainly used for virtual screens of compound libraries to identify AChE/BChE selective inhibitors 32, 33. A major challenge in applying these molecular docking methods to virtual screening is that the docking score may not be a reliable indicator of compound activity 34. In this study, we successfully identified AChE/BChE selective inhibitors using machine learning models (Figure 2). Experimental validation of our model predictions showed that the model predicted probabilities are good indicators of the AChE/BChE activity and selectivity of compounds (Figure 2C). In addition, comparing the structures of the active and inactive compounds showed that the active compounds (e.g., inhibitors of AChE or BChE) were more similar to each other than to the inactive compounds (Figure S2), indicating that the active compounds are structurally distinct from the inactive compounds. This is important for QSAR models to work well 17 and explains the good predictive performance of the models in this study. As an alternative to physical HTS, machine learning classifiers can make predictions on new unseen data based on previous experiences and known data properties. Machine learning methods have many potential benefits over traditional statistical analysis methods, including the ability to learn patterns from large, complex data sets rather than testing specific hypotheses, and the ability to handle nonlinear models and complex interactions between variables. Machine learning methods could be applied to build both 2D and 3D QSAR models where different representations of chemical structures are used as input. To gain insight into the specific binding of BChE selective inhibitors, molecular docking analysis was performed on 177 BChE selective inhibitors that were identified through experimental HTS assays (see supplemental experimental procedures for more details). Among the 177 BChE selective inhibitors, 70% exhibited target selectivity consistent with the assay results (Table S9). Consist with our previous study 10, the molecular docking approach has been shown useful in understanding compound selectivity for BChE over AChE. For example, ZINC12002884 (NCGC00425816, BChE selective inhibitor) forms hydrogen bonds with the amino acid residues TRP-82, GLY-78, and TRP-430 of BChE, or GLU-202 of AChE, and it exhibited higher predicted binding free energy (−8.8 kcal/mol) with BChE than with AChE (−7.1 kcal/mol) (Figure S3, and Table S9). This differential bonding energy may be caused by interactions (e.g., amino acid residues causing Vander Waals interactions, hydrophobic interactions, π-Stacking, and other electrostatic interactions) other than hydrogen bonding 21.
The key structural features are useful for predicting the bioactivity of a given compound 35. In this study, the chemical features significantly associated with AChE/BChE activity or selectivity were identified (Table 1 and Table S4), and some of them have literature support. For example, three phosphoryl containing features were found to have a significant association with AChE/BChE inhibition in this study, e.g., “bond:P═O_phosphorus_oxo” for AChE inhibition (P value = 3.73×10⁻¹⁵), “bond: P═O_phosphate_dithio” for selective AChE inhibition (P value = 9.14×10⁻⁵), and “bond:P═O_phosphonate_aliphatic_ester” for BChE inhibition (P value = 2.14×10⁻²) (Table 1 and Table S4). Consistent with these findings, organophosphates nerve agents containing a phosphoryl (P═O bond) group have been reported to disrupt cholinergic neurotransmission by irreversibly inhibiting AChE and BChE activity 13, 14. The feature “ring:hetero_[6_6_6]_N_S_phenothiazine” was found significant for BChE selectivity (P value = 5.00×10⁻⁴) in this study (Table 1 and Table S4). Consistent with this finding, there has been cases in the literature that the phenothiazine core was the basis for selective inhibition of BChE 36-38. For example, ethopropazine, which contains the “ring:hetero_[6_6_6]_N_S_phenothiazine” feature, is a highly selective inhibitor of BChE over AChE (~1000-fold selectivity) 39.
The optimal machine learning models developed in this study efficiently screened a large library of ~360K diverse compounds, and the predicted active compounds were further tested experimentally (Figure 2C). Compared with the qHTS assays, the optimal models increased the assay hit rate by 2.0-7.3 folds. The experimental validation was carried out using two orthogonal assays, a colorimetric assay and a fluorescence-based assay. Most of the compounds active in one assay also demonstrated activity in the other with a good correlation in their IC50s, providing more confidence to the inhibitory effect of these compounds (Figures 3A-B, and Figures 4A-B). This study identified a number of potent AChE/BChE inhibitors with novel scaffolds, some of which also showed target selectivity (Figure 3-7). Among these inhibitors, NCGC00526830 was identified as a potent (IC50 = 0.13±0.02 μM, and efficacy =116%±3.24% in the fluorescence-based assay; IC50 = 0.27±0.0 μM, and efficacy =78%±4.18% in the colorimetric assay) and selective AChE inhibitor (selectivity index (SI) =79-164) (Figure 3, Table S6, and Table S7), superior to galantamine (a selective AChE inhibitor approved by the U.S. FDA to treat symptoms of AD), which had IC50 = 0.79 μM and SI = 50 8, 40. NCGC00425816 was identified as a potent (IC50 = 0.08±0.01 μM, and efficacy = 109%±6.76% in the fluorescence-based assay; IC50 = 0.04±0.01 μM, and efficacy =98.9%±3.21% in the colorimetric assay) and selective BChE inhibitor (SI = 1250-2351) (Figure 4, Table S6, and Table S7), superior to ethopropazine (a selective BChE inhibitor approved by the U.S. FDA for treatment of Parkinson's disease), which had IC50 = 0.21-0.30 μM and SI = ~1000 41, 42. The aim of this study is to identify novel AChE/BChE inhibitors to serve as potential drug lead compounds through virtual screening. Therefore, we only selected AChE/BChE inhibitors predicted by the models for experimental validation to minimize false positives. Although selected non-inhibitors could have been tested to assess potential false negative predictions, this is less of a concern for this study and we chose not to do so to save resources and reduce costs.
In summary, we developed robust machine learning QSAR models to predict the activity and selectivity of compounds in terms of AChE/BChE inhibition. Experimental validation showed that the optimal models were able to improve the assay hit rates by several folds. We identified 22 AChE inhibitors and 67 BChE inhibitors that showed a potent inhibitory effect (IC50 < 5 μM), with 4 AChE inhibitors and 13 BChE inhibitors showing IC50s < 1 μM. The SAR analysis in addition revealed novel scaffolds that can be used to optimize the compounds to improve their physicochemical properties for potentially new drug development.
Supplementary Material
Acknowledgements
This work was supported by the Intramural Research Programs of the National Center for Advancing Translational Sciences, National Institutes of Health. The authors would like to thank Paul Shinn for compound management and Abhinav Asthana for assistance with quality control (QC).
Abbreviations used
- ACh
Acetylcholine
- AChE
Acetylcholinesterase
- AD
Alzheimer's disease
- AUC-ROC
area under the receiver operating characteristic curve
- BChE
butyrylcholinesterase
- XGboost
eXtreme Gradient Boosting
- NB
Naïve Bayes
- NNET
Neural Networks
- qHTS
quantitative high-throughput screening
- QSAR
quantitative structure-activity relationship
- RF
Random Forests
- ROSE
Random Over Sampling Examples
- SI
selectivity index
- SD
standard deviation
- SAR
structure-activity relationship
- SVM
Support Vector Machine
- SMOTE
Synthetic Minority Over-sampling Technique
- TC
Tanimoto Coefficient
Footnotes
Supporting information
Detailed composition of the original qHTS assay data; The optimal AUC-ROC values for each AChE/BChE activity and selectivity prediction model; Structural features that produced the models with the best predictive performance; Chemical features significantly associated with AChE/BChE activity and/or selectivity; Experimental validation of model-predicted AChE/BChE inhibitors using the colorimetric assay; Experimental validation of model-predicted selective AChE/BChE inhibitors using the colorimetric assay; Orthogonal confirmation of model-predicted AChE/BChE inhibitors using the fluorescence-based assay; Three structural series of BChE inhibitors obtained from the SAR analysis; The binding energies between the selective ligands and AChE/BChE calculated by the molecular docking (XLSX).
HPLC traces of lead compounds; Structural similarity between different compound sets; Molecular docking analyses of the interaction between ZINC12002884 and BChE or AChE using the AutoDock Vina program (PDF)
Data and software availability
All data are provided as part of the Supporting Information (SI). The R codes used in this study are publicly available on the GitHub repository at https://github.com/TX-2017/machine-learning.
The authors declare no competing financial interest.
References
- (1).Bartus RT; Dean RL 3rd; Beer B; Lippa AS The cholinergic hypothesis of geriatric memory dysfunction. Science 1982, 217, 408–414. [DOI] [PubMed] [Google Scholar]
- (2).Bartus RT On neurodegenerative diseases, models, and treatment strategies: lessons learned and lessons forgotten a generation following the cholinergic hypothesis. Exp. Neurol 2000, 163, 495–529. [DOI] [PubMed] [Google Scholar]
- (3).Cummings JL Cholinesterase inhibitors: A new class of psychotropic compounds. Am. J. Psychiatry 2000, 157, 4–15. [DOI] [PubMed] [Google Scholar]
- (4).Pepeu G; Giovannini MG Cholinesterase inhibitors and beyond. Curr. Alzheimer Res 2009, 6, 86–96. [DOI] [PubMed] [Google Scholar]
- (5).Anand P; Singh B A review on cholinesterase inhibitors for Alzheimer's disease. Arch. Pharm. Res 2013, 36, 375–399. [DOI] [PubMed] [Google Scholar]
- (6).Greig NH; Lahiri DK; Sambamurti K Butyrylcholinesterase: an important new target in Alzheimer's disease therapy. Int. Psychogeriatr 2002, 14, 77–91. [DOI] [PubMed] [Google Scholar]
- (7).Li Q; Yang H; Chen Y; Sun H Recent progress in the identification of selective butyrylcholinesterase inhibitors for Alzheimer's disease. Eur. J. Med. Chem 2017, 132, 294–309. [DOI] [PubMed] [Google Scholar]
- (8).Bachovchin DA; Cravatt BF The pharmacological landscape and therapeutic potential of serine hydrolases. Nat. Rev. Drug Discov 2012, 11, 52–68. [DOI] [PMC free article] [PubMed] [Google Scholar]
- (9).Wishart DS; Feunang YD; Guo AC; Lo EJ; Marcu A; Grant JR; Sajed T; Johnson D; Li C; Sayeeda Z DrugBank 5.0: a major update to the DrugBank database for 2018. Nucleic Acids Res. 2018, 46, 1074–1082. [DOI] [PMC free article] [PubMed] [Google Scholar]
- (10).Li S; Li AJ; Travers J; Xu T; Sakamuru S; Klumpp-Thomas C; Huang R; Xia M Identification of Compounds for Butyrylcholinesterase Inhibition. SLAS Discov. 2021, 26, 1355–1364. [DOI] [PMC free article] [PubMed] [Google Scholar]
- (11).Zhou S; Yuan Y; Zheng F; Zhan C-G Structure-based virtual screening leading to discovery of highly selective butyrylcholinesterase inhibitors with solanaceous alkaloid scaffolds. Chem. Biol. Interact 2019, 308, 372–376. [DOI] [PMC free article] [PubMed] [Google Scholar]
- (12).Fang J; Yang R; Gao L; Zhou D; Yang S; Liu A.-l.; Du G.-h. Predictions of BuChE inhibitors using support vector machine and naive Bayesian classification techniques in drug discovery. J. Chem. Inf. Model 2013, 53, 3009–3020. [DOI] [PubMed] [Google Scholar]
- (13).Fukuto TR Mechanism of action of organophosphorus and carbamate insecticides. Environ. Health Perspect 1990, 87, 245–254. [DOI] [PMC free article] [PubMed] [Google Scholar]
- (14).Jeong W-H; Lee J-Y; Lim K-C; Kim H-S Identification and Study of Biomarkers from Novichok-Inhibited Butyrylcholinesterase in Human Plasma. Molecules 2021, 26, 3810. [DOI] [PMC free article] [PubMed] [Google Scholar]
- (15).Li S; Zhao J; Huang R; Travers J; Klumpp-Thomas C; Yu W; MacKerell AD Jr.; Sakamuru S; Ooka M; Xue F; Sipes NS; Hsieh JH; Ryan K; Simeonov A; Santillo MF; Xia M Profiling the Tox21 Chemical Collection for Acetylcholinesterase Inhibition. Environ. Health Perspect 2021, 129, 47008. [DOI] [PMC free article] [PubMed] [Google Scholar]
- (16).Yang C; Tarkhov A; Marusczyk J; Bienfait B; Gasteiger J; Kleinoeder T; Magdziarz T; Sacher O; Schwab CH; Schwoebel J; Terfloth L; Arvidson K; Richard A; Worth A; Rathman J New publicly available chemical query language, CSRML, to support chemotype representations for application to data mining and modeling. J. Chem. Inf. Model 2015, 55, 510–528. [DOI] [PubMed] [Google Scholar]
- (17).Xu T; Xu M; Zhu W; Chen CZ; Zhang Q; Zheng W; Huang R Efficient Identification of Anti-SARS-CoV-2 Compounds Using Chemical Structure-and Biological Activity-Based Modeling. J. Med. Chem 2022, 65, 4590–4599. [DOI] [PMC free article] [PubMed] [Google Scholar]
- (18).Xu T; Ngan DK; Ye L; Xia M; Xie HQ; Zhao B; Simeonov A; Huang R Predictive Models for Human Organ Toxicity Based on In Vitro Bioactivity Data and Chemical Structure. Chem. Res. Toxicol 2020, 33, 731–741. [DOI] [PMC free article] [PubMed] [Google Scholar]
- (19).Xu T; Wu L; Xia M; Simeonov A; Huang R Systematic identification of molecular targets and pathways related to human organ level toxicity. Chem. Res. Toxicol 2020, 34, 412–421. [DOI] [PMC free article] [PubMed] [Google Scholar]
- (20).Ye L; Ngan DK; Xu T; Liu Z; Zhao J; Sakamuru S; Zhang L; Zhao T; Xia M; Simeonov A; Huang R Prediction of drug-induced liver injury and cardiotoxicity using chemical structure and in vitro assay data. Toxicol. Appl. Pharmacol 2022, 454, 116250. [DOI] [PMC free article] [PubMed] [Google Scholar]
- (21).Xu T; Kabir M; Sakamuru S; Shah P; Padilha EC; Ngan DK; Xia M; Xu X; Simeonov A; Huang R Predictive Models for Human Cytochrome P450 3A7 Selective Inhibitors and Substrates. J. Chem. Inf. Model 2023, 63, 846–855. [DOI] [PMC free article] [PubMed] [Google Scholar]
- (22).Torgo L; Torgo ML Package ‘DMwR’. Comprehensive R Archive Network 2013. [Google Scholar]
- (23).Chen T; He T; Benesty M; Khotilovich V; Tang Y Xgboost: extreme gradient boosting. R package version 0.4-2 2015, 1–4. [Google Scholar]
- (24).Inglese J; Auld DS; Jadhav A; Johnson RL; Simeonov A; Yasgar A; Zheng W; Austin CP Quantitative high-throughput screening: a titration-based approach that efficiently identifies biological activities in large chemical libraries. Proc. Natl. Acad. Sci. U.S.A 2006, 103, 11473–11478. [DOI] [PMC free article] [PubMed] [Google Scholar]
- (25).Wang Y; Jadhav A; Southal N; Huang R; Nguyen DT A grid algorithm for high throughput fitting of dose-response curve data. Curr. Chem. Genom 2010, 4, 57–66. [DOI] [PMC free article] [PubMed] [Google Scholar]
- (26).Huang R A Quantitative High-Throughput Screening Data Analysis Pipeline for Activity Profiling. In High-Throughput Screening Assays in Toxicology, 1 ed.; Zhu H, Xia M Eds.; Methods in Molecular Biology, Vol. 1473; Humana Press, 2016. [DOI] [PubMed] [Google Scholar]
- (27).Richard AM; Huang R; Waidyanatha S; Shinn P; Collins BJ; Thillainadarajah I; Grulke CM; Williams AJ; Lougee RR; Judson RS; Houck KA; Shobair M; Yang C; Rathman JF; Yasgar A; Fitzpatrick SC; Simeonov A; Thomas RS; Crofton KM; Paules RS; Bucher JR; Austin CP; Kavlock RJ; Tice RR The Tox21 10K Compound Library: Collaborative Chemistry Advancing Toxicology. Chem. Res. Toxicol 2021, 34, 189–216. [DOI] [PMC free article] [PubMed] [Google Scholar]
- (28).Lockridge O. Review of human butyrylcholinesterase structure, function, genetic variants, history of use in the clinic, and potential therapeutic uses. Pharm. Therap 2015, 148, 34–46. [DOI] [PubMed] [Google Scholar]
- (29).Chekmarev D; Kholodovych V; Kortagere S; Welsh WJ; Ekins S Predicting inhibitors of acetylcholinesterase by regression and classification machine learning approaches with combinations of molecular descriptors. Pharm. Res 2009, 26, 2216–2224. [DOI] [PubMed] [Google Scholar]
- (30).Wang K; Hu X; Wang Z; Yan A Classification of acetylcholinesterase inhibitors and decoys by a support vector machine. Comb. Chem. High Throughput Screen 2012, 15, 492–502. [DOI] [PubMed] [Google Scholar]
- (31).Lv W; Xue Y Prediction of acetylcholinesterase inhibitors and characterization of correlative molecular descriptors by machine learning methods. Eur. J. Med. Chem 2010, 45, 1167–1172. [DOI] [PubMed] [Google Scholar]
- (32).Jang C; Yadav DK; Subedi L; Venkatesan R; Venkanna A; Afzal S; Lee E; Yoo J; Ji E; Kim SY Identification of novel acetylcholinesterase inhibitors designed by pharmacophore-based virtual screening, molecular docking and bioassay. Sci. Rep 2018, 8, 1–21. [DOI] [PMC free article] [PubMed] [Google Scholar]
- (33).Dighe SN; Deora GS; De la Mora E; Nachon F; Chan S; Parat M-O; Brazzolotto X; Ross BP Discovery and structure–activity relationships of a highly selective butyrylcholinesterase inhibitor by structure-based virtual screening. J. Med. Chem 2016, 59, 7683–7689. [DOI] [PubMed] [Google Scholar]
- (34).Ramírez D; Caballero J Is It Reliable to Take the Molecular Docking Top Scoring Position as the Best Solution without Considering Available Structural Data? Molecules 2018, 23, 1038. [DOI] [PMC free article] [PubMed] [Google Scholar]
- (35).Simmons KJ; Chopra I; Fishwick CW Structure-based discovery of antibacterial drugs. Nat. Rev. Microbiol 2010, 8, 501–510. [DOI] [PubMed] [Google Scholar]
- (36).Darvesh S; Pottie IR; Darvesh KV; McDonald RS; Walsh R; Conrad S; Penwell A; Mataija D; Martin E Differential binding of phenothiazine urea derivatives to wild-type human cholinesterases and butyrylcholinesterase mutants. Bioorg. Med. Chem 2010, 18, 2232–2244. [DOI] [PubMed] [Google Scholar]
- (37).Makhaeva GF; Lushchekina SV; Boltneva NP; Sokolov VB; Grigoriev VV; Serebryakova OG; Vikhareva EA; Aksinenko AY; Barreto GE; Aliev G; Bachurin SO Conjugates of γ-Carbolines and Phenothiazine as new selective inhibitors of butyrylcholinesterase and blockers of NMDA receptors for Alzheimer Disease. Sci. Rep 2015, 5, 13164. [DOI] [PMC free article] [PubMed] [Google Scholar]
- (38).Xie HQ; Xu T; Chen Y; Li Y; Xia Y; Xu SL; Wang L; Tsim KWK; Zhao B New perspectives for multi-level regulations of neuronal acetylcholinesterase by dioxins. Chem. Biol. Interact 2016, 259, 286–290. [DOI] [PubMed] [Google Scholar]
- (39).Zhang T; Zheng X; Kim K; Zheng F; Zhan C-G Blocking drug activation as a therapeutic strategy to attenuate acute toxicity and physiological effects of heroin. Sci. Rep 2018, 8, 1–6. [DOI] [PMC free article] [PubMed] [Google Scholar]
- (40).Zhou B; Zhang B; Li X; Liu X; Li H; Li D; Cui Z; Geng H; Zhou L New 2-aryl-9-methyl-β-carbolinium salts as potential acetylcholinesterase inhibitor agents: synthesis, bioactivity and structure–activity relationship. Sci. Rep 2018, 8, 1–18. [DOI] [PMC free article] [PubMed] [Google Scholar]
- (41).Chouinard G; Annable L; Ross-Chouinard A; Kropsky ML Ethopropazine and benztropine in neuroleptic-induced parkinsonism. J. Clin. Psychiatry 1979, 40, 147–152. [PubMed] [Google Scholar]
- (42).Atack JR; Yu Q-S; Soncrant TT; Brossi A; Rapoport SI Comparative inhibitory effects of various physostigmine analogs against acetyl-and butyrylcholinesterases. J. Pharmacol. Exp. Ther 1989, 249, 194–202. [PubMed] [Google Scholar]
Associated Data
This section collects any data citations, data availability statements, or supplementary materials included in this article.