

Abstract
Cell surface glycans are essential for establishing cell communication, adhesion, and migration. However, it remains challenging to obtain cell surface-specific information about glycoconjugate structures. Acquiring this information is essential for unraveling the functional role of glycans and for exploiting them as clinical targets. To specifically analyze the N-glycoprotein forms expressed at the cell surface, we developed a C18 liquid chromatography (LC)-mass spectrometry (MS)-based glycoproteomics method in combination with highly specific cell surface protein labeling and enrichment using a biotin label. The surface-specificity of the method was validated by MS-based proteomics of subcellular component marker proteins. Using the human keratinocytes N/TERT-1 as a model system, we identified and quantified the glycosylation of hundreds of cell surface N-glycosylation sites. This approach allowed us to study the glycoforms present at the functional relevant cell surface, omitting immaturely glycosylated proteins present in the secretory pathway. Interestingly, the different stages of N-glycan processing at individual sites displayed at the cell surface were found to correlate with their accessibility for ER-residing processing enzymes, as investigated through molecular dynamics simulations. Using the new approach, we compared N-glycosylation sites of proteins expressed on the cell surface to their counterparts in a total cell lysate, showing profound differences in glycosylation between the subcellular components and indicating the relevance of the method for future studies in understanding contextual glycan functions.
Introduction
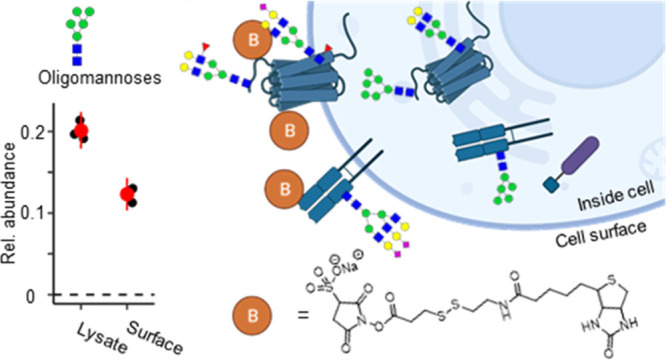
Cell surface glycans are essential for multicellular life, establishing cell communication, adhesion, and migration.1 Yet we have limited information on the display of specific glycan structures on the surfaces of cells and how differential glycosylation at individual sites on surface proteins is involved in critical cellular functions. The main reason for this knowledge gap is the step-by-step process by which glycans are synthesized in the secretory pathway, making total cell lysates inherently include biosynthetic intermediates normally only present inside cells (Figure 1).
Figure 1.

Capturing the cell surface N-glycoproteome. (A) Schematic of the methods. (B) Depiction of cellular N-glycosylation types and features, including biosynthetic intermediates in the secretory pathway. (C, D) Proteomic validation of surface-specificity via secretory pathway and surface markers in N/TERT-1 cells. (C) Surface markers (yellow): Integrin α5 (ITA5) and E-cadherin (CADH1). Intracellular markers (yellow): GM130 (GOLGA2), mannosyl-oligosaccharide-1,2-alpha-mannosidaseIB (MAN1A2), and trans-golgi network glycoprotein 46 (TGN46). Cells were counterstained with the F-actin marker Phalloidin 594 to visualize the cell surface (pink) and DAPI (blue). (D) LC-MS/MS-based proteomics identified 6057 proteins in the total cell lysate (TCL) and 3541 proteins in the surface preparation. Marker proteins were relatively quantified based on the total protein abundance. (E) Comparison between the TCL and the surface glycome of N/TERT-1 cells using LC-MS/MS based released glycan analysis. Glycan traits were calculated based on 188 individual N-glycans (Table S2). *t test derived Benjamini–Hochberg FDR < 0.05.
While cell surface glycosylation can be visualized with carbohydrate-specific antibodies and lectins,2 such approaches do not, in most cases, provide information on the glycoconjugates or proteins that are carrying the individual glycans. Also, these analyses are limited by the repertoire of glycan binders to specific features commercially available.3 Liquid chromatography (LC)-mass spectrometry (MS)-based glycoproteomics is a powerful alternative to globally examine glycans present in cells.4 However, so far, it has been challenging to examine the glycans selectively displayed on the cell surface. Total cell lysates or membrane fractions inherently include biosynthetic intermediates normally present only inside cells. It is thus unclear to what degree our current information on cellular glycoconjugate structures is truly related to cell surface glycans or rather represents internal structures with limited functional importance on the cell surface. Obtaining this information is essential for defining the functional role of glycans at specific sites on individual proteins and exploiting glycans as clinical targets.
The methods used to study plasma membrane-associated glycoproteins either lack the required selectivity or are biased for a select type of glycan or proteins. These methods include differential centrifugation,5,6 sialic acid labeling,7 and cell surface shaving.8−10 While differential centrifugation efficiently enriches membrane (glyco)proteins, mitochondrial proteins and proteins from other subcellular organelle membranes are also often coenriched.8,11 This potentially contaminates the cell surface glycoproteins with immature glycoforms present in the secretory pathway. Chemical or metabolic labeling of sialylated cell surface glycoproteins for subsequent enrichment increases specificity but limits the investigations to sialylated glycoproteins.
To overcome such limitations and to provide an in-depth picture of the differences in glycoforms between glycoproteins at the cell surface and from intracellular compartments, we developed an MS-based method for the sensitive and inclusive analysis of cell surface glycoproteins. Combining highly sensitive glycoproteomic analysis with biotinylation of cell surface proteins,12,13 we obtained a method that allows a deep investigation of the functionally relevant glycoproteome displayed at the cell surface, omitting immaturely glycosylated proteins present in the secretory pathway. The method was validated on, and applied to, the nontransformed human skin keratinocyte cell line N/TERT-1. These cells have the ability to undergo complete histogenesis in three-dimensional organotypic cultures and model cell differentiation of normal human epidermis. The N/TERT-1 cells therefore represent a good model for healthy primary cells,14,15 and with these, we identified and quantified the N-glycosylation of hundreds of glycosylation sites in functional relevant proteins, including, e.g., different integrins, cadherins, desmoglein-3, epidermal growth factor receptor, insulin-like growth factor 1 receptor, and nectin-1.
The approach allowed us to compare N-glycosylation sites of proteins expressed on the cell surface to their counterparts from a total cell lysate, indicating profound differences between the two subcellular components in terms of the presence, maturation, and decoration. Importantly, we show that detailed information on surface expressed N-glycoproteins can be obtained regarding micro- and macroheterogeneity, which has high potential to be extended to a wider repertoire of glycosylation in the glycocalyx. The method will be an essential component of future cellular glycoproteomic analyses and provides new knowledge that will increase our understanding of contextual glycan functions, such as the discrimination between healthy and diseased cells by our immune system. Furthermore, it will advance the discovery of relevant glycoforms for drug targeting.16
Experimental Section
Total Cell Collection
After cell culture (see Supporting Experimental Section), the keratinocytes were washed twice with ambient PBS and harvested by scraping in PBS. After spinning for 5 min at 500g at 4 °C, the supernatant was discarded, and the cells were resuspended in 500 μL of PBS. Of this, 100 μL (20%), 125 μL (25%), or 166 μL (33%) was used for glycoproteomics (N/TERT-1), release glycan profiling (N/TERT-1), or TMT-based quantitative proteomics (HaCaT), respectively.
Cell Surface Protein Labeling and Enrichment
After cell culture, the keratinocytes were washed twice with ambient PBS after which biotin labeling of the cell surface primary amines was performed using 3 mg of EZ-Link Sulfo-NHS-SS-Biotin (Thermo Fisher Scientific) and following the protocol provided by the Pierce Cell Surface Biotinylation and Isolation Kit for adherent cells, with modifications. In short, the cells were incubated with 10 mL of labeling reagent for 10 min at room temperature, followed by two 20 mL ice-cold tris-buffered saline (TBS) washes to quench the reaction. The cells were harvested by scraping in TBS, spun for 6 min at 600g at 4 °C, and the supernatant was discarded. To lyse the cells, the kit’s lysis buffer was supplemented with 1× cOmplete Mini EDTA-free Protease Inhibitor Cocktail (Roche), and the cell pellets were thoroughly resuspended in 500 μL and incubated on ice for 30 min. The cell lysate was centrifuged for 5 min at 15,000g at 4 °C, after which the supernatant was collected. Subsequently, the cell surface proteins were enriched from the collected supernatant using NeutrAvidin Agarose (250 μL slurry; Thermo Fisher Scientific) in a spin column format. Importantly, after washing with the kit’s washing buffer, a minimum of four extra washes with 50 mM ammonium bicarbonate were introduced until bubble formation during mixing disappeared. The captured proteins were eluted using 200 μL of 10 mM DTT and 0.1% Rapigest (Waters) in 50 mM ammonium bicarbonate and incubated for 45 min at room temperature while mixing. The flow-through was collected in a low protein binding tube. Of the flow-through, 200 μL (100%), 180 μL (90%), 60 μL (30%), or 200 μL (100%) was used for glycoproteomics (N/TERT-1), release glycan profiling (N/TERT-1), in-depth label free proteomics (N/TERT-1), or TMT-based quantitative proteomics (HaCaT), respectively.
For the in-depth label free proteomics of the N/TERT-1 cells and the TMT-based quantitative proteomics of the HaCaT cells, see the Supporting Experimental Section.
N-Glycan Release and NanoLC-MS Analysis
For the TCL analysis, the cell pellets were resuspended in 25 μL of lysis buffer (50 mM Tris HCl, 100 mM NaCl, 1× cOmplete Mini EDTA-free Protease Inhibitor Cocktail (Roche)), while the cell surface-enriched samples were dried to approximately 45 μL, and the buffer composition was adjusted to match the lysis buffer. All samples were sonicated in a sonic bath for 60 min at 60 °C and blotted on a PVDF membrane in a 96-well plate format as described previously.17N-Glycans were overnight released using 2 U PNGaseF (Roche) in 30 μL water at 37 °C, eluted, and dried. Sialic acids were derivatized by ethyl esterification (α2,6-linked sialic acids) and subsequent ammonia amidation (α2,3-linked sialic acids) as described previously and purified by cotton-hydrophilic interaction liquid chromatography (HILIC) solid phase extraction (SPE).18 Next, 50 μL of 2-aminobenzamide (2-AB) reagent (500 mM 2-AB, 116 mM 2-methylpyridine borane complex (PB) in 45:45:10 metanol:water:acetic acid) was added. The samples were incubated 2.5 h at 50 °C, and 1 mL of ACN was added. The glycans were purified by HILIC SPE and eluted in 50 μL water. Ten microliter portions of the eluates were diluted in 10 μL of water, of which 2 μL was used for nanoLC-MS/MS analysis.
The nanoLC platform was based on a single analytical column setup packed with a Reprosil-Pure-AQ C18 phase (Dr. Maisch, 1.9 μm particle size, 20–25 cm column length) in an EASY-nLC 1200 UHPLC (Thermo Fisher Scientific) using a PicoFrit Emitter (New Objectives, 75 μm inner diameter). The emitter was interfaced to an Orbitrap Fusion Lumos MS (Thermo Fisher Scientific) via a nanoSpray Flex ion source. Samples were eluted with a 30 min method with a gradient from 3% to 45% solvent B in 15 min, from 45% to 100% B in the next 5 min, and 100% B for the last 10 min at 200 nL/min (solvent A, 0.1% formic acid in water; solvent B, 0.1% formic acid in 80% ACN). A precursor MS scan (m/z 200–1700, positive polarity) was acquired in the Orbitrap at a nominal resolution of 120,000, followed by Orbitrap higher-energy C-trap dissociation (HCD)-MS/MS at a nominal resolution of 50,000 of the 10 most abundant precursors in the MS spectrum (charge states 1 to 4). A minimum MS signal threshold of 30,000 was used to trigger data-dependent fragmentation events. HCD was performed with an energy of 27% ± 5%, applying a 20 s dynamic exclusion window.
Data analysis and structural annotation was performed as described before, using the Minora Feature Detector node in Thermo Proteome Discoverer 2.2.0.388 (Thermo Fisher Scientific), GlycoWorkbench 2.1 (build 146), Skyline 21.1.0.146 (ProteoWizard), and the Thermo Xcalibur qual browser 3.0.63.17 MS/MS spectra were manually assigned for each MS1 feature in at least one sample and further confirmed based on isotope pattern , accurate mass , and retention time matchings. N-Glycans were relatively quantified in each sample by total area normalization. Derived traits were calculated based on specific glycosylation features, including the N-glycan type (pauci mannose, oligomannose, complex, or hybrid) and complex-type fucosylation (no or core and/or antenna), sialylation (no or α2,3- and/or α2,6-linked), bisection, LacdiNAc, galactosylation, and antenarity. Values were represented as averages and standard deviations over the three technical replicates. The R base unpaired t test was used to determine statistical significance (p-value < 0.05 after FDR correction for multiple testing) between the TCL and the cell surface glycan abundancies.
Glycopeptide Generation and HILIC Fractionation
For the TCL analysis, the cell pellet was resuspended in 100 μL of lysis buffer from the Pierce Cell Surface Biotinylation and Isolation Kit (Thermo Fisher Scientific), incubated on ice for 30 min, and centrifuged for 5 min at 15,000g at 4 °C, after which the supernatant was collected. Then, 10 μL of 200 mM DTT and 90 μL of 50 mM ABC were added. Together with the cell surface fractionation eluates, the samples were incubated 30 min at 60 °C, and 4 μL of IAA was added followed by another 30 min incubation at room temperature in the dark. After inactivation of the IAA for 15 min in light, 2.5 μL of 1 μg/μL trypsin (Roche) was added, and the samples were digested overnight at 37 °C. The next day, 2 μL of TFA was added to each sample, incubated 30 min at 37 °C, and spun 15 min at 16,000g at room temperature. The supernatant was subjected to C18 SepPak (Waters) purification, eluted two times in 400 μL 50% MOH, 0.1% FA, and dried by vacuum centrifugation. All dried samples were redissolved in 30 μL of water after which 170 μL of ACN was added. The samples were fractionated by cotton-HILIC SPE using 200 μL pipet-tips. After conditioning of the cotton (3× 100 μL water, 3× 100 μL 85% ACN), the sample was loaded by repetitive pipetting 40× 100 μL, washed (3× 100 μL 85% ACN and 1% TFA, 3× 100 μL 85% ACN), and eluted in 50 μL water. Both the flow-through and the eluate were dried by vacuum centrifugation and redissolved in 20 μL 0.1% FA. Peptide quantities ranged from an average of 0.2 μg in the cell surface eluates to 1.2 μg in both the cell surface flow-through and the TCL eluate to 7.7 μg in the flow-through of the TCL. From all samples, 5 μL (25%) was used for nanoLC-MS/MS analysis.
NanoLC-MS of Glycopeptides
The nanoLC platform was based on the single analytical column setup in an EASY-nLC 1200 UHPLC instrument using a PicoFrit Emitter to the Orbitrap Fusion Lumos MS as described above for the released N-glycan analysis. Samples were eluted in a 2 h method with a gradient from 3% to 32% of solvent B in 95 min, from 32% to 100% B in the next 10 min, and 100% B for the last 15 min at 200 nL/min (solvent A, 0.1% formic acid in water; solvent B, 0.1% formic acid in 80% ACN). A precursor MS scan (m/z 350–1700, positive polarity) was acquired in the Orbitrap at a nominal resolution of 120,000, followed by Orbitrap higher-energy C-trap dissociation (HCD)-MS/MS at a nominal resolution of 50,000 of the 10 most abundant precursors in the MS spectrum (charge states 2 to 6). A minimum MS signal threshold of 30,000 was used to trigger data-dependent fragmentation events. HCD was performed with an energy of 37% ± 5%, applying a 20 s dynamic exclusion window.
Automated Glycoproteomics Data analysis
Glycoproteomic data processing was performed using PD version 2.4.1.15. Raw files were searched with the PMI-Byonic search engine against a human-specific database (UniProt, March 2019, containing 20,355 reviewed canonical entries). Enzyme restriction was set to trypsin digestion with full specificity and a maximum of three missed cleavages. The precursor mass tolerance was set to 10 ppm, and the fragment ion mass tolerance was set to 0.02 Da. Carbamidomethyl (+57.021 Da; C) was used as a fixed modification. CAMthiopropanoyl (+145.020 Da; K; protein N-terminus; rare1) and oxidation (+15.995 Da; M; common2) as well as a list of 120 N-glycan compositions based on the released N-glycan analysis (N-glycan; common1; Table S2) were set as variable modifications, with a maximum of two common and one rare variable modifications per peptide. Precursor ions were quantified using the Minora Feature Detector and Precursor Ions Quantifier based on intensity. R was used to filter the identified (glyco)peptides based on FDR 2D (<0.01; decoy based), PEP2D (<0.1; glycopeptide based), and as being PD quantified in the duplicates of at least one condition (cell surface HILIC eluate; cell surface HILIC flow-through; TCL HILIC eluate; TCL HILIC flow-through). Additionally, glycopeptides were selected, as well as the nonglycosylated versions thereof. For the resulting data, the absolute intensities of the HILIC eluate and flow-through of the same sample were summed, and relative abundancies of individual glycoforms were calculated per peptide portion. Based on the relative abundancies per peptide portion, derived glycosylation traits were calculated, being nonglycosylated (NG; relative abundance of the nonglycosylated site), Pauci mannosidic (PM; summed relative abundance of glycans with ≤3 hexoses, 2 HexNAcs and 0 sialic acids, or ≥4 hexoses, 2 HexNAcs, ≥1 fucoses and 0 sialic acids), oligomannosidic (OM; summed relative abundance of glycans with ≥4 hexoses 2 HexNAcs and 0 sialic acids and 0 fucoses), hybrid type (Hy; summed relative abundance of glycans with ≥5 hexoses and 3 HexNAcs, or 4 hexoses, 3 HexNAcs and 0 sialic acids, or ≥6 hexoses and 4 HexNAcs), complex type (C; summed relative abundance of all other glycans), the number of mannoses on OM (MM; summed relative abundance of OM glycan multiplied by the number of hexoses, divided by OM), the level of sialylation on complex type glycans (CS; summed relative abundance of C glycans with ≥1 sialic acid, divided by C), and the level of fucosylation on complex type glycans (CF; summed relative abundance of C glycans with ≥1 fucose, divided by C).
Manual Glycoproteomics Data analysis
Ten abundant cell surface glycoproteins, identified and quantified using Byonic/PD in both the cell surface as well as the TCL samples, were selected based on their abundance as assessed by the ratio between their total number of PSMs and the amino acid chain length. These included ITGB1, EGFR, CD59, ITGAV, DSG3, NT5E, L1CAM, LYPD3, CD166, and ITGA6. For these proteins, the unfiltered Byonic data was used to identify potentially covered glycosylation sites based on their annotation with at least one glycoform, independent of their QC parameters. The peptide portions carrying the identified glycosylation sites were imported into Skyline 21.1.0.146 (ProteoWizard; proteomics interface) together with the complete list of 120 N-glycan compositions based on released N-glycan analysis. All peptide–glycan combinations were manually evaluated based on isotope pattern, accurate mass, and retention time matchings, as well as by manually validating at least one MS/MS spectrum per peptide portion confirming the presence of a glycopeptide in the observed retention time window. The identified glycan–peptide combinations were then quantified in Skyline based on MS1 peak integration of the isotopologues, which represent at least 20% of the highest one and summing the relevant charge states. Glycoforms were relatively quantified per peptide portion by total area normalization, and different cleavage products covering the same glycosylation site were included/excluded based on absolute abundance and glycoform coverage after confirming similar glycoform distributions. For peptide portions for which part of the (glyco)peptides was found in the HILIC flow-through, the absolute intensities of the HILIC eluate and flow-through of the same sample were summed prior to total area normalization. Finally, the derived glycosylation traits were calculated as described above for the automated glycoproteomics data analysis. Averages were calculated for duplicate measurements of the cell surface and the TCL glycoproteome.
For the molecular modeling, molecular dynamics simulations, and accessibility analysis, see Supporting Experimental Section.
Results and Discussion
Cell Surface (Glyco)Protein Enrichment via Protein Biotinylation Allows In-Depth Investigations of the Surface Proteome by Mass Spectrometry
To generate a selective and nonglycan-biased method for the study of protein-specific surface N-glycosylation, we here separated cell surface (glyco)proteins from the total pool of cellular proteins via EZ-Link Sulfo-NHS-SS-Biotin labeling of surface-exposed primary amine groups on intact cells (Figure 1).12,13 The cell surface-specificity of the optimized approach was demonstrated via in-depth label-free proteomics of the cell surface proteome of N/TERT-1 keratinocytes (3541 proteins; Table S1), showing a complete absence or prominent reduction (2 to 3 times) of secretory pathway markers GM130 (GOLGA2), mannosyl-oligosaccharide-1,2-alpha-mannosidaseIB (MAN1A2), and trans-golgi network glycoprotein 46 (TGN46) as compared to a total cell lysate analysis (TCL; 6057 proteins). Accordingly, the cell surface glycoprotein markers Integrin α5 (ITA5) and E-cadherin (CADH1) showed 30- to 80-fold enrichments in the surface preparation as compared to the TCLs (Figure 1C and D, Figure S1). Proteins from other subcellular compartments were depleted 4 (lysosomal) to 15 (nuclear) times (Figure S2), indicating high cell surface-enrichment. The specificity of the method was additionally validated in another keratinocyte cell line, HaCaT, confirming the depletion of glycoproteins residing in the secretory pathway (Figure S3).
In all, the biotin labeling of surface-exposed primary amine groups and the subsequent purification of labeled proteins led to a prominent enrichment of the surface proteome. The number of identified proteins in the surface fraction was, with more than 3000 hits, substantially higher than the surface proteins identified with glycan-mediated cell surface protein isolation methods (100–800 proteins dependent on the cell type).7,19 Importantly, glycoproteins residing in the secretory pathway were largely depleted, indicating that a distinction can be made between the cell surface glycoproteins traveling the secretory pathway as compared to the ones associated with the plasma membrane.
N/TERT-1 Cell Surface N-Glycans Are Diverse and Distinct from the Rest of the Cell
We next used the method to assess the surface N-glycome of the keratinocytes. Using nanoLC-MS for glycans released from their protein carriers, we quantified 188 individual N-glycans (Table S2). As expected, sialylated complex-type glycans dominated the surface of N-glycome (Table S3), while pauci- and oligomannosidic glycans were more prominently present in the cell lysates (Figure 1E). No specific glycosylation features were excluded from our cell surface analysis because of the glycan-independent protein labeling strategy. Immaturely processed N-glycans were also found at the cell surface (hybrid N-linked glycans, 6.0% ± 0.3%; oligomannose, 12.3% ± 1.0%; and Pauci mannose, 0.1% ± 0.0%), but much lower in abundance as compared to the glycome of TCLs (hybrid N-linked glycans, 8.5% ± 0.3%; oligomannose, 20.1% ± 1.1%; Pauci mannose, 1.4% ± 0.4%) (Figure 1E). The display of immature glycans at the cell surface was partly expected as immature glycans can reach the surface under healthy as well as disease conditions.11,20,21 Their presence, however, stipulates the heterogeneity of the cellular surface glycans and prompts the question where, and on which proteins, specific glycans are found and how they are regulated. To begin to address this question, we performed cell surface-specific N-glycoproteomics.
Cell Surface-Specific N-Glycoproteomics Yields an In-Depth Characterization of the Functionally Important N-Glycome
The keratinocyte surface glycoproteome was assessed after HILIC-fractionation22 and C18-LC-MS/MS analysis of glycopeptides (Table S4). In total, 186 proteins carrying one or more N-glycans were identified in the surface proteome, covering approximately 17% of the putative 745 N-glycoproteins based on sequence annotation in the in-depth surface proteome, as well as 58 additional ones. For these glycoproteins, 1427 individual glycopeptides (unique peptide–glycan combinations) were quantified in at least all technical replicates of the TCL or of the cell surface sample (Figure 2A, Figure S4). These numbers are comparable to the reported 112 (PNT2 cells) to 165 (Caco-2 cells) glycoprotein identifications using less specific membrane enrichment strategies for glycoproteomics.23 In agreement with the released glycan data, the glycoproteomics confirmed the absence of oligomannosidic glycans at the majority of sites on cell surface-expressed glycoproteins but also demonstrated that they were consistently present on other sites, in some cases even on the same protein (e.g., on epidermal growth factor receptor, fibronectin, neural cell adhesion molecule L1, and several integrins; Table S5). In total, we found that 38% of the glycosylated peptides in the surface glycoproteome carried more than 5% of oligomannosidic structures. As compared with the same N-glycosylation sites characterized in the total cell lysate, the oligomannosidic glycans at the cell surface were more processed (Figure 2A).
Figure 2.
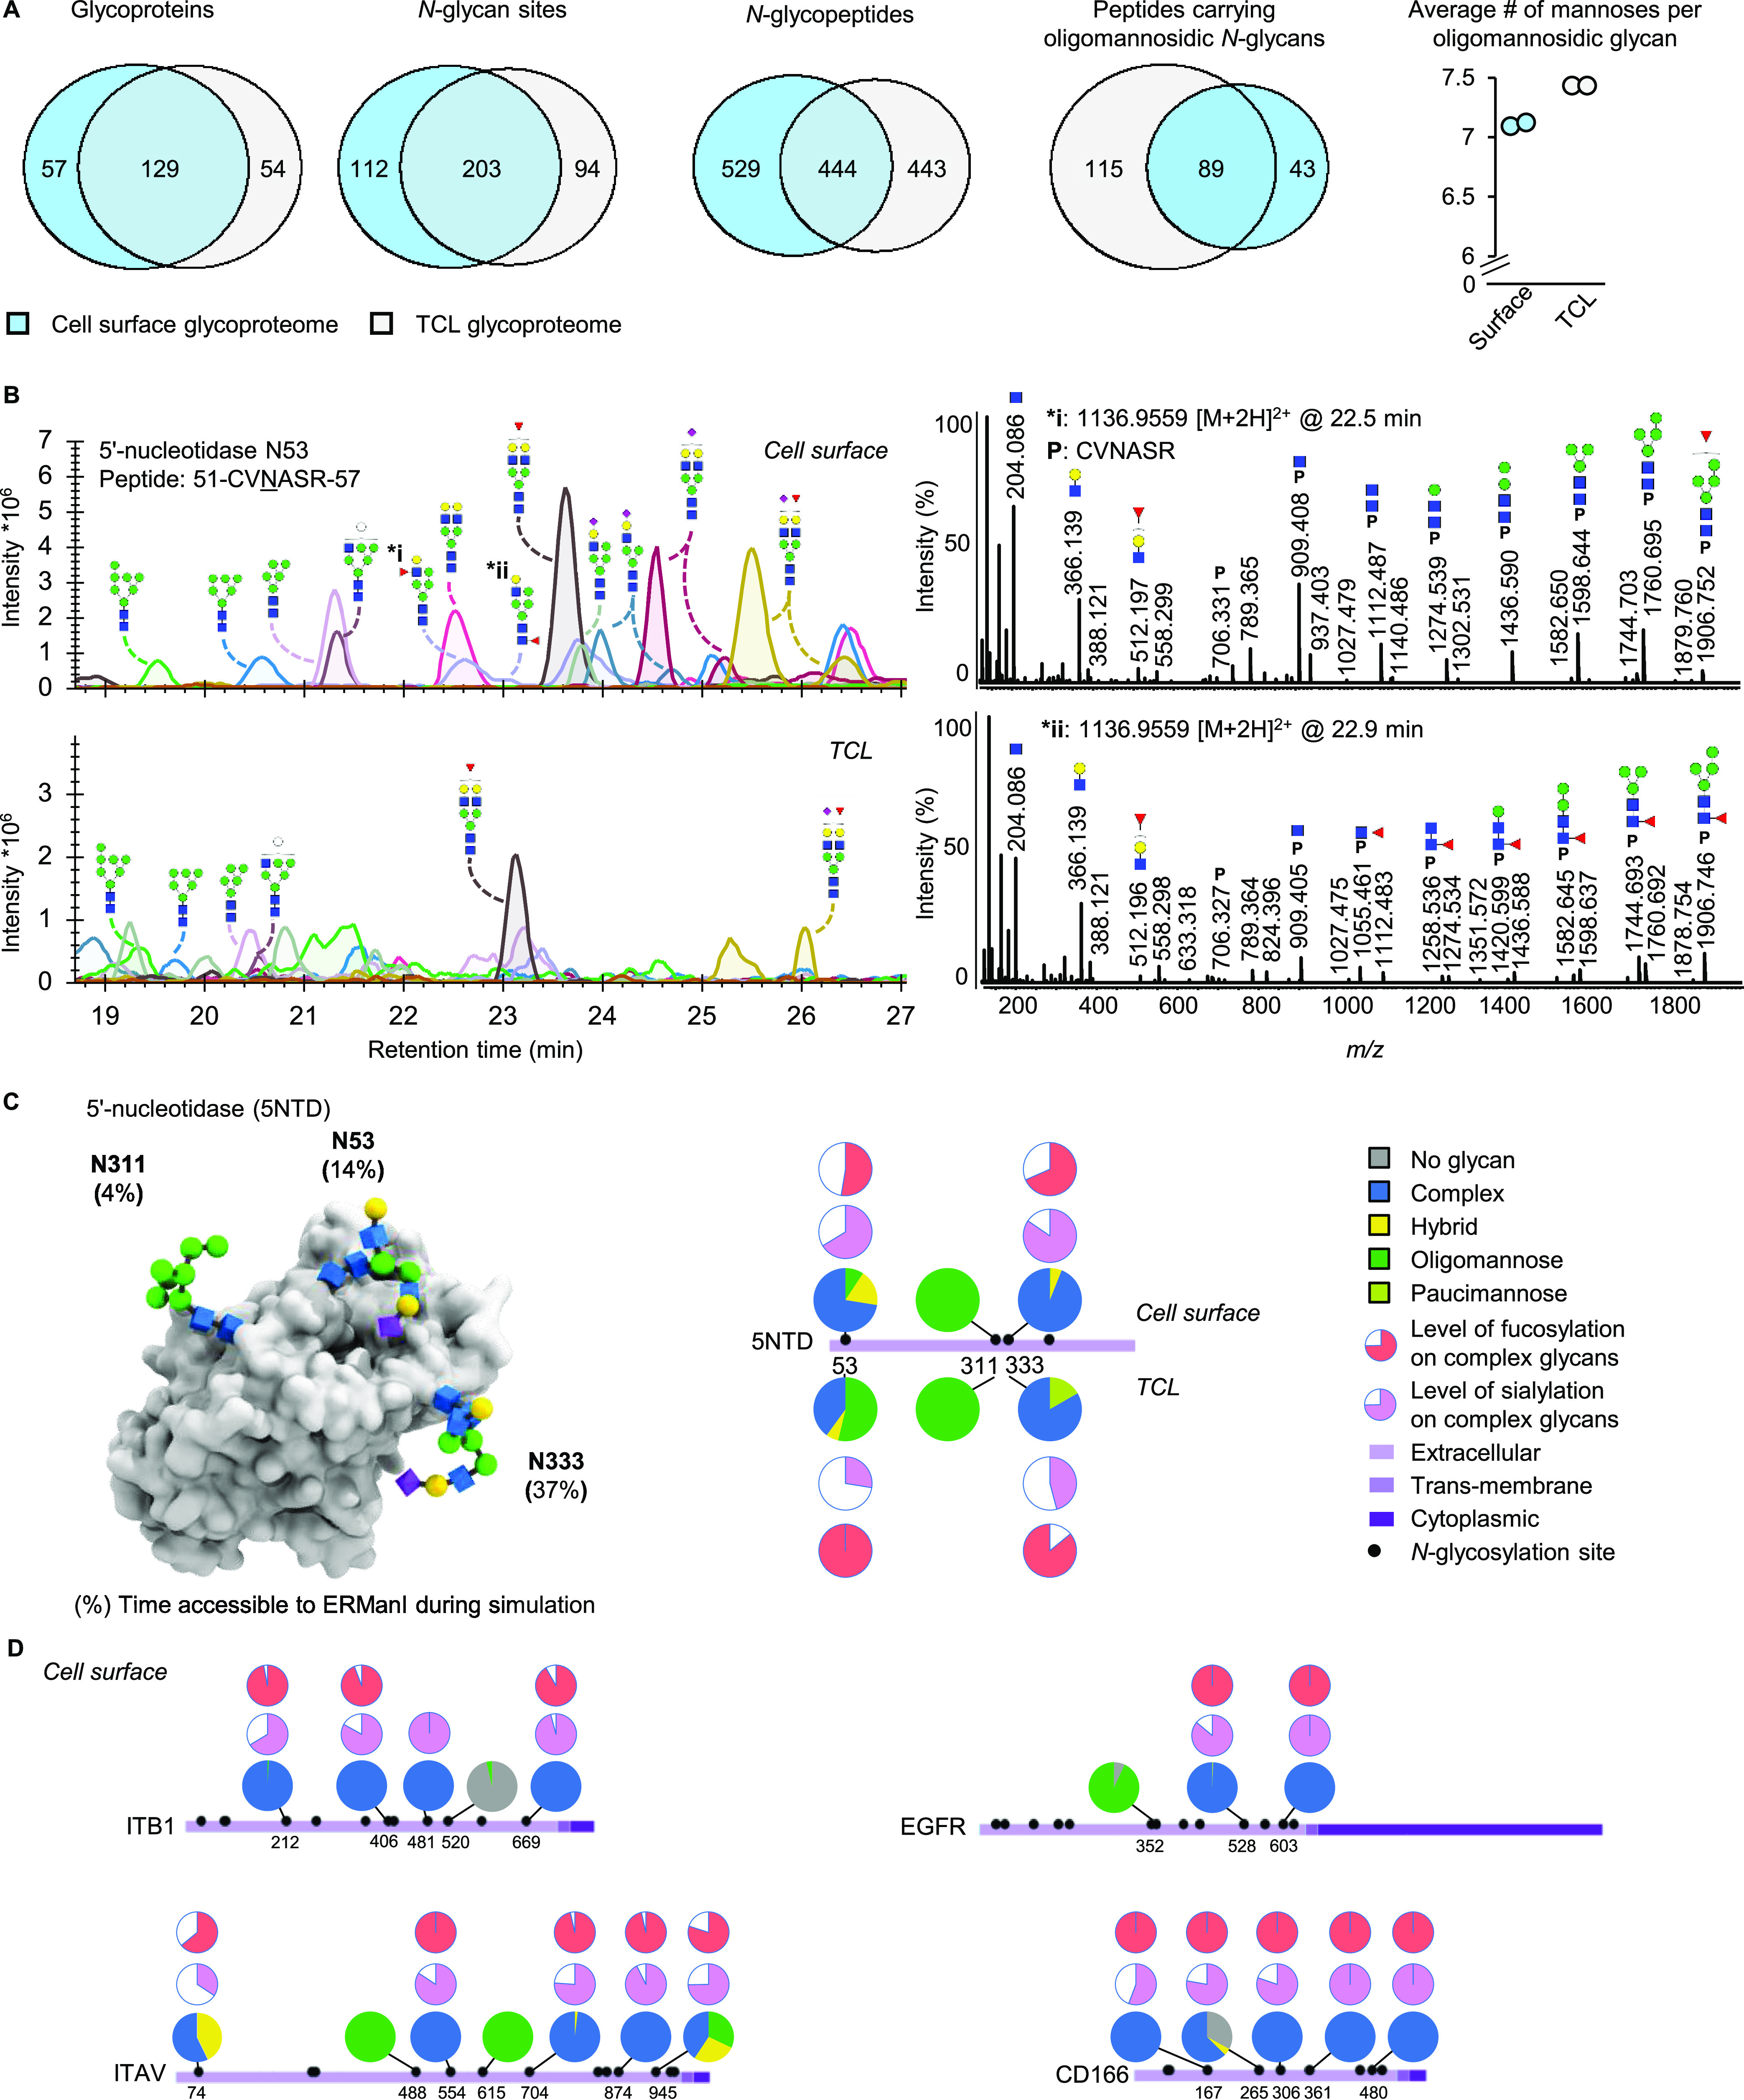
Cell surface glycoproteomics. (A) Numeric description of the cell surface and total cell lysate (TCL) N-glycoproteomes. (B) Representative LC-MS/MS glycoproteomics data showing the microheterogeneity of 5′-nucleotidase N53, including the MS/MS data of two of the isomeric glycopeptides with the glycan composition Hex5HexNAc3Fuc1 indicating structural differences in the fucose location. (C) Cell surface- and glycosylation site-specific glycosylation of 5′-nucleotidase (5NTD), including a molecular model indicating the simulated accessibility of the individual glycosylation sites for ERManI. (D) Cell surface- and glycosylation site-specific glycosylation of integrin beta 1 (ITB1), integrin alpha 5 (ITAV), epidermal growth factor receptor (EGFR), and CD166 antigen (CD166).
To further investigate and validate subcellular differences in N-glycosylation, an in-depth manual glycoform annotation and quantification was performed for 10 cell surface glycoproteins (Figure 2B; Figure S5). For integrin β1 (ITGB1), epidermal growth factor receptor (EGFR), CD59, Integrin α5 (ITAV), desmoglein-3 (DSG3), 5′-nucleotidase (5NTD), neural cell adhesion molecule L1 (L1CAM), Ly6/PLAUR domain-containing protein 3 (LYPD3), CD166, and Integrin α6 (ITA6), 34 glycosylation sites were found and 371 glycopeptides quantified (Figure 2C, Tables S6 and S7). Profound differences were observed between the microheterogeneity of certain N-glycosylation sites present at the cell surface, as compared to their counterparts in the TCL. This is well exemplified by the three glycosylation sites characterized on 5′-nucleotidase, a glycolipid-anchored plasma membrane enzyme that catalyzes the hydrolysis of nucleotide monophosphates (Figure 2C).24 While site N53 carries predominantly oligomannosidic- and hybrid-type glycans in the TCL, it was found with more than 60%, partly sialylated and fucosylated, complex-type glycans at the surface. Also, site N333 displays predominantly complex-type glycans at the surface. This site is in the TCL decorated with mature glycans as well, but with lower levels of sialylation. In contrast, site N311 was found with only oligomannosidic-type glycans, both in the TCL and on the surface.
The depth of glycopeptide identifications was improved here by HILIC SPE fractionation of the proteolytically digested samples. The subsequent reverse phase LC separation of the glycopeptides resulted in separation of structural isomers for some of the glycopeptides, the presence of which was expected based on the released glycan analysis. For the reliable identification and quantification of isomeric glycopeptides, manual data processing is currently essential. While the glycopeptide data in this study are annotated only at the compositional level, future studies are required for the structural annotation of the (isomeric) features on biologically relevant glycosylation sites.
The global N-glycoproteomics performed at the cell surface shows that we are able to separate the surface expressed glycoproteins from the other cellular compartments, yielding high quality, in-depth location-specific, and glycosylation site-specific glycomics information. The rich glycopeptide data can and should be further mined and curated based on specific research questions. While the difference in glycosylation between the intracellular and surface compartments can be explained by the step-by-step biosynthesis of N-glycans throughout the secretory pathway, the difference in glycan structures present at individual proteins and glycosylation sites displayed at the surface is less well understood. The current data can, in combination with in silico molecular dynamics or in vitro biochemical experiments, be used to assess the regulation of cell surface expressed glycosylation features.
Molecular Dynamics Simulations Correlate Glycan Site Accessibility to Glycan Maturation
For a long time, it has been a central question how the cell regulates specific glycosylation features at select sites. To address this question for two proteins, 5′-nucleotidase and integrin α5, we employed molecular modeling analysis. We performed molecular dynamics simulations of the proteins with M9 oligomannosidic glycans and assessed the ability of the early ER processing enzyme, ERManI (MAN1B1), required for the initiation the biosynthesis of complex N-linked glycans, to access the M9 oligomannose at each site. The inability for ERManI to access the outer core GlcNAc residues of an N-glycan correlated with an increased presence of oligomannosidics at the surface (Figure 2C). The modeling predicted that N53 and N333 of 5′-nucleotidase would be more processed (accessible in 14 and 37% of the modeling snapshots), providing a rationale for the predominance of mature glycans observed on these sites at the surface. On the contrary, N311 was less accessible (4%) to the enzyme, which correlated with the expression of immature glycans at the cell surface. The analysis performed similarly for integrin α5, where the relative accessibility of each site to ERManI correlated with the degree of processing at each site (Figure S6). While other factors, such as complex formation, may also play a role in glycan maturation, we here show that accessibility to early processing enzymes mediated by protein folding can determine the cell surface exposure of glycan structures.
Conclusion
The cell surface-specific protein labeling for glycoproteomics presented in the current study distinguishes itself from other cell surface enrichment approaches by covering a broad repertoire of glycoforms and by showing an improved cell surface-specificity.
We found a remarkable depletion in the presence of secretory pathway markers in the cell surface proteome, indicating the high specificity of the enrichment and providing the unique possibility of comparing cell surface glycosylation to that of the other cellular compartments. However, potential biases in the enrichment could be introduced between proteins with different numbers of surface-exposed lysine residues as primary amines are required for the biotin labeling. Furthermore, the modification of lysine residues hampers trypsin digestion and potentially results in reduced sensitivity for lysin-containing glycopeptides. Indeed, some of the glycosylation sites were partly found on peptides containing the residual label modification and one missed cleavage. Although this reduces sensitivity for some of them, it only affected a minor fraction of the sites, and glycosylation profiles were comparable between labeled and nonlabeled peptide portions.
As the method is performed on adherend 2D cultured cells, one might speculate on the difference in labeling efficiency for the apical, lateral, and basal surface of the epithelial cells. This specificity was not controlled for in the current study; however, the in-depth proteomics showed coverage of proteins expected from all compartments. Optimizing specificity for these sub-locations of the cell surface might be of high relevance for future studies.
While the method was optimized for adherent epithelial cells, we expect that the method is applicable to other cell types as well as suspension cultured cells. Importantly, not only can N-glycosylation be targeted with the current approach, but also different types of O-linked glycosylation have high potential to benefit from the improved sensitivity and specificity using the introduced enrichment strategy. We expect the applicability of the method in a wide array of glycobiological questions, of which a prominent one is the identification of cancer-specific carbohydrate epitopes present at the cell surface.16
Acknowledgments
The authors would like to thank Prof. Manfred Wuhrer (Leiden University Medical Center, The Netherlands) for the insightful discussions on this work. This project has received funding from the European Research Council (ERC) under the European Union’s Horizon 2020 research and innovation programme (GlycoSkin H2020-ERC; 772735), the European Commission (Imgene H2020 and Remodel), Lundbeck Foundation (R313-2019-869), Danish National Research Foundation (DNRF107), The Neye Foundation, The Independent Research Fund Denmark, The Friis Foundation, The Michelsen Foundation, and the A.P. Møller og Hustru Chastine Mc-Kinney Møllers Fond til Almene Formaal. R.J.W. is thankful for NSF (DMR-1933525) and NIH (1R24GM136984) for support.
Data Availability Statement
All the MS data and search files are available via the ProteomeXchange Consortium25 with the data set identifier PXD042172.
Supporting Information Available
The Supporting Information is available free of charge at https://pubs.acs.org/doi/10.1021/acs.analchem.3c03626.
Supporting Experimental Section. Details on cell staining, proteomics, and molecular dynamics. Supporting Figures. Extended figures of the cell staining, cell surface-specific proteomics, glycomics, and glycoproteomics, and the molecular modeling of glycoprotein integrin alpha (PDF)
Supporting Tables. Complete output data of the cell surface-specific proteomics, glycomics and glycoproteomics (XLSX)
The authors declare the following competing financial interest(s): Hans Wandall owns stocks and is a consultant for and co-founder of EbumabApS, Hemab ApS, and GO-Therapeutics, Inc., which are all not involved in, or related to, the research performed in this study.
Supplementary Material
References
- Schjoldager K. T.; Narimatsu Y.; Joshi H. J.; Clausen H. Global view of human protein glycosylation pathways and functions. Nat. Rev. Mol. Cell Biol. 2020, 21 (12), 729–749. 10.1038/s41580-020-00294-x. [DOI] [PubMed] [Google Scholar]
- Manning J. C.; Romero A.; Habermann F. A.; García Caballero G.; Kaltner H.; Gabius H.-J. Lectins: a primer for histochemists and cell biologists. Histochemistry and Cell Biology 2017, 147 (2), 199–222. 10.1007/s00418-016-1524-6. [DOI] [PubMed] [Google Scholar]
- Schnider B.; Escudero F. L.; Imberty A.; Lisacek F. BiotechLec: an interactive guide of commercial lectins for glycobiology and biomedical research applications. Glycobiology 2023, cwad034, na. 10.1093/glycob/cwad034. [DOI] [PMC free article] [PubMed] [Google Scholar]
- Bagdonaite I.; Malaker S. A.; Polasky D. A.; Riley N. M.; Schjoldager K.; Vakhrushev S. Y.; Halim A.; Aoki-Kinoshita K. F.; Nesvizhskii A. I.; Bertozzi C. R.; Wandall H. H.; Parker B. L.; Thaysen-Andersen M.; Scott N. E. Glycoproteomics. Nature Reviews Methods Primers 2022, 2 (1), 48. 10.1038/s43586-022-00128-4. [DOI] [Google Scholar]
- Blonder J.; Terunuma A.; Conrads T. P.; Chan K. C.; Yee C.; Lucas D. A.; Schaefer C. F.; Yu L. R.; Issaq H. J.; Veenstra T. D.; Vogel J. C. A proteomic characterization of the plasma membrane of human epidermis by high-throughput mass spectrometry. J. Invest Dermatol 2004, 123 (4), 691–9. 10.1111/j.0022-202X.2004.23421.x. [DOI] [PubMed] [Google Scholar]
- Li Q.; Xie Y.; Wong M.; Barboza M.; Lebrilla C. B. Comprehensive structural glycomic characterization of the glycocalyxes of cells and tissues. Nat. Protoc 2020, 15 (8), 2668–2704. 10.1038/s41596-020-0350-4. [DOI] [PMC free article] [PubMed] [Google Scholar]
- Wollscheid B.; Bausch-Fluck D.; Henderson C.; O’Brien R.; Bibel M.; Schiess R.; Aebersold R.; Watts J. D. Mass-spectrometric identification and relative quantification of N-linked cell surface glycoproteins. Nat. Biotechnol. 2009, 27 (4), 378–86. 10.1038/nbt.1532. [DOI] [PMC free article] [PubMed] [Google Scholar]
- Chandler K. B.; Costello C. E. Glycomics and glycoproteomics of membrane proteins and cell-surface receptors: Present trends and future opportunities. Electrophoresis 2016, 37 (11), 1407–19. 10.1002/elps.201500552. [DOI] [PMC free article] [PubMed] [Google Scholar]
- Wu C. C.; MacCoss M. J.; Howell K. E.; Yates J. R. 3rd A method for the comprehensive proteomic analysis of membrane proteins. Nat. Biotechnol. 2003, 21 (5), 532–8. 10.1038/nbt819. [DOI] [PubMed] [Google Scholar]
- Holst S.; Deuss A. J.; van Pelt G. W.; van Vliet S. J.; Garcia-Vallejo J. J.; Koeleman C. A.; Deelder A. M.; Mesker W. E.; Tollenaar R. A.; Rombouts Y.; Wuhrer M. N-glycosylation Profiling of Colorectal Cancer Cell Lines Reveals Association of Fucosylation with Differentiation and Caudal Type Homebox 1 (CDX1)/Villin mRNA Expression. Mol. Cell Proteomics 2016, 15 (1), 124–40. 10.1074/mcp.M115.051235. [DOI] [PMC free article] [PubMed] [Google Scholar]
- An H. J.; Gip P.; Kim J.; Wu S.; Park K. W.; McVaugh C. T.; Schaffer D. V.; Bertozzi C. R.; Lebrilla C. B. Extensive determination of glycan heterogeneity reveals an unusual abundance of high mannose glycans in enriched plasma membranes of human embryonic stem cells. Mol. Cell Proteomics 2012, 11 (4), M111.010660. 10.1074/mcp.M111.010660. [DOI] [PMC free article] [PubMed] [Google Scholar]
- Hormann K.; Stukalov A.; Muller A. C.; Heinz L. X.; Superti-Furga G.; Colinge J.; Bennett K. L. A Surface Biotinylation Strategy for Reproducible Plasma Membrane Protein Purification and Tracking of Genetic and Drug-Induced Alterations. J. Proteome Res. 2016, 15 (2), 647–58. 10.1021/acs.jproteome.5b01066. [DOI] [PubMed] [Google Scholar]
- Elschenbroich S.; Kim Y.; Medin J. A.; Kislinger T. Isolation of cell surface proteins for mass spectrometry-based proteomics. Expert Rev. Proteomics 2010, 7 (1), 141–54. 10.1586/epr.09.97. [DOI] [PubMed] [Google Scholar]
- Dabelsteen S.; Pallesen E. M. H.; Marinova I. N.; Nielsen M. I.; Adamopoulou M.; Romer T. B.; Levann A.; Andersen M. M.; Ye Z.; Thein D.; Bennett E. P.; Bull C.; Moons S. J.; Boltje T.; Clausen H.; Vakhrushev S. Y.; Bagdonaite I.; Wandall H. H. Essential Functions of Glycans in Human Epithelia Dissected by a CRISPR-Cas9-Engineered Human Organotypic Skin Model. Dev Cell 2020, 54 (5), 669–684. 10.1016/j.devcel.2020.06.039. [DOI] [PMC free article] [PubMed] [Google Scholar]
- Ye Z.; Kilic G.; Dabelsteen S.; Marinova I. N.; Thøfner J. F. B.; Song M.; Rudjord-Levann A. M.; Bagdonaite I.; Vakhrushev S. Y.; Brakebusch C. H.; Olsen J. V.; Wandall H. H. Characterization of TGF-β signaling in a human organotypic skin model reveals that loss of TGF-βRII induces invasive tissue growth. Science Signaling 2022, 15 (761), eabo2206 10.1126/scisignal.abo2206. [DOI] [PubMed] [Google Scholar]
- Čaval T.; Alisson-Silva F.; Schwarz F. Roles of glycosylation at the cancer cell surface: opportunities for large scale glycoproteomics. Theranostics 2023, 13 (8), 2605–2615. 10.7150/thno.81760. [DOI] [PMC free article] [PubMed] [Google Scholar]
- de Haan N.; Narimatsu Y.; Koed Møller Aasted M.; Larsen I. S. B.; Marinova I. N.; Dabelsteen S.; Vakhrushev S. Y.; Wandall H. H. In-Depth Profiling of O-Glycan Isomers in Human Cells Using C18 Nanoliquid Chromatography-Mass Spectrometry and Glycogenomics. Anal. Chem. 2022, 94 (10), 4343–4351. 10.1021/acs.analchem.1c05068. [DOI] [PMC free article] [PubMed] [Google Scholar]
- Lageveen-Kammeijer G. S. M.; de Haan N.; Mohaupt P.; Wagt S.; Filius M.; Nouta J.; Falck D.; Wuhrer M. Highly sensitive CE-ESI-MS analysis of N-glycans from complex biological samples. Nat. Commun. 2019, 10 (1), 2137. 10.1038/s41467-019-09910-7. [DOI] [PMC free article] [PubMed] [Google Scholar]
- Berg Luecke L.; Waas M.; Littrell J.; Wojtkiewicz M.; Castro C.; Burkovetskaya M.; Schuette E. N.; Buchberger A. R.; Churko J. M.; Chalise U.; Waknitz M.; Konfrst S.; Teuben R.; Morrissette-McAlmon J.; Mahr C.; Anderson D. R.; Boheler K. R.; Gundry R. L. Surfaceome mapping of primary human heart cells with CellSurfer uncovers cardiomyocyte surface protein LSMEM2 and proteome dynamics in failing hearts. Nature Cardiovascular Research 2023, 2 (1), 76–95. 10.1038/s44161-022-00200-y. [DOI] [PMC free article] [PubMed] [Google Scholar]
- Johns T. G.; Mellman I.; Cartwright G. A.; Ritter G.; Old L. J.; Burgess A. W.; Scott A. M. The antitumor monoclonal antibody 806 recognizes a high-mannose form of the EGF receptor that reaches the cell surface when cells over-express the receptor. FASEB J. 2005, 19 (7), 780-2. 10.1096/fj.04-1766fje. [DOI] [PubMed] [Google Scholar]
- Park D.; Brune K. A.; Mitra A.; Marusina A. I.; Maverakis E.; Lebrilla C. B. Characteristic Changes in Cell Surface Glycosylation Accompany Intestinal Epithelial Cell (IEC) Differentiation: High Mannose Structures Dominate the Cell Surface Glycome of Undifferentiated Enterocytes. Mol. Cell Proteomics 2015, 14 (11), 2910–21. 10.1074/mcp.M115.053983. [DOI] [PMC free article] [PubMed] [Google Scholar]
- Chen Y.-J.; Yen T.-C.; Lin Y.-H.; Chen Y.-L.; Khoo K.-H.; Chen Y.-J. ZIC-cHILIC-based stageTip for simultaneous glycopeptide enrichment and fractionation toward large-scale N-sialoglycoproteomics. Anal. Chem. 2021, 93 (48), 15931–15940. 10.1021/acs.analchem.1c03224. [DOI] [PubMed] [Google Scholar]
- Park D. D.; Xu G.; Wong M.; Phoomak C.; Liu M.; Haigh N. E.; Wongkham S.; Yang P.; Maverakis E.; Lebrilla C. B. Membrane glycomics reveal heterogeneity and quantitative distribution of cell surface sialylation. Chem. Sci. 2018, 9 (29), 6271–6285. 10.1039/C8SC01875H. [DOI] [PMC free article] [PubMed] [Google Scholar]
- Zimmermann H.; Zebisch M.; Sträter N. Cellular function and molecular structure of ecto-nucleotidases. Purinergic signalling 2012, 8, 437–502. 10.1007/s11302-012-9309-4. [DOI] [PMC free article] [PubMed] [Google Scholar]
- Perez-Riverol Y.; Csordas A.; Bai J.; Bernal-Llinares M.; Hewapathirana S.; Kundu D. J.; Inuganti A.; Griss J.; Mayer G.; Eisenacher M.; Pérez E.; Uszkoreit J.; Pfeuffer J.; Sachsenberg T.; Yılmaz Ş.; Tiwary S.; Cox J.; Audain E.; Walzer M.; Jarnuczak A. F.; Ternent T.; Brazma A.; Vizcaíno J. A. The PRIDE database and related tools and resources in 2019: improving support for quantification data. Nucleic Acids Res. 2019, 47 (D1), D442–D450. 10.1093/nar/gky1106. [DOI] [PMC free article] [PubMed] [Google Scholar]
Associated Data
This section collects any data citations, data availability statements, or supplementary materials included in this article.
Supplementary Materials
Data Availability Statement
All the MS data and search files are available via the ProteomeXchange Consortium25 with the data set identifier PXD042172.