

Abstract
Heart failure (HF) is an emerging epidemic and remains a major clinical and public health problem. Advances in the healthcare management of HF may lead to lower morbidity and mortality rates but require diagnostics to guide the process. Current diagnostics/prognostics approaches rely on expensive equipment, centralized facilities and trained personnel, marginalizing healthcare access in developing countries and rural communities. These issues have led researchers to focus on developing portable and affordable diagnostics that can be deployed at the point-of-care (POC). Typically, HF biomarkers are measured in blood not saliva. Recently, our team correlated concentrations of salivary Galectin-3 (Gal-3) to outcomes in patients with HF. We have developed an analytical device which consists of an immunoassay based on a screen-printed carbon electrode (SPCE) to quantify Gal-3 levels in saliva samples. Using 10 μL of saliva, the proposed electrochemical immunoassay achieved a concentration dependent signal response in the clinically relevant range with a limit of detection of 9.66 ng/mL. In addition, the storage stability of the modified electrode was investigated, and only a 10.9% loss in current response over a 35-day period. The results of the immunoassay on the modified SPCEs suggest validity as a POC biosensor system for the management of HF.
Keywords: Electrochemical immunoassay, Heart failure prognosis, Saliva diagnostic, Galectin-3, Point-of-care
1. Introduction
Heart failure (HF) is a condition that develops when the heart inadequately pumps blood and fails to meet the body’s need for blood and oxygen. According to the center for disease control (CDC), in 2018, 13.4% of deaths in the United States have HF complications as the cause 1. Early diagnosis and routine monitoring leads to improved patient outcomes 2. The current management of HF diagnosis remains lab-based blood tests and other diagnostic tests including echocardiogram, X-rays, electrocardiogram (EKG), and stress tests 3. Enzyme linked immunosorbent assays (ELISAs) are one of the most commonly used assays for medical diagnostics, particularly for blood-based biomarkers. ELISAs have high specificity and sensitivity, but require highly trained personnel and can take hours to days to obtain results 4. As a result, the use of these assays is limited by the time to produce results, cost of the equipment, and access to a laboratory with trained staff. With 60-70% of medical decisions depending on laboratory test results, lag time between testing and diagnosis can significantly affect patients in rural areas creating barriers which may not only limit their access to healthcare but also affect their quality 5. Therefore, regions with a primarily rural population reporting a disproportionate number of HF cases would greatly benefit from affordable, point-of-care (POC) diagnostic tests 6, 7.
There is recent scientific evidence linking oral health to systemic disease 8–12. During the height of the Covid -19, it was evident that we require alternative non-invasive sampling methods to stop the spread of the virus and saliva as a biofluid came to the fore 13–16. Because blood sampling is invasive, it can also be a problematic for elderly patients who are predominantly affected by HF. As a result, there is an interest in using non-invasive sampling, specifically saliva, for POC measurements 17–19. Saliva is available in large quantities and contains macromolecules that can be used as biomarkers 20–22.
Galectin-3 (Gal-3), a member of the galectin protein family, plays a role in a number of biological processes 23. Recently, serum Gal-3 emerged as a prognostic biomarker for cardiovascular morbidity and mortality in HF patients, and a correlation between Gal-3 concentrations in serum/saliva and HF prognosis was recently reported by our team 19, 21 24. A study by our team has demonstrated the prognostic utility of salivary Gal-3 using ELISA, where the primary endpoints were exacerbation, death or re-hospitalization. This study clearly showed that salivary Gal-3 concentrations were significantly higher (>172 ng/mL) in HF patients who reached rehospitalization, exacerbation, or death compared to those who did not experience the primary endpoints, and an interquartile range (IQR) of 65.64-308.1 ng/mL was determined. However, the complexity and experimental requirements of ELISA make this impractical for POC monitoring.
Electrochemical POC biosensors have been developed for the detection and quantification of biological analytes for communicable and non-communicable diseases and are highly desirable due to their speed, sensitivity and specificity 25. Specifically, screen printed carbon electrodes (SPCE) have become a popular platform option for electrochemical POC systems due to low cost and ability to be manipulated into many electrode geometries 26, 27. Review articles have highlighted the recent activity in POC testing for cardiac biomarkers, and the existing electroanalytical detection methods.28, 29 However, much of the detection is for established serum-based biomarkers. While Biosensors using various detection methods for Gal-3 have been reported in literature 30–33, however these biosensors are aimed towards the detection of Gal-3 in serum, with few reports focused on POC testing using other biological matrices such as saliva. For example, Cerqueira et al. developed a POC electrochemical biosensor based on molecularly imprinted polymers for Gal-3, but the biological sample was serum, not ideal for POC diagnostics. Saliva is an advantageous POC biofluid for detecting biomarkers because of the ease of collection, and the presence of organic and inorganic analytes at levels that reflect those in blood. However, using saliva as a matrix in a POC does have disadvantages such as lower abundance of analytes compared to serum concentrations 24, 34. Additionally, the viscoelastic properties and mucous nature of saliva will influence the mechanism of action of a microfluidic POC system 35–37. In addition, the type of saliva collected can influence analyte levels 34.
A POC system for the detection of salivary Gal-3 does not exist. The creation of a non-invasive saliva-based prognostic tool for HF can potentially enable equitable healthcare access to people in both developed and resource limited settings. The ideal system would provide rapid, sensitive, and quantitative results, while minimizing cost and the number of end user steps to compete with traditional HF testing methods. Here, we report the development of an electrochemical biosensor that can quantify a salivary HF biomarker within the relevant clinical ranges. The biosensor described quantitatively detects salivary Gal-3 allowing for non-invasive sampling for POC applications. SPCEs were successfully used to perform a sandwich immunoassay to quantify Gal-3 in saliva samples. Optimization of the electrode modification process is shown, along with the optimized immunoassay parameters (C-Ab concentration, D-Ab concentration, blocker concentration, and Strep-HRP dilution). A dilution study was conducted to determine optimal saliva dilution and buffer concentration for sensor performance. Calibration curves in buffer, artificial saliva, and pooled human saliva for the clinically relevant concentration ranges of salivary Gal-3 are presented. Electrode stability studies were conducted to explore the viability of the sensor’s use in a POC setting. Our research demonstrates the ability to detect proteins in saliva as the next generation of testing that will bridge the gap in access to healthcare in the developed and rural communities.
2. Materials and Methods
Buffers:
Phosphate buffer saline (PBS) was prepared by dissolving a tablet (Research Products International, USA) in Milli-Q system (MilliporeSigma, USA). 10 mM (1x) PBS composed of 140 mM sodium chloride and 2.7 mM potassium chloride at pH 7.4. The spiked buffer and dilution buffer for the pooled saliva was made by adding Tween20 to PBS to a final concentration of 0.1%.
Artificial saliva:
The spiked artificial saliva was tested to better represent the composition of human saliva. The solution contained 29.95 g of sorbital, 1 g of methyl-4-hydroxybenzoate, 0.87 g of sodium chloride, 0.8 g of di-potassium hydrogen orthophosphate, 0.62 g of potassium chloride, 0.3 g of potassium di-hydrogen orthophosphate, 0.17 g of calcium chloride, 0.06 g of magnesium chloride, and 0.0044 g of sodium fluoride in 1000 mL of deionized water 38.
Human saliva samples:
The pre-COVID saliva samples from pooled human donors were obtained from Lee Biosolutions (Maryland Heights, Missouri). The saliva form was raw, unprocessed liquid and stored at −20 °C. To measure Gal-3 concentration in the saliva samples, we used R&D human Galectin-3 Duo set ELISA Kit (DY1154, R&D Systems, United States). The signal response of the pooled saliva sample along with the 4PL equation was used to estimate the Gal-3 concentration to 1.20 ng/mL. The calibration curve of the well-plate ELISA is shown in Fig. S1. Human saliva for making the calibration standards was not filtered. The Gal-3 concentration detected in this saliva sample was significantly lower than the biosensor’s limit of detection. Therefore, we disregarded the native Gal-3 concentration in the subsequent spiked-in experiment.
Electrode fabrication:
A three-electrode system was screen printed on PET film (9984, 3M) using carbon ink (Cl-2057, Engineered Materials Solutions, Inc.) and a mesh screen. Following printing, the ink was dried at 60°C. Dielectric ink wells were then screen-printed around the working electrode and UV cured until dry. Reference electrode was painted over with a thin layer of Ag|AgCl paste (Sigma-Aldrich). Finally, an adhesive well was placed around the working, counter, and reference electrodes mimicking the size of a future fluidic channel and to confine the solutions.
SPCE modification:
SPCEs were modified by dropcasting 10 μL of 25 ug/mL capture antibody (C-Ab) (R & D Systems, MAB11541) on the working electrode, inside the dielectric ink well. Capture antibody was taken from a stock solution and diluted in PBS. The electrodes were dried in a covered petri dish at 37°C. Once dry, 5 μL of 1% bovine serum albumin (BSA) in PBS was dropped into the dielectric well until dry at room temperature to prevent non-specific adsorption to the electrode surface.
SPCE testing:
Modified SPCEs were tested by dropping 10 μL of spiked samples (n=3) into the well and incubated at room temperature in a humid chamber for 2 h. Following the incubation period, the electrodes were washed with PBST followed by PBS using solid stream spray bottles. Next, 10 μL of 1 ug/mL detection antibody (D-Ab) (R & D Systems, BAF1154) diluted in PBS was dropped into the dielectric well and incubated for 2 h in a humid chamber. After washing with PBST and PBS, horseradish peroxidase (HRP) conjugated streptavidin is dropped in the well and incubated for 20 min. Subsequently, the final PBST and PBS wash is performed, and PBS is dropped in the well to hold the electrodes until measurements are performed. Tetramethylbenzidine (TMB) was then added to the electrode surface, confined by the well, and incubated for 2 min. Immediately following the TMB incubation, a 2-min chronoamperometry measurement was started. Using a portable potentiostat (Palmsens4), a 0.0 V potential was applied to the working electrode (vs the reference electrode) while the current was recorded between the working and the counter electrodes.
Data analysis:
Chronoamperometry traces were averaged on a 10 s interval (110 s to 120 s). This range was chosen to avoid the initial charging current and to evaluate the plateau current. When noted, blank samples made in the same media as the samples tested without spiked Gal-3, were run in parallel to spiked samples to get a measure of the background current and used to get the ΔI from each sample. The blank subtracted current was determined from the mean background current subtracted from the sample current.
Fig. 1 is provided to show a visual representation of the entire electrochemical immunoassay. The total time for electrochemical detection was 2 hours 20 min.
Fig. 1.

General electrochemical detection mechanism for sandwich immunoassays on a SPCE. The reference electrode (RE), counter electrode (CE), and working electrode (WE) are shown with diagram representing a modified working electrode during the assay. Once the antigen is captured by the capture antibody immobilized on the surface, HRP-labeled detection antibody binds to form the immunoglobulin complex. The facilitates oxidation of substrate TMB to oxTMB, an electrochemical compound, that is detected via chronoamperometry.
3. Results and Discussion
3.1-. Electrode Modification
The immobilization of antibodies to the SPCE surface is a critical step for developing electrochemical immunosensors. The antibody immobilization technique can control surface coverage, correct antibody orientation, and improve sensor stability. In this study, passive adsorption was used for antibody immobilization. Protein adsorption on surfaces is a well-studied phenomenon, and passive adsorption of antibodies on a carbon electrode surface is a well-documented approach throughout the literature 39. Recently, Sharafeldin et al. investigated six different antibody immobilization strategies on carbon electrodes and found passive adsorption resulted in the best limit of detection while maintaining an adequate dynamic range and percentage of active antibodies values compared to the other tested strategies 40. Furthermore, passive adsorption is the easiest approach for mass production of biosensors. Passive adsorption was also used to immobilize BSA as the blocker. On hydrophobic surfaces, the nonpolar regions of BSA are attracted towards the surface of the electrode forming a compact and stable monolayer 41. To show the addition of capture antibody and blocker to the electrode surface, capture antibody was dropcast on the working electrode and dried at 37°C before blocking with BSA. As seen in Fig. 2A, three cyclic voltammograms using 5 mM/5 mM ferri/ferrocyanide in 0.1M KCl are shown. The corresponding peak current and ΔE values shown in Table S1 after electrode modification with the capture antibody and blocker prove successful adsorption of antibody and blocker, as the electroactive surface area of the SPCE is reduced. These results show passive adsorption successfully immobilized both proteins to the electrode surface. Fig. 2B shows optimization of the drying temperature for the C-Ab. The results show C-Ab drying at three different temperatures, proceeded by a complete electrochemical immunoassay using 172 ng/mL of Gal-3 spiked in PBS buffer (n=3). Statistically, there was no difference in signal between the tested temperatures, however the capture antibody dried faster at 37°C allowing for a shorter overall electrode preparation time. As a result, 37°C was chosen as the temperature to immobilize capture antibody for the assay.
Fig. 2.

(A) Cyclic voltammograms (CVs) of 5 mM Ferrocyanide/Ferricyanide (Fe(CN)63−/4−) and potential vs. Ag/AgCl on bare SPCE, Gal-3 capture antibody (C-Ab) immobilized on SPCE, and Gal-3 C-Ab and BSA immobilized on SPCE. (B) Gal-3 C-Ab was passively adsorbed at varying temperatures and then an assay was performed to compare resulting signals. Data is from chronoamperometry recorded using the electrochemical detection method for 172 ng/mL spiked PBS.
3.2-. Assay Optimization
Optimization tests were performed for the concentrations of capture antibody, blocker, detection antibody, and the streptavidin-HRP dilution. For each condition, the full assay was run using buffer as the sample matrix while the other conditions were held constant. The assay was performed in triplicate with a Gal-3 concentration of 172 ng/mL and blanks. The ideal conditions would result in the greatest signal in contrast with the lowest signal blanks while keeping the error to a minimum. Next, the blank subtracted average current was compared for different concentration of the forementioned parameters. The determined optimized parameters were 25 μg/mL C-Ab, 1% BSA in PBS blocking solution, and 1 μg/mL D-Ab. These conditions were chosen for use in attaining a calibration curve in spiked PBS in Fig. 3A and spiked artificial saliva in Fig. 2B.
Fig. 3.

(A) The calibration curve for Gal-3 spiked PBS and (B) for spiked artificial saliva plotted on a log scale showing blank subtracted current. Symbols and error bars represent average and standard deviation over a 10 s interval. Seven different clinically relevant Gal-3 concentrations were tested, 0-372 ng/mL to evaluate the sensitivity of the proposed immunoassay. The chronoamperograms at various Gal-3 concentrations were collected on 3 separate electrodes (n=3). Data is fit with a 4-parameter logistic (4PL) curve.
The analytical performance of the SPCE assay was assessed over a range of clinically relevant Gal-3 concentrations in buffer and artificial saliva. The average signal and standard deviation of the triplicate measurements were used to generate the calibration curve shown in Fig. 3. The limit of detection (LOD) was determined to be 37.5 ng/mL. The graph shows a clear separation in the current responses between concentrations below and above the previously determined critical value of 172 ng/mL. These results demonstrate a sensitive biosensor capable of detecting Gal-3 in buffer below clinically determined interquartile range.
After demonstration of the assay performance in spiked buffer samples, the assay was tested in artificial saliva, an electrolyte solution used to mimic the composition of saliva. The same procedure and conditions used to produce the calibration curve in buffer were followed here, however Gal-3 was spiked into artificial saliva. The calibration curve generated by this data set is shown in Fig. 3B and the LOD was determined to be 8.97 ng/mL. The absence of the hook effect and a LOD well below clinically determined interquartile range are promising results considering the expected loss in sensitivity when switching towards real saliva samples.
3.3-. Optimization of Saliva Sample for Assay Performance
3.3.1. Determining Optimal Saliva Dilution
To better evaluate the electrochemical immunoassay performance in real saliva samples, we analyzed Gal-3 spiked into pooled human saliva samples. Although the binding domain of antibodies is specific to their epitopes, the composition of saliva may cause interference from nonspecific adsorption, competitive adsorption, and/or slow the diffusional process affecting the signal due to increased background or higher variation between measurements. We sought to determine if we could reduce these effects by taking advantage of the sensitivity of the proposed assay. Since the LODs determined earlier were below the interquartile range, we carried out a saliva sample dilution study to investigate the performance of our biosensor in undiluted and diluted saliva samples in PBST. Using the same experimental conditions as Fig. 3, we tested two different Gal-3 concentrations spiked into three different sample dilutions. The Gal-3 concentrations used were 65 ng/mL and 300 ng/mL to best represent the high and low concentrations of the determined clinically relevant ranges. Along with the undiluted Gal-3 spiked saliva sample, 50% and 75% sample dilutions were evaluated. For the diluted samples, Gal-3 was spiked into undiluted saliva and serial diluted. The resulting dilutions yielded 32.5 ng/mL and 150 ng/mL of Gal-3 for 50% dilutions, and 16.25 ng/mL and 75 ng/mL of Gal-3 for 75% samples.
Fig. 4A demonstrates the current responses for each dilution of saliva samples. The data shows a higher background current and no statistically significant difference in the average current between the two different concentrations. The 75% diluted sample showed a reduced blank signal but a similar signal difference to the undiluted sample. Dilution of the saliva sample to 50% resulted in lower overall blank current than undiluted saliva. The separation of the current magnitudes between the low and high concentrations was most significant in the 50% dilution. Therefore, we determined 50% sample dilution performed best on our electrochemical immunoassay, and proceeding experiments were conducted this sample dilution.
Fig. 4.
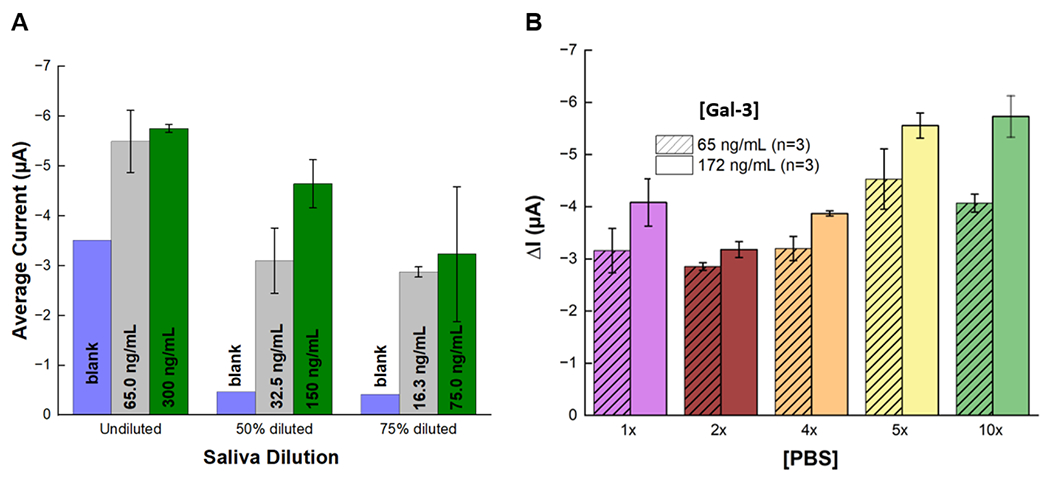
Comparison of current generated at different Gal-3 concentrations for two different saliva preparations. (A) Saliva was spiked with low and high concentrations and tested before and after dilution with 1x PBS for determining optimal saliva dilution. (B) Saliva was spiked with low and intermediate concentrations and diluted 50% in different PBS concentrations for optimization of dilution buffer. Data is from chronoamperograms recorded from the SPCEs at each concentration and each dilution (n=3) to obtain the blank subtracted current mean and standard deviation.
3.3.2-. Optimizing Dilution Buffer
The ability to differentiate between Gal-3 concentrations with the smallest amount of deviation is essential for the prognostic capacity of our biosensor. A recent study showed the pH, ionic strength, and buffering capacity are important parameters for the prevention of nonspecific interactions that could lead to false results 42. To determine the ideal buffer for saliva dilution and immunoassay performance, five PBS concentrations were used (ie.1x, 2x, 4x, 5x and 10x) to dilute the saliva samples. These concentrations were chosen because they possess different ionic strengths and have a pH within the optimal range for antigen-antibody interactions. The plot showing the signal produced at two Gal-3 concentrations for each PBS concentration is shown in Fig. 4B. The 10x PBS concentration produced the largest difference in current between the Gal-3 concentrations, and, as the PBS concentration was reduced, the current magnitudes also decreased. However, a drop in overall current output from 1x PBS to 2x PBS was observed. One theory to explain the initial decrease in current magnitude is that the initial increase in PBS concentration prevents non-specific interactions causing less background signal, and at higher PBS concentrations more immunoglobulin complexes are formed attributing to higher and more consistent current output 42. The exact mechanism for the effect of ionic strength on our system remains unknown and is the subject of further investigations.
3.4-. Calibration Curve in Saliva
To evaluate the prognostic potential of Gal-3 for HF, we tested our modified SPCEs in pooled saliva samples using nine different Gal-3 concentrations. Chronoamperograms for varying concentrations of Gal-3 in saliva are shown in Figure 5A. Each concentration was tested in triplicate measurement on separate SPCEs, and the data set is plotted and fit with a 4PL model to generate the calibration curve, Fig. 5B. The graph shows an increase in ΔI with increasing Gal-3 concentrations following the expected sigmoidal dose-response curve. The calculated LOD of the electrochemical immunoassay was found to be 9.66 ng/mL when using 10μL of the diluted pooled saliva sample. It is important to emphasize that the concentrations labeled on Fig. 5 are before 50% dilution and are presented as undiluted concentrations to highlight the assay’s capability for the detection of clinically relevant Gal-3 concentrations. These results demonstrate the ability of the immunoassay to quantify the HF biomarker, Gal-3, in pooled human saliva. This is the first reported electrochemical sensor for salivary Gal-3. Furthermore, the assay shows sensitivity in the clinically determined interquartile range using a sample volume of 10μL. Compared to traditional, plate-based ELISA tests, the electrochemical immunoassay reduces assay time and reagent volumes and allows for measurement using portable instrumentation.
Fig. 5.

Electrochemical detection of salivary Gal-3 in 10 μl samples. (A) Representative chronoamperograms obtained from varying concentrations of Gal-3 in spiked pooled human saliva that was diluted 50% in 10x PBS on modified SPCE using the electrochemical immunoassay. (B) Corresponding calibration curve plotted on a log scale showing ΔI averaged over a 10s interval centered on 115s for 10ul samples (n=3) with error bars showing the standard deviation. Data is fit with a 4PL.
3.5-. Stability of the Electrodes
Since this POC diagnostic tool is intended for use in clinical and at-home settings, the stability of the modified electrode and optimal storage conditions are important. Designing a biosensor that can be stored for long time periods in commonly available conditions allow for a more practical biosensing platform. To initially determine storage stability of the electrode modifications, electrodes were tested after being stored at 5°C with desiccant pouches. Results are shown in Fig. 6. The electrode response stayed between −5.28 μA and −4.32 μA for 172 ng/mL over a 35-day period. The percent change in current response from day 0, the day the electrodes were modified, to day 35 was 10.9%. The long-term stability of the electrodes in possible available storage conditions in a POC setting is promising for the continued development towards a market-ready POC test. It is common for sensors with immobilized antibodies to be stored in dry conditions due to faster protein degradation in humid environments 43–45. The stability is difficult to compare to other reported immunoelectrochemical biosensors for Gal-3 because reported sensors were developed for detection in plasma or serum 30, 32, 46. The reported results show promising long-term stability for the modified electrodes. However, the ideal POC sensor should be stable for more than 6 months, and as the sensor gets closer to being implemented into a POC system a longer stability study using spiked saliva should be performed.
Fig. 6.

Plot showing stability of blank subtracted current for modified electrodes stored at 5C with desiccant. Data is from chronoamperometry recorded using the electrochemical detection method for 172 ng/mL spiked saliva minus the blank current. Mean and error is from 3 electrodes ran for each day and for each condition. Day 0 is the day the electrodes were modified. The linear fit line shows the 10.9% decrease in signal response.
Conclusion
This work presents a novel sensitive sandwich electrochemical immunosensor for the detection of Gal-3 in a highly viscoelastic medium, human saliva. SPCEs modified using passive adsorption were implemented as the assay substrate and demonstrated successful analytical performance within the clinical range of salivary Gal-3 and achieved a limit of detection of 9.66 ng/mL. The concentration dependent response around the critical 172 ng/mL will give important feedback concerning the patient’s prognosis due to HF. Compared to traditional approaches such as ELISA, the assay uses lower amounts of reagents and reduces run time while requiring less steps. The reported assay would allow for continuous monitoring of a HF biomarker using non-invasive sampling. The stability of the electrode modification was tested and due to the small amount of signal loss the modified electrodes offer the potential for a long shelf life required in POC test.
Future work will focus on the integrating of the sensor into an automated and easy to use microfluidic system, validating the assay using clinical samples, multiplexing for dual detection of other biomarkers, and testing compatibility with low-cost portable potentiostats 47. Our research presents an important first step towards an electrochemical, non-invasive POC quantitative test for Gal-3, a HF biomarker.
Supplementary Material
Highlights.
Developed an immunosensor on a screen-printed carbon electrode for heart failure biomarker
Electrochemical detection of Galectin-3 in saliva
Sensitive detection in clinically relevant concentration range with LOD of 9.66 ng/mL
an important first step towards an electrochemical, non-invasive POC quantitative test for Gal-3, a HF biomarker
Acknowledgements
This work was supported by a grant from the National Institutes of Health (R21EB030349).
Chamindie Punyadeera is currently receiving funds from Cancer Australia (APP1145657), National Health and Medical Research Council (APP 2002576 and APP 2012560), and the Garnett Passe and Rodney Williams Foundation.
Biographies
Trey W. Pittman: Trey Pittman is a PhD candidate in the Department of Chemistry at Colorado State University. He obtained his BS degree in Biochemistry at Mississippi College. His research interest is in the development of analytical devices for point-of-care diagnostics. Specifically, he focuses on the implementation of electrochemical biosensors in low-cost microfluidic systems.
Xi Zhang: Xi Zhang undertook a PhD in Queensland University of Technology. During his PhD CI Zhang published his work on salivary HF biomarker discovery in multiple high impact Q1 journal. Xi Zhang is now an early career researcher working at the Saliva and Liquid Biopsy Research Team, Griffith University. His major research interest involves using novel proteomics methods to identify novel biomarkers for systemic and local diseases.
Chamindie Punyadeera: Chamindie Punyadeera, Clinical Chemist, graduated from the Department of Chemical Pathology, the University of Witwatersrand, Johannesburg, South Africa in 2001. Her PhD research was aimed at investigating the pathogenesis and clinical manifestation of type 2 Diabetes, ischemic heart disease and obesity. Currently, she is a professor at Griffith University in the Head, Saliva and Liquid Biopsy Translational Laboratory located in Nathan, Queensland, Australia.
Charles S. Henry: Chuck Henry received his PhD from the University of Arkansas followed by postdoctoral studies at the University of Kansas. He started his academic career at Mississippi State University before moving to Colorado State University in 2002, where he is currently Professor of Chemistry. His research interests lie broadly in the areas of microfluidics and electrochemistry with application to questions in bioanalytical and environmental chemistry.
Footnotes
Publisher's Disclaimer: This is a PDF file of an unedited manuscript that has been accepted for publication. As a service to our customers we are providing this early version of the manuscript. The manuscript will undergo copyediting, typesetting, and review of the resulting proof before it is published in its final form. Please note that during the production process errors may be discovered which could affect the content, and all legal disclaimers that apply to the journal pertain.
CRediT authorship contribution statement
Trey Pittman: Conceptualization, Methodology, Investigation, Validation, Resources, Visualization, Writing – original draft, Data Analysis.
Chamindie Punyadeera: Conceptualization, Management, Data Analysis, Writing.
Xi Zhang- Methodology and Writing
Charles Henry: Conceptualization, Management, Data Analysis, Writing.
Declaration of competing interest
The authors declare that they have no known competing financial interests.
References
- 1.Virani SS; Alonso A; Benjamin EJ; Bittencourt MS; Callaway CW; Carson AP; Chamberlain AM; Chang AR; Cheng S; Delling FN; Djousse L; Elkind MSV; Ferguson JF; Fornage M; Khan SS; Kissela BM; Knutson KL; Kwan TW; Lackland DT; Lewis TT; Lichtman JH; Longenecker CT; Loop MS; Lutsey PL; Martin SS; Matsushita K; Moran AE; Mussolino ME; Perak AM; Rosamond WD; Roth GA; Sampson UKA; Satou GM; Schroeder EB; Shah SH; Shay CM; Spartano NL; Stokes A; Tirschwell DL; Vanwagner LB; Tsao CW, Heart Disease and Stroke Statistics—2020 Update: A Report From the American Heart Association. Circulation 2020, 141 (9). [DOI] [PubMed] [Google Scholar]
- 2.Udelson JE; Stevenson LW, The Future of Heart Failure Diagnosis, Therapy, and Management. Circulation 2016, 133 (25), 2671–2686. [DOI] [PubMed] [Google Scholar]
- 3.King M; Kingery J; Casey B, Diagnosis and evaluation of heart failure. Am Fam Physician 2012, 85 (12), 1161–8. [PubMed] [Google Scholar]
- 4.Cox K; Devanarayan V; Kriauciunas A; Manetta J; Montrose C; Sittampalam S, Assay Guidance Manual. Eli Lilly and Company and the National Center for Advancing Translational Sciences 2014. [PubMed] [Google Scholar]
- 5.Rohr U-P; Binder C; Dieterle T; Giusti F; Messina CGM; Toerien E; Moch H; Schäfer HH, The value of in vitro diagnostic testing in medical practice: a status report. PLoS ONE 2016, 11 (3), e0149856. [DOI] [PMC free article] [PubMed] [Google Scholar]
- 6.Virani SS; Alonso A; Aparicio HJ; Benjamin EJ; Bittencourt MS; Callaway CW; Carson AP; Chamberlain AM; Cheng S; Delling FN; Elkind MSV; Evenson KR; Ferguson JF; Gupta DK; Khan SS; Kissela BM; Knutson KL; Lee CD; Lewis TT; Liu J; Loop MS; Lutsey PL; Ma J; Mackey J; Martin SS; Matchar DB; Mussolino ME; Navaneethan SD; Perak AM; Roth GA; Samad Z; Satou GM; Schroeder EB; Shah SH; Shay CM; Stokes A; Vanwagner LB; Wang N-Y; Tsao CW, Heart Disease and Stroke Statistics—2021 Update. Circulation 2021, 143 (8). [DOI] [PubMed] [Google Scholar]
- 7.Agriculture, U. S. D. o., State Fact Sheets: Mississippi Service, E. R., Ed. https://data.ers.usda.gov/reports.aspx?StateFIPS=28&StateName=Mississippi&ID=17854, 2022.
- 8.Punyadeera C; Dimeski G; Kostner K; Beyerlein P; Cooper-White J, One-step homogeneous C-reactive protein assay for saliva. J Immunol Methods 2011, 373 (1-2), 19–25. [DOI] [PubMed] [Google Scholar]
- 9.Foo JYY; Wan Y; Kostner K; Arivalagan A; Atherton J; Cooper-White J; Dimeski G; Punyadeera C, NT-ProBNP Levels in Saliva and Its Clinical Relevance to Heart Failure. PLoS ONE 2012, 7 (10), e48452. [DOI] [PMC free article] [PubMed] [Google Scholar]
- 10.Zhang X; Wan Y; Cooper-White J; Dimeski G; Atherton J; Punyadeera C, Quantification of D-dimer levels in human saliva. Bioanalysis 2013, 5 (18), 2249–56. [DOI] [PubMed] [Google Scholar]
- 11.Punyadeera C; Slowey PD, Chapter 22 - Saliva as an emerging biofluid for clinical diagnosis and applications of MEMS/NEMS in salivary diagnostics. In Nanobiomaterials in Clinical Dentistry (Second Edition), Subramani K; Ahmed W, Eds. Elsevier: 2019; pp 543–565. [Google Scholar]
- 12.Fiorillo L, Oral health: the first step to well-being. MDPI: 2019; Vol. 55, p 676. [DOI] [PMC free article] [PubMed] [Google Scholar]
- 13.Kevadiya BD; Machhi J; Herskovitz J; Oleynikov MD; Blomberg WR; Bajwa N; Soni D; Das S; Hasan M; Patel M; Senan AM; Gorantla S; McMillan J; Edagwa B; Eisenberg R; Gurumurthy CB; Reid SPM; Punyadeera C; Chang L; Gendelman HE, Diagnostics for SARS-CoV-2 infections. Nat Mater 2021, 20 (5), 593–605. [DOI] [PMC free article] [PubMed] [Google Scholar]
- 14.Nihal S; Guppy-Coles K; Gholami MD; Punyadeera C; Izake EL, Towards Label-free detection of viral disease agents through their cell surface proteins: Rapid screening SARS-CoV-2 in biological specimens. SLAS Discov 2022, 27 (6), 331–336. [DOI] [PMC free article] [PubMed] [Google Scholar]
- 15.Han M-Y; Xie T-A; Li J-X; Chen H-J; Yang X-H; Guo X-G, Evaluation of Lateral-Flow Assay for Rapid Detection of Influenza Virus. Biomed Res. Int 2020, 2020, 3969868. [DOI] [PMC free article] [PubMed] [Google Scholar]
- 16.Zhang K; Shoukat A; Crystal W; Langley JM; Galvani AP; Moghadas SM, Routine saliva testing for the identification of silent coronavirus disease 2019 (COVID-19) in healthcare workers. Infection Control & Hospital Epidemiology 2021, 42 (10), 1189–1193. [DOI] [PMC free article] [PubMed] [Google Scholar]
- 17.Pittman TW; Decsi DB; Punyadeera C; Henry CS, Saliva-based microfluidic point-of-care diagnostic. Theranostics 2023, 13 (3), 1091–1108. [DOI] [PMC free article] [PubMed] [Google Scholar]
- 18.Khan R; Khurshid Z; Yahya Ibrahim Asiri F, Advancing Point-of-Care (PoC) Testing Using Human Saliva as Liquid Biopsy. Diagnostics 2017, 7 (3), 39. [DOI] [PMC free article] [PubMed] [Google Scholar]
- 19.Amin HZ; Amin LZ; Wijaya IP, GALECTIN-3: A NOVEL BIOMARKER FOR THE PROGNOSIS OF HEART FAILURE. Medicine and Pharmacy Reports 2017, 90 (2), 129–132. [DOI] [PMC free article] [PubMed] [Google Scholar]
- 20.Zhang X; Schulz BL; Punyadeera C, The current status of heart failure diagnostic biomarkers. Expert Rev Mol Diagn 2016, 16 (4), 487–500. [DOI] [PubMed] [Google Scholar]
- 21.Zhang X; Wan Y; Chata R; Brazzale A; Atherton JJ; Kostner K; Dimeski G; Punyadeera C, A pilot study to demonstrate diagnostic potential of galectin-3 levels in saliva. J Clin Pathol 2016, 69 (12), 1100–1104. [DOI] [PubMed] [Google Scholar]
- 22.Zhang X; Karunathilaka N; Senanayake S; Subramaniam VN; Chan W; Kostner K; Fraser J; Atherton JJ; Punyadeera C, The potential prognostic utility of salivary galectin-3 concentrations in heart failure. Clin Res Cardiol 2020, 109 (6), 685–692. [DOI] [PubMed] [Google Scholar]
- 23.Sciacchitano S; Lavra L; Morgante A; Ulivieri A; Magi F; De Francesco GP; Bellotti C; Salehi LB; Ricci A, Galectin-3: One Molecule for an Alphabet of Diseases, from A to Z. International journal of molecular sciences 2018, 19 (2), 379. [DOI] [PMC free article] [PubMed] [Google Scholar]
- 24.Zhang X; Karunathilaka N; Senanayake S; Subramaniam VN; Chan W; Kostner K; Fraser J; Atherton JJ; Punyadeera C, The potential prognostic utility of salivary galectin-3 concentrations in heart failure. Clinical Research in Cardiology 2020, 109 (6), 685–692. [DOI] [PubMed] [Google Scholar]
- 25.Wang X; Uchiyam S, Polymers for Biosensors Construction. InTech: 2013. [Google Scholar]
- 26.Yáñez-Sedeño P; Campuzano S; Pingarrón JM, Screen-Printed Electrodes: Promising Paper and Wearable Transducers for (Bio)Sensing. Biosensors (Basel) 2020, 10 (7). [DOI] [PMC free article] [PubMed] [Google Scholar]
- 27.Wang X; Zhang Z; Wu G; Xu C; Wu J; Zhang X; Liu J, Applications of electrochemical biosensors based on functional antibody-modified screen-printed electrodes: a review. Analytical Methods 2022, 14 (1), 7–16. [DOI] [PubMed] [Google Scholar]
- 28.Alawieh H; El Chemaly T; Alam S; Khraiche M, Towards Point-of-Care Heart Failure Diagnostic Platforms: BNP and NT-proBNP Biosensors. Sensors 2019, 19 (22), 5003. [DOI] [PMC free article] [PubMed] [Google Scholar]
- 29.Crapnell RD; Dempsey NC; Sigley E; Tridente A; Banks CE, Electroanalytical point-of-care detection of gold standard and emerging cardiac biomarkers for stratification and monitoring in intensive care medicine - a review. Mikrochim Acta 2022, 189 (4), 142. [DOI] [PMC free article] [PubMed] [Google Scholar]
- 30.Tang Z; He J; Chen J; Niu Y; Zhao Y; Zhang Y; Yu C, A sensitive sandwich-type immunosensor for the detection of galectin-3 based on N-GNRs-Fe-MOFs@AuNPs nanocomposites and a novel AuPt-methylene blue nanorod. Biosens. Bioelectron 2018, 101, 253–259. [DOI] [PubMed] [Google Scholar]
- 31.Liu H; Cheng Y; Chen Y; Xiao H; Sui Y; Xie Q; Liu R; Yang X, Dual-signal sandwich-type electrochemical immunoassay of galectin-3 using methylene blue and gold nanoparticles biolabels. Journal of Electroanalytical Chemistry 2020, 861, 113952. [Google Scholar]
- 32.Cerqueira SMV; Fernandes R; Moreira FTC; Sales MGF, Development of an electrochemical biosensor for Galectin-3 detection in point-of-care. Microchemical Journal 2021, 164, 105992. [Google Scholar]
- 33.Primo EN; Kogan MJ; Verdejo HE; Bollo S; Rubianes MD; Rivas GA, Label-Free Graphene Oxide-Based Surface Plasmon Resonance Immunosensor for the Quantification of Galectin-3, a Novel Cardiac Biomarker. ACS Applied Materials & Interfaces 2018, 10 (28), 23501–23508. [DOI] [PubMed] [Google Scholar]
- 34.Mohamed R; Campbell JL; Cooper-White J; Dimeski G; Punyadeera C, The impact of saliva collection and processing methods on CRP, IgE, and Myoglobin immunoassays. Clin Transl Med 2012, 1 (1), 19. [DOI] [PMC free article] [PubMed] [Google Scholar]
- 35.Zussman E; Yarin A; Nagler R, Age-and flow-dependency of salivary viscoelasticity. Journal of Dental Research 2007, 86 (3), 281–285. [DOI] [PubMed] [Google Scholar]
- 36.Zhou J; Papautsky I, Viscoelastic microfluidics: Progress and challenges. Microsystems & Nanoengineering 2020, 6 (1), 113. [DOI] [PMC free article] [PubMed] [Google Scholar]
- 37.Landry ML; Criscuolo J; Peaper DR, Challenges in use of saliva for detection of SARS CoV-2 RNA in symptomatic outpatients. Journal of Clinical Virology 2020, 130, 104567. [DOI] [PMC free article] [PubMed] [Google Scholar]
- 38.Noiphung J; Nguyen MP; Punyadeera C; Wan Y; Laiwattanapaisal W; Henry CS, Development of Paper-Based Analytical Devices for Minimizing the Viscosity Effect in Human Saliva. Theranostics 2018, 8 (14), 3797–3807. [DOI] [PMC free article] [PubMed] [Google Scholar]
- 39.Wilson CJ; Clegg RE; Leavesley DI; Pearcy MJ, Mediation of biomaterial–cell interactions by adsorbed proteins: a review. Tissue engineering 2005, 11 (1-2), 1–18. [DOI] [PubMed] [Google Scholar]
- 40.Sharafeldin M; McCaffrey K; Rusling JF, Influence of antibody immobilization strategy on carbon electrode immunoarrays. Analyst 2019, 144 (17), 5108–5116. [DOI] [PMC free article] [PubMed] [Google Scholar]
- 41.Jeyachandran YL; Mielczarski E; Rai B; Mielczarski JA, Quantitative and Qualitative Evaluation of Adsorption/Desorption of Bovine Serum Albumin on Hydrophilic and Hydrophobic Surfaces. Langmuir 2009, 25 (19), 11614–11620. [DOI] [PubMed] [Google Scholar]
- 42.Patriquin G; Davidson RJ; Hatchette TF; Head BM; Mejia E; Becker MG; Meyers A; Sandstrom P; Hatchette J; Block A; Smith N; Ross J; Leblanc JJ, Generation of false positive SARS-CoV-2 antigen results with testing conditions outside manufacturer recommendations: A scientific approach to pandemic misinformation. Cold Spring Harbor Laboratory: 2021. [DOI] [PMC free article] [PubMed] [Google Scholar]
- 43.Kaduskar O; Bhatt V; Prosperi C; Hayford K; Hasan AZ; Deshpande GR; Tilekar B; Vivian Thangaraj JW; Kumar MS; Gupta N; Murhekar MV; Moss WJ; Mehendale SM; Sangal L; Sapkal G, Optimization and Stability Testing of Four Commercially Available Dried Blood Spot Devices for Estimating Measles and Rubella IgG Antibodies. mSphere 2021, 6 (4), e0049021–e0049021. [DOI] [PMC free article] [PubMed] [Google Scholar]
- 44.Flounders AW; Brandon DL; Bates AH, Patterning of immobilized antibody layers via photolithography and oxygen plasma exposure. Biosens. Bioelectron 1997, 12 (6), 447–456. [DOI] [PubMed] [Google Scholar]
- 45.Li X; Liu X, A Microfluidic Paper-Based Origami Nanobiosensor for Label-Free, Ultrasensitive Immunoassays. Adv. Healthc. Mater 2016, 5 (11), 1326–1335. [DOI] [PubMed] [Google Scholar]
- 46.Yola ML; Atar N, Amperometric galectin-3 immunosensor-based gold nanoparticle-functionalized graphitic carbon nitride nanosheets and core–shell Ti-MOF@COFs composites. Nanoscale 2020, 12 (38), 19824–19832. [DOI] [PubMed] [Google Scholar]
- 47.Beck JJ; Alenicheva V; Rahn KL; Russo MJ; Baldo TA; Henry CS, Evaluating the performance of an inexpensive, commercially available, NFC-powered and smartphone controlled potentiostat for electrochemical sensing. Electroanalysis 2023. [Google Scholar]
Associated Data
This section collects any data citations, data availability statements, or supplementary materials included in this article.