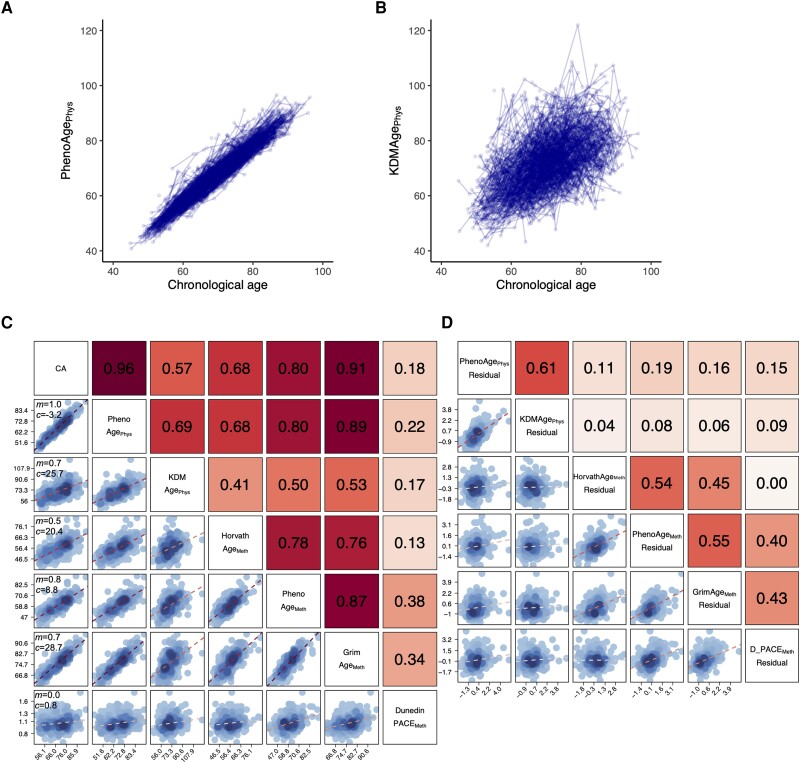
Figure 2.
Visualization of the different biological age measures amongst SATSA participants. PhenoAgePhys (A) and KDMAgePhys (B) are shown for all assessments of all participants plotted against chronological age (CA). Each point represents an individual assessment, with longitudinal assessments from the same individual joined by a line. Correlation matrices for baseline assessments of the six biological age measures and chronological age (C) and the six biological age measure residuals (D) are shown, with scatter plots in the bottom left and Pearson correlation coefficients (r) in the top right. In C, in the left-hand column the gradient (m) and intercept (c) are displayed for the linear regression of each biological age measure on chronological age.

