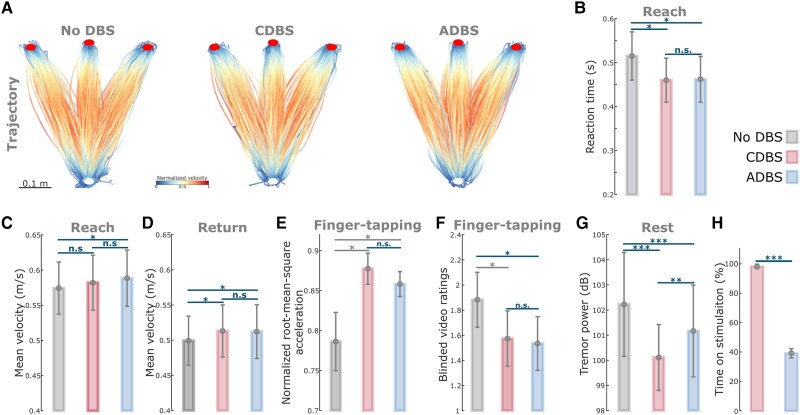
Figure 4.
ADBS and CDBS equally improved motor performance compared with no DBS, but resting tremor was better suppressed during CDBS. (A) Movement trajectories are colour-coded by the normalized instantaneous velocities of the reaching movements with no DBS (left), CDBS (middle) and ADBS (right). White and red filled circles at the bottom and top indicate the start and target buttons, respectively. (B) Reaction time during the reaching movement under different stimulation conditions. (C and D) Mean velocities during the reaching movement under different stimulation conditions, while C and D represent the reach and return periods, respectively. (E and F) Normalized root-mean-square acceleration (E) and blinded video ratings (F) during finger-tapping movement in different stimulation conditions. (G) Average power in tremor frequency band during rest in different stimulation conditions. (H) Time on stimulation in CDBS and ADBS conditions. The error bar plots show the mean and SEM across all tested hemispheres; *P < 0.05, **P < 0.01; ***P < 0.001. P-values were quantified using generalized linear mixed effect modelling on an individual trial (B–D, and G) or block (E and F) basis or using paired t-test on an individual hemisphere basis (H) and corrected for multiple comparisons using Bonferroni correction. Grey asterisk indicates nominally/marginally significant, which did not survive Bonferroni correction. ADBS = adaptive deep brain stimulation; CDBS = continuous deep brain stimulation; DBS = deep brain stimulation; n.s. = not significant.

