Abstract
Human leukocyte antigen (HLA)-E binds epitopes derived from HLA-A, HLA-B, HLA-C and HLA-G signal peptides (SPs) and serves as a ligand for CD94/NKG2A and CD94/NKG2C receptors expressed on natural killer and T cell subsets. We show that among 16 common classical HLA class I SP variants, only 6 can be efficiently processed to generate epitopes that enable CD94/NKG2 engagement, which we term ‘functional SPs’. The single functional HLA-B SP, known as HLA-B/−21M, induced high HLA-E expression, but conferred the lowest receptor recognition. Consequently, HLA-B/−21M SP competes with other SPs for providing epitope to HLA-E and reduces overall recognition of target cells by CD94/NKG2A, calling for reassessment of previous disease models involving HLA-B/−21M. Genetic population data indicate a positive correlation between frequencies of functional SPs in humans and corresponding cytomegalovirus mimics, suggesting a means for viral escape from host responses. The systematic, quantitative approach described herein will facilitate development of prediction algorithms for accurately measuring the impact of CD94/NKG2–HLA-E interactions in disease resistance/susceptibility.
Regulation of effector cells, including natural killer (NK) and T cells, occurs through signaling of various inhibitory and activating receptors that distinguish healthy cells from abnormal targets1,2. Among these are the inhibitory heterodimeric receptor CD94/NKG2A and its activating counterpart CD94/NKG2C, which bind the nonclassical HLA class I molecule HLA-E. HLA-E is expressed by most cells in humans at low levels and is primarily loaded with nonamer peptides bearing valine at position 1 and leucine at position 9 (VL9) that are derived from SPs of classical HLA class I allotypes3–5. CD94/NKG2A is expressed on approximately 50% of NK cells and 5% of CD8+ T cells in human peripheral blood at steady state6. CD94/NKG2C is generally present less frequently on these cell types and has lower affinity for HLA-E than does CD94/NKG2A7. Human cytomegalovirus (HCMV) produces a VL9 mimic that can be loaded onto HLA-E, allowing the infected cells to escape from NK cell lysis through CD94/NKG2A–HLA-E-mediated inhibition8. Along with inhibitory killer cell immunoglobulin-like receptors, CD94/NKG2A has a role in NK cell ‘education’, a process in which functional competence of NK cells is conferred through the interaction of their inhibitory receptors with self-HLA class I9.
HLA-E has two common allotypes, E*01:01 and E*01:03, the latter of which is expressed at higher levels on the cell surface10. Expression of HLA-E is also influenced by HLA class I SP polymorphism because only some HLA allotypes can generate peptides suitable for HLA-E loading. For example, VL9 peptides derived from HLA-B allotypes with threonine at position −21 (−21T) bind poorly to HLA-E, in contrast to those derived from allotypes with methionine at this position (−21M)4,11. Furthermore, SPs from HLA-A allotypes with leucine at position −11 cannot be trimmed to generate an epitope for HLA-E loading12. Besides impacting HLA-E expression, SP polymorphism within VL9 can also influence interactions between HLA-E and CD94/NKG2 (refs. 7,13–17). However, studies on HLA SP polymorphism so far have focused on only a limited number of VL9 variants, and have primarily used exogenously loaded peptides onto HLA-E, which ignores effects of natural intracellular processing. Here, we comprehensively evaluated the influence of SP polymorphism on HLA-E peptide loading and subsequent recognition of HLA-E–VL9 complexes by CD94/NKG2. Our data indicate competition in binding of distinct VL9 peptides to HLA-E, resulting in nonadditive levels of HLA-E–VL9 recognition by CD94/NKG2A. Interindividual diversity of HLA-E-mediated NK/T cell regulation as a function of HLA class I polymorphism as defined herein is likely to impact human health and disease.
Results
Diversity of HLA signal peptide polymorphism in human populations
A total of 16 distinct SP variants were detected among HLA class I allotypes present in the US National Marrow Donor Program (NMDP) African, European, Chinese or southeast Asian populations at frequencies ≥ 0.6 % (Table 1). Each SP variant was labeled with a number and a letter corresponding to the HLA locus. Frequency patterns of the common SPs among HLA-A and HLA-C allotypes were consistent across populations: SP-2A>1A>3A and SP-1C>3C>2C (Extended Data Fig. 1). The HLA-B SPs showed a more diverse distribution with the most common variants being SP-5B among African and southeast Asian populations, SP-6B among European populations, and SP-2B among Chinese populations. The HLA-B SP containing −21M was primarily represented by SP-6B.
Table 1 |.
HLA class I signal peptide polymorphism
| SP | Sequencea | HLA allelesb |
|---|---|---|
| SP-1A | MAVMAPRTLLLLLSGALALTQTWA | A*01:01, A*03:01, A*03:02, A*11:01, A*30:01, A*30:02, A*36:01 |
| SP-2A | ---------V-------------- | A*02:01, A*02:02, A*02:03, A*02:05, A*02:06, A*02:11, A*23:01, A*24:02, A*24:07, A*25:01, A*26:01, A*34:02, A*66:01, A*68:01, A*68:02 |
| SP-3A | -------------L---------- | A*29:01, A*29:02, A*31:01, A*32:01, A*33:01, A*33:03 |
| SP-4A | -------------L--------R- | A*74:01 |
| SP-5A | ----P------------------- | A*80:01 |
| SP-1B | -R-T---------W--V---E--- | B*13:01, B*13:02, B*18:01, B*27:04, B*27:05, B*37:01, B*40:02, B*40:06, B*44:02, B*44:03 |
| SP-2B | -R-T----V-----------E--- | B*15:01, B*15:02, B*15:03, B*15:10, B*15:11, B*15:16, B*15:17, B*15:18, B*15:25, B*46:01 |
| SP-3B | -R-T----V-----A-----E--- | B*40:01, B*41:01, B*45:01, B*49:01, B*50:01 |
| SP-4B | -R-T---------W------E--- | B*55:01, B*55:02 |
| SP-5B | -R-T----V----W--V---E--- | B*35:01, B*35:02, B*35:03, B*51:01, B*51:02, B*52:01, B*53:01, B*57:01, B*57:03, B*58:01, B*58:02, B*78:01 |
| SP-6B | -L------V-----A-----E--- | B*07:02, B*07:05, B*08:01, B*14:01, B*14:02, B*38:01, B*38:02, B*39:01, B*39:10, B*42:01, B*42:02, B*48:01 |
| SP-7B | -L------V----W--V---E--- | B*81:01 |
| SP-1C | -R-------I----------E--- | C*01:02, C*03:02, C*03:03, C*03:04, C*04:01, C*04:03, C*05:01, C*06:02, C*08:01, C*08:02, C*12:02, C*12:03, C*14:02, C*16:01, C*16:02 |
| SP-2C | -R------------------E--- | C*02:02, C*15:02, C*15:05 |
| SP-3C | -R-----A-------G----E--- | C*07:01, C*07:02, C*07:04, C*18:01 |
| SP-4C | -R----QA-----------IE--- | C*17:01 |
| SP-E | -*-**DG-------E--------- | E*01:01, E*01:03 |
| SP-F | --***--S------------D--- | F*01:01 |
| SP-G | -V-------F-------T--E--- | G*01:01 |
Dashes indicate identity with the top sequence. VL9 sequence is shown in underlining.
HLA class I alleles present at frequencies ≥ 0.6% in one or more of the US NMDP populations including African, European, Chinese and southeast Asian populations.
HLA signal peptide polymorphism influences surface HLA-E expression
To assess the differential binding affinity of VL9s to HLA-E, we estimated the ability of ten VL9 variants, representing common HLA-A, HLA-B and HLA-C allotypes and HLA-G (Table 1), to stabilize HLA-E on the human B cell line 721.221 (.221). The .221 cell line carries endogenous HLA-E*01:01 that is normally undetectable on the cell, but it can be detected upon incubation at 26 °C and peptide pulsing by flow cytometry using the HLA-E-specific antibody 3D12 (ref. 13). Pulsing the panel of VL9s onto .221 cells demonstrated a consistent pattern of HLA-E stabilization across different peptide concentrations for HLA-A-, HLA-B- and HLA-C-derived peptides, with VMAPRTVLL (VL9 derived from SP-6B or SP-7B: VL96B/7B) showing the highest level of HLA-E stabilization overall (Fig. 1a and Extended Data Fig. 2a). Binding of VL9 variants to HLA-E was also assessed using ELISA-based peptide binding18,19 and thermal stability19 assays (Extended Data Fig. 2b). Both methods showed somewhat similar patterns to the peptide-pulsing experiments but were less sensitive in detecting differences in binding affinity across VL9 peptides.
Fig. 1 |. HLA class I signal peptide polymorphism influences HLA-E expression.
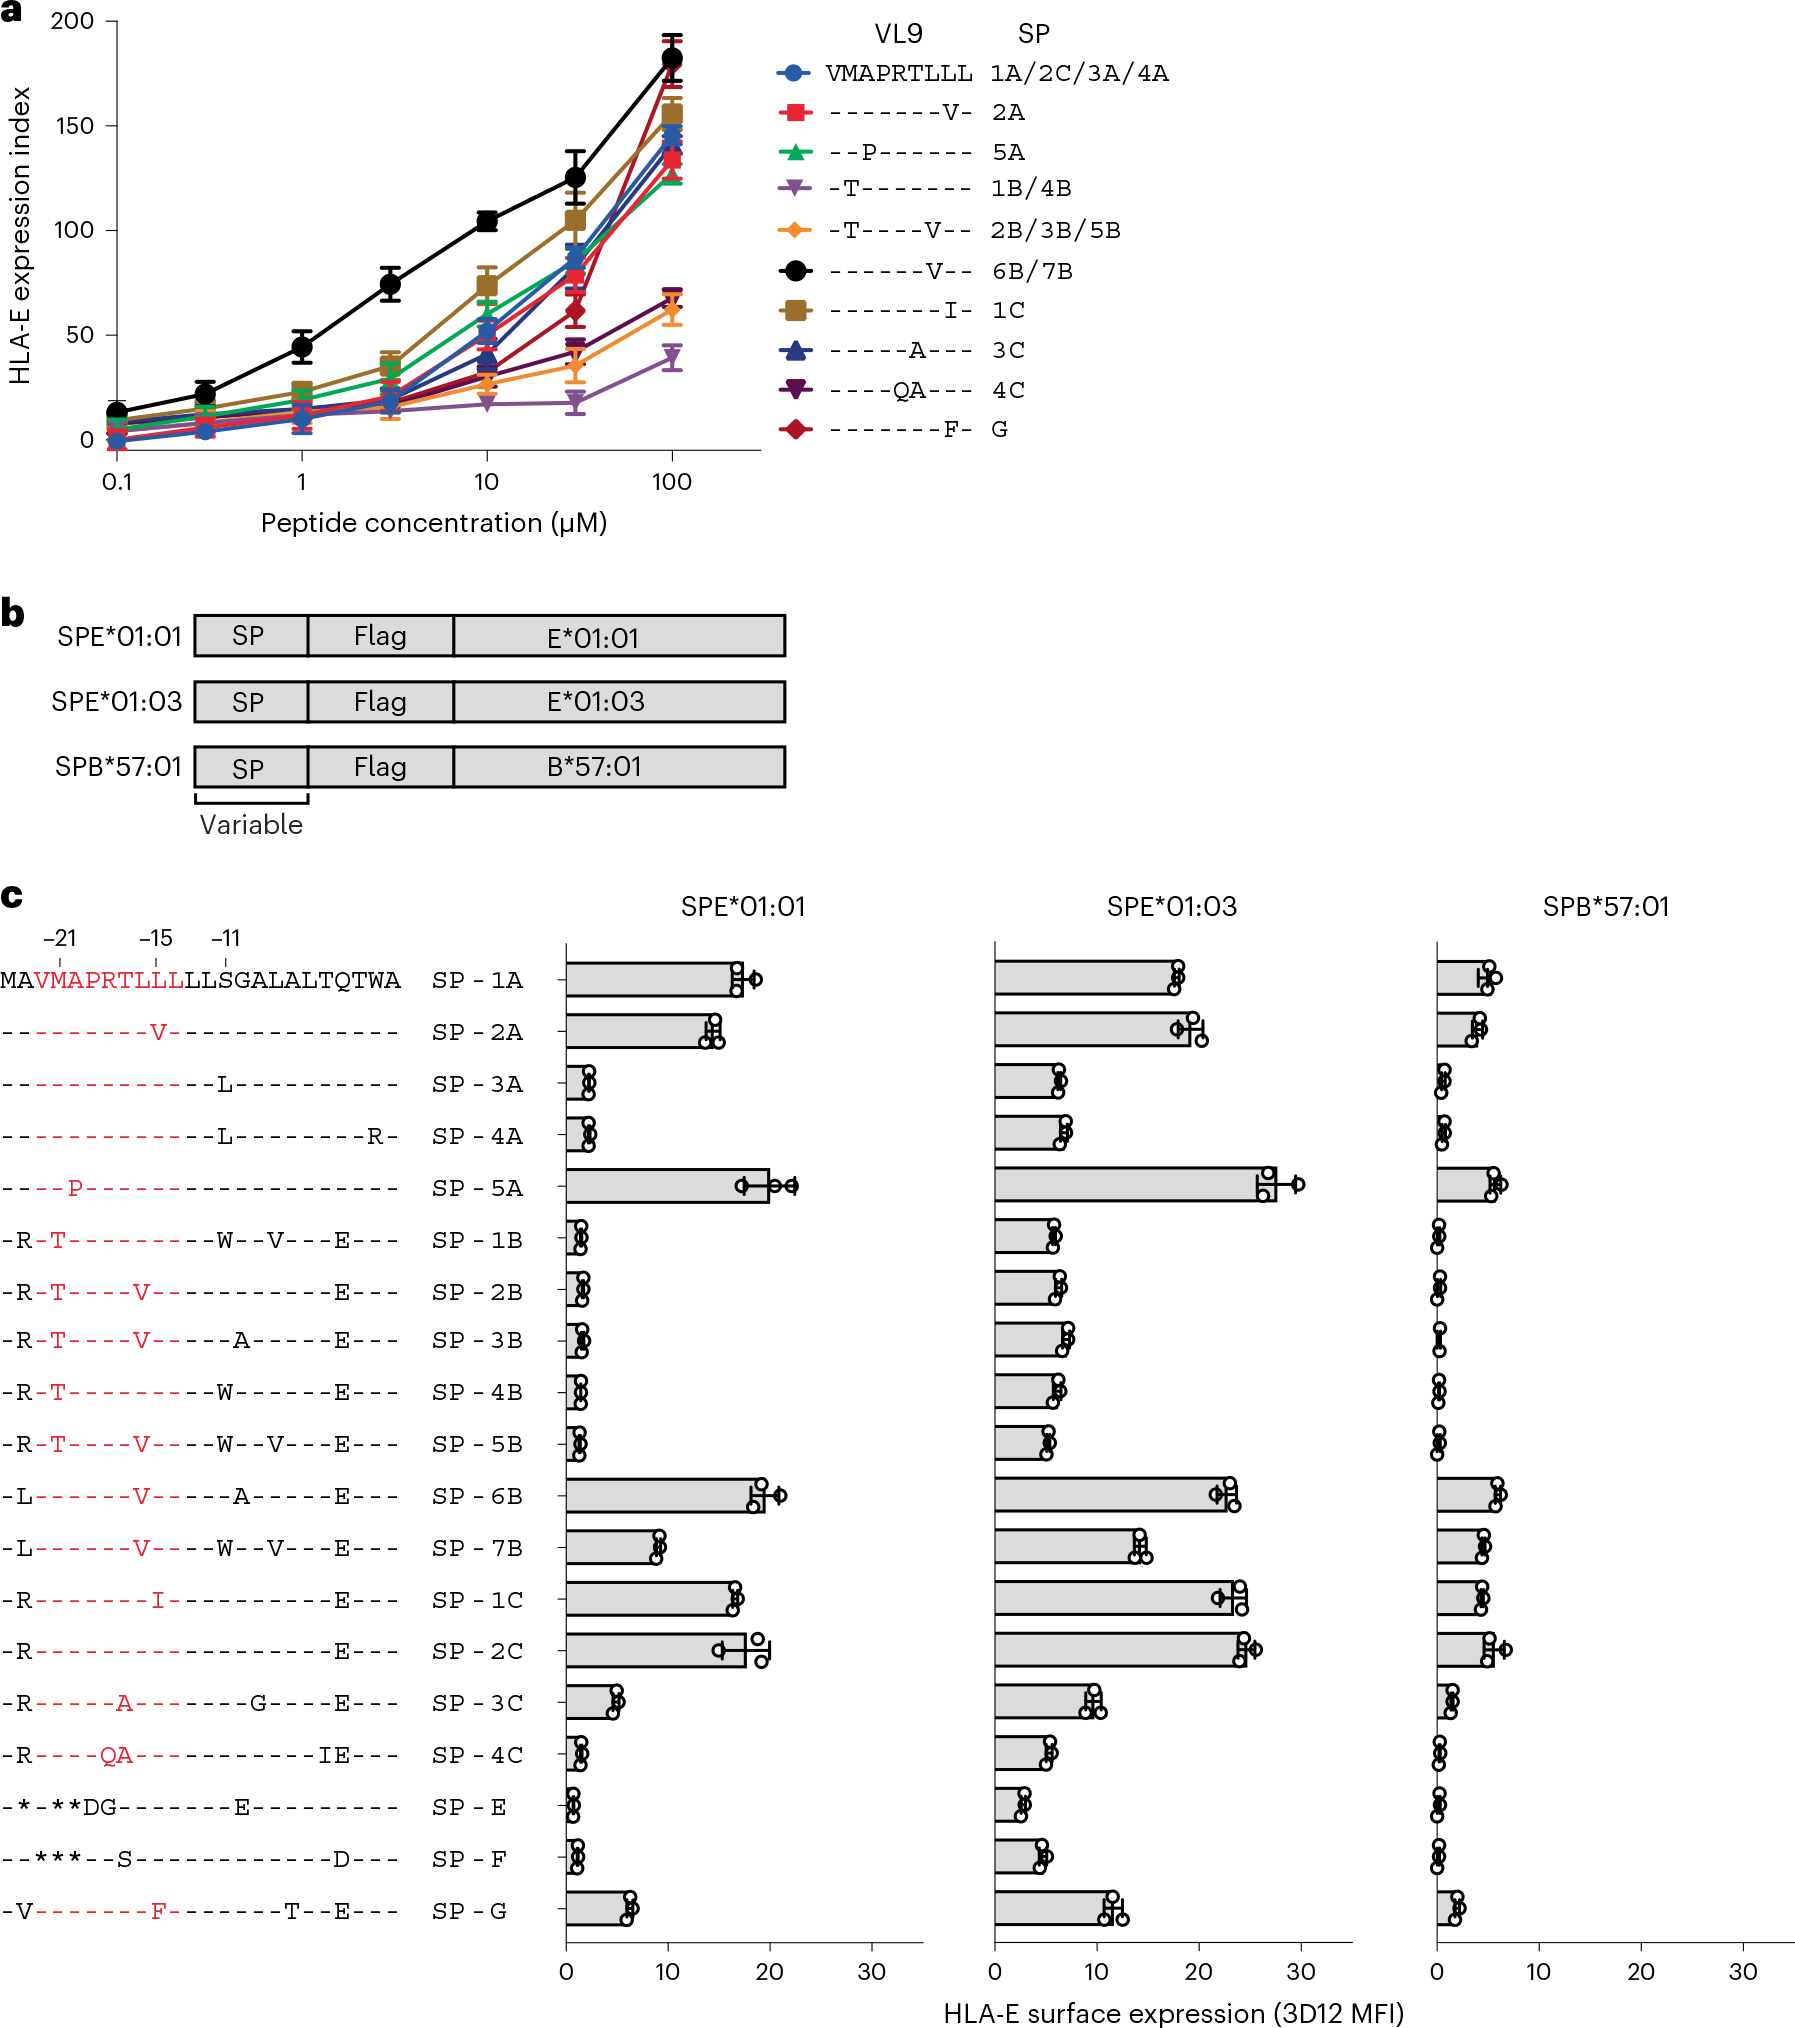
a, HLA-E surface expression levels on .221 cells pulsed with synthetic peptides at different concentrations measured by flow cytometry using the HLA-E-specific 3D12 antibody. VL9 peptide sequence alignment and corresponding SP variants are shown on the right. The expression index was calculated using 3D12 median fluorescence intensities (MFIs) as follows: ((sample − neg_ctrl)/(pos_ctrl − neg_ctrl)) × 100, where neg_ctrl represents unpulsed .221 cells mixed with dimethylsulfoxide (DMSO) and pos_ctrl represents unpulsed .221 cells incubated constantly at 26 °C. Data represent triplicate experiments and reflect endogenous HLA-E*01:01 expression. b, Schematic representation of fragments encoding SP/HLA hybrids cloned in a lentiviral expression vector. c, HLA-E surface expression on .221 cells transduced with SPE*01:01, SPE*01:03 and SPB*57:01 measured by flow cytometry using the 3D12 antibody on different days (n = 3). Amino acid sequence alignments of SP variants are shown on the left. VL9 epitope sequences are shown in red. Data in a and c are mean ± s.d.
In addition to VL9 affinity for HLA-E, intracellular peptide processing can affect HLA-E expression levels by impacting the availability of VL9 in the endoplasmic reticulum (ER). To take both of these variables into account, we generated lentiviral constructs encoding hybrid SP/HLA molecules containing each SP variant (Table 1) conjugated to Flag-tagged HLA-E (SPE*01:01 and SPE*01:03) or HLA-B (SPB*57:01) mature proteins (Fig. 1b). The constructs were transduced into .221 cells, which led to variable levels of HLA-E on the cell surface as measured using the 3D12 antibody on SPE*01:01 or SPE*01:03-transduced (SPE), and SPB*57:01-transduced (SPB) .221 cells (.221-SPE and .221-SPB, respectively; Fig. 1c). Anti-Flag antibody was also used to measure transgenic HLA-E expression levels on .221-SPE cells (Extended Data Fig. 3a). HLA-E expression patterns detected by staining with the two antibodies were consistent with one another (Extended Data Fig. 3b), as were the HLA-E staining patterns between .221-SPE*01:01 and .221-SPE*01:03 cells, although .221-SPE*01:01 cells had overall lower HLA-E expression levels than .221-SPE*01:03 cells as expected (Fig. 1c and Extended Data Fig. 3a,c). Importantly, HLA-E expression patterns also strongly correlated between .221-SPE cells (which represent both transgenic and endogenous HLA-E) and .221-SPB cells (which represent only endogenous HLA-E; Extended Data Fig. 3d), indicating that the SPE transductants are a valid model for predicting endogenous HLA-E expression levels as a function of SP variation.
Amino acid substitutions at two positions, −11 (Ser to Leu) and −21 (Met to Thr) of the SP, consistently lowered HLA-E expression levels across experiments (Fig. 1c). The effect of the S−11L change concurs with previous work suggesting that −11L disrupts SP trimming by the proteasome12. The effect of M−21T is also consistent with previous findings4,11 and our own observations (Extended Data Fig. 2). Interestingly, SP-6B and SP-7B, the two −21M HLA-B variants, have identical VL9 sequences, but SP-7B was less efficient at inducing HLA-E expression, which is necessarily due to differences in the C-terminal flanking region. These data emphasize the importance of SP sequence variation both within and flanking VL9 in determining binding of the peptide to HLA-E.
To compare HLA-E expression levels on .221-SPE cells to those on other cell types, we stained .221-SPE*01:03 cells, VL9-pulsed .221 cells, peripheral blood cells and Epstein–Barr virus-transformed B-lymphoblastoid cell lines (BLCLs) with 3D12. The .221-SPE*01:03 cells expressed HLA-E at lower levels than VL9-pulsed .221 cells, at higher levels than peripheral blood cells, and at similar levels as BLCLs (Extended Data Fig. 4a). Peripheral blood cells showed an increase in HLA-E surface expression after treatment with interferon-γ (IFNγ) (Extended Data Fig. 4b), in agreement with previous observations20. Thus, our .221-SPE cellular model may reflect HLA-E expression levels under inflammatory conditions.
HLA signal peptide polymorphism influences CD94/NKG2–HLA-E engagement
To estimate the effect of SP polymorphism on CD94/NKG2 binding, we developed a reporter cell system by transducing Jurkat-β2m-knockout cells21 with constructs encoding CD94, DAP12 and chimeric activating receptors NKG2A or NKG2C (JurkatNKG2A or JurkatNKG2C reporter cells, respectively; Fig. 2a). CD94/NKG2 receptor engagement on these cells results in upregulation of the activation marker CD69, which can be detected by flow cytometry. Incubation of the reporter cells with .221 cells pulsed with VL9 variants resulted in differential CD69 surface levels, which were consistent between the JurkatNKG2A and JurkatNKG2C cells, and, as anticipated, were lower for JurkatNKG2C cells (Fig. 2b and Extended Data Fig. 5a). The differential activation pattern of JurkatNKG2 cells in response to .221 target cells pulsed with VL9 variants did not correlate with HLA-E expression levels on the .221 targets, pointing to variable affinities of HLA-E–VL9 complexes to CD94/NKG2 (Extended Data Fig. 5b). Indeed, surface plasmon resonance (SPR) data demonstrated variable dissociation constant (Kd) values for HLA-E–VL9 binding to CD94/NKG2 as a function of the VL9 involved (Supplementary Table 1), and these Kd values strongly correlated with both JurkatNKG2A and JurkatNKG2C reporter activities in response to target cells expressing the corresponding HLA-E–VL9 complexes (Extended Data Fig. 5c). Activity of JurkatNKG2A cells was also tested against monocyte-derived macrophages that were stimulated with IFNγ and/or pulsed with SP-G-derived VL9 (VL9G) (Extended Data Fig. 6). As expected, IFNγ treatment enhanced HLA-E expression and increased reporter cell activity for both unpulsed and VL9G-pulsed target cells.
Fig. 2 |. JurkatNKG2 reporter cells respond differentially to VL9-pulsed .221 and .221-SPE cells.
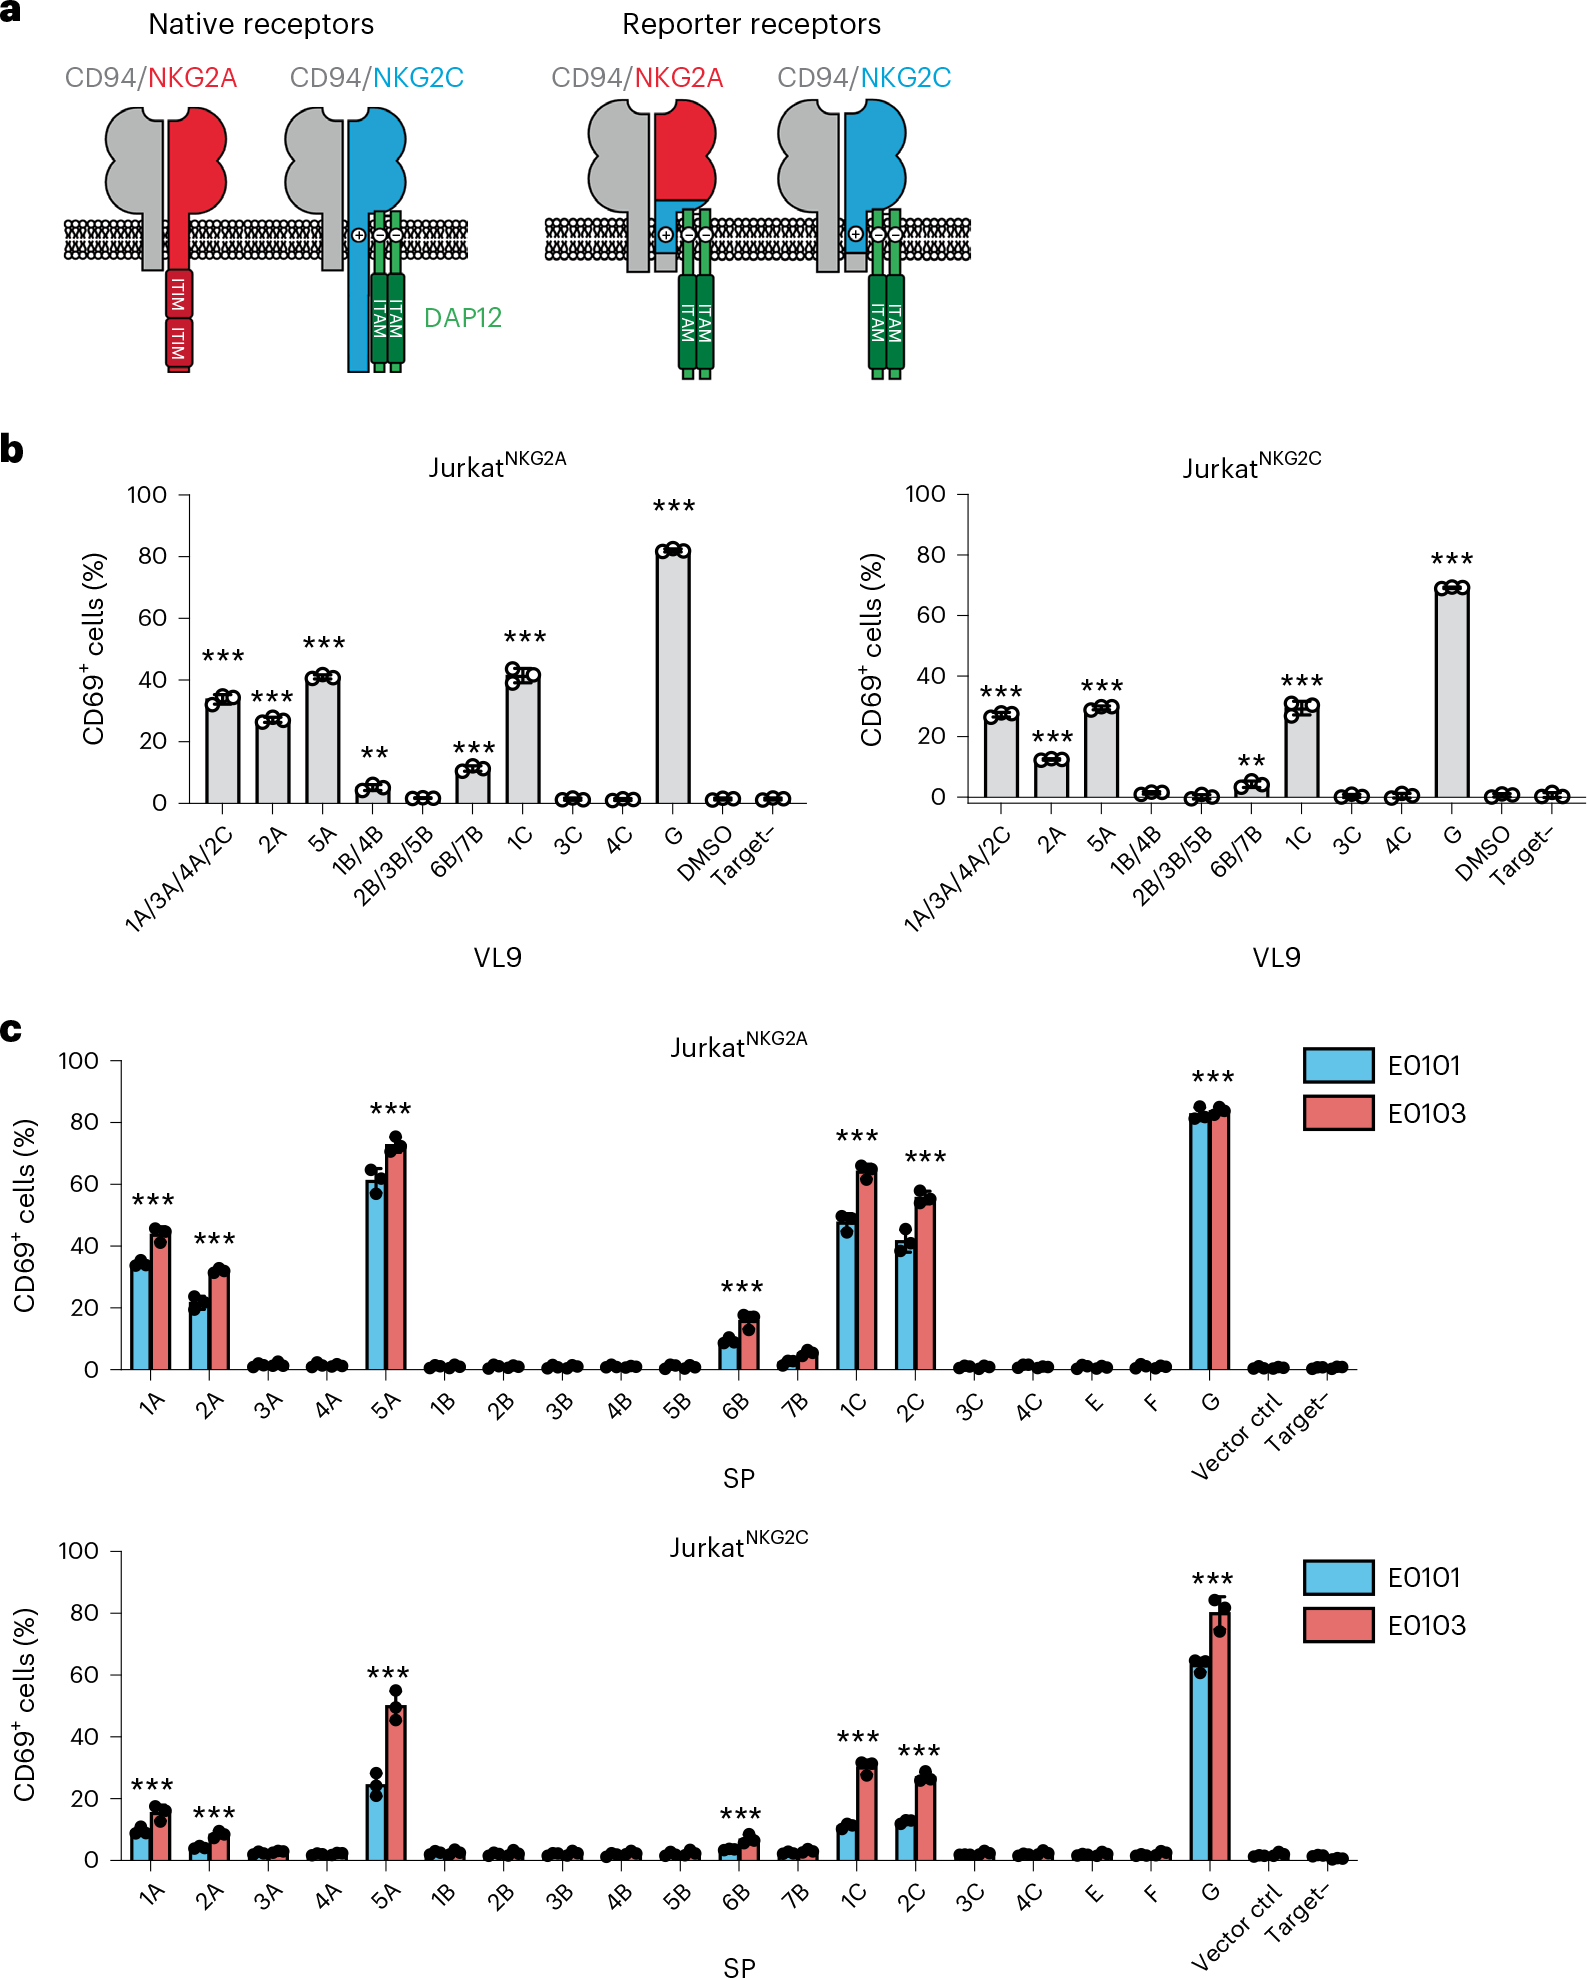
a, Schematic of the chimeric receptor design for expression in Jurkat reporter cells. Native receptors are shown on the left and chimeric reporter receptors are shown on the right. b, Reporter activity (percentage of CD69+ cells) of JurkatNKG2A and JurkatNKG2C cells after incubation with VL9-pulsed (100 μM peptide) or unpulsed (DMSO) .221 cells expressing endogenous E*01:01. c, Reporter activity of JurkatNKG2A and JurkatNKG2C cells after incubation with .221 target cells transduced with SPE*01:01, SPE*01:03 or vector control (vector ctrl). b,c, Data represent triplicate experiments. Data are mean ± s.d. ‘Target–’ designates reporter cell activity in the absence of target cells. P values were determined in comparison with DMSO (b) or vector control (c) using two-sided unpaired t-tests and labeled with asterisks if reporter activity showed a significant difference (P < 0.05) for VL9-pulsed (b) or both SPE*01:01- and SPE*01:03-transduced target cells (c). **P < 0.01, ***P < 0.001.
To determine the influence of SP polymorphism on CD94/NKG2–HLA-E binding under conditions in which natural intracellular SP processing occurs, .221-SPE cells were used as targets in the reporter cell assay (Fig. 2c). Of the 19 SPs tested, only 7 showed significantly higher than background activation across all 4 experiments in the following order: SP-G > SP-5A > SP-1C > SP-2C > SP-1A > SP-2A > SP-6B (Fig. 2c). These data indicate that only a subset of common classical HLA class I SP variants can be efficiently processed into a VL9 epitope that facilitates CD94/NKG2–HLA-E engagement and signaling (that is, SP-1A, SP-2A, SP-5A, SP-6B, SP-1C and SP-2C), and we refer to these, along with SP-G, as ‘functional SPs’ henceforth. As observed in assays using peptide-pulsed target cells (Fig. 2b), JurkatNKG2A reporter cells responded more strongly to targets than did JurkatNKG2C reporter cells, and response to .221-SPE*01:03 targets was greater than that to .221-SPE*01:01 targets, in keeping with higher expression levels of E*01:03 (Fig. 2c).
The low reporter activity toward cells expressing SP-6B was in line with the SPR data showing relatively high Kd values for receptor–ligand interactions in the presence of VL96B (Supplementary Table 1). SP-6B induced HLA-E expression at similar levels as SP-1A (Fig. 1c) but demonstrated substantially lower receptor recognition (Fig. 2c). These two SPs differ at four amino acid positions, of which only one is located within VL9 at P7. Constructs encoding swap mutations between SP-1A and SP-6B were generated and showed that P7-valine is responsible for the decreased reporter cell recognition (Extended Data Fig. 7a). The structure of the CD94/NKG2A–HLA-E complex with VL9G implicated P5, P6 and P8, but not P7 of VL9G in direct interactions with the CD94/NKG2A receptor22. Thus, the impact of P7 observed in our experiments indicates that this position may affect receptor recognition indirectly. Indeed, molecular dynamics simulation analysis of the CD94/NKG2A–HLA-E complex suggested that the complex displays greater motion and receptor distortion in the presence of VL96B as compared to VL91A (Extended Data Fig. 7b), indicating decreased stability of the receptor–ligand complex in the presence of VL96B. During the simulations, P5-arginine in VL91A formed hydrogen bonds with the receptor for a longer time compared to P5-arginine in VL96B, supporting an influence of P7 on the interaction between other residues of the VL9 and the CD94/NKG2A receptor.
Differential recognition of HLA-E–VL9 complexes by NK cells expressing native CD94/NKG2 receptors was next tested by measuring responses of primary peripheral blood NK cells from healthy donors to a subset of .221-SPE*01:03 cells expressing the seven functional and two nonfunctional SPs. All donors were seropositive for HCMV and displayed a relatively large NKG2C+ NK cell population (10–40% of total NK cells), likely representing adaptive NK cells that develop in response to HCMV infection23. NK cell responses were quantified by measuring levels of the CD107a degranulation marker using flow cytometry. Degranulation by primary NKG2A+NKG2C− NK cells in response to .221-SPE*01:03 cells varied as a function of SP sequence (Fig. 3a), reflecting differential inhibition by CD94/NKGA–HLA-E engagement that strongly correlated with the level of JurkatNKG2A reporter cell activation in response to the same targets (Fig. 3b). Likewise, primary NKG2A−NKG2C+ NK cells responded differentially to the set of .221-SPE*01:03 cells (Fig. 3c), closely reflecting the response observed with JurkatNKG2C reporter cells (Fig. 3d). Finally, the NKL cell line13,24, which expresses substantially higher levels of NKG2A than peripheral blood NK cells and JurkatNKG2A reporter cells (Extended Data Fig. 8), responded to the same set of .221-SPE*01:03 targets in a manner that also strongly correlated with responses of JurkatNKG2A cells (Fig. 3e,f) and primary NKG2A+NKG2C− cells (Fig. 3g). Thus, SP polymorphism, which may alter both HLA-E expression levels and affinity of the HLA-E–VL9 complex to CD94/NKG2, elicits consistent patterns of responses across various effector cell types.
Fig. 3 |. 221-SPE*01:03 cells differentially stimulate primary NK and NKL cells.
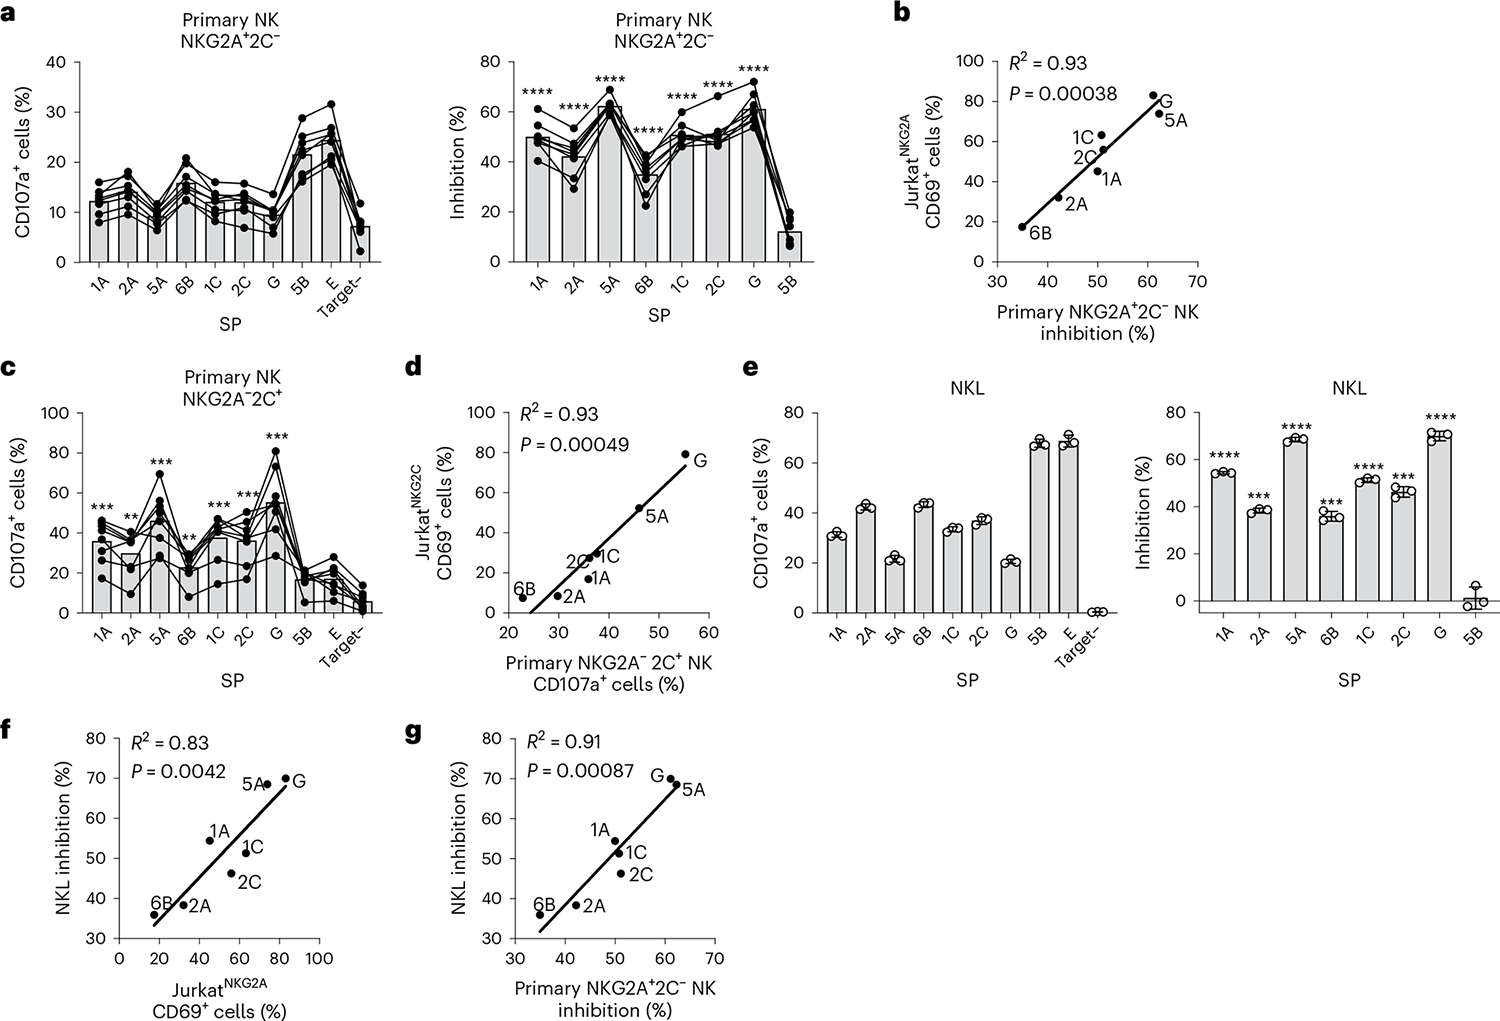
a, Degranulation (percentage of CD107a+ cells) of primary NKG2A+NKG2C− NK cells (denoted as NKG2A+C−) after incubation with .221-SPE*01:03 target cells measured for healthy blood donors (n = 8) and the corresponding inhibition of degranulation. Inhibition of degranulation was calculated using the percentage of CD107a+ data as: (1 − (sample − neg_ctrl)/(pos_ctr − neg_ctrl)) × 100, where neg_ctrl represents NK cells incubated without target cells (Target–), and pos_ctrl represents NK cells incubated with .221 cells expressing transgenic HLA-E*01:03 with its own SP. b, Correlation between JurkatNKG2A activity (Fig. 2c) and primary NKG2A+NKG2C− NK cell inhibition (a) after incubation with .221-SPE*01:03 cells. c, Degranulation of primary NKG2A−NKG2C+ NK cells (denoted as NKG2A−C+) after incubation with .221-SPE*01:03 target cells measured for the same donors (n = 8) as in a. d, Correlation between JurkatNKG2C activity (Fig. 2c) and primary NKG2A−NKG2C+ NK cell activity (c) after incubation with .221-SPE*01:03 cells. e, NKL cell degranulation after incubation with .221-SPE*01:03 target cells and the corresponding inhibition of degranulation calculated based on the percentage of CD107a+ cells data. Data are mean ± s.d. from triplicate experiments. f, Correlation between NKL cell inhibition (e) and JurkatNKG2A activity after incubation with .221-SPE*01:03 cells (Fig. 2c). g, Correlation between NKL cell inhibition (e) and primary NKG2A+NKG2C− NK cell inhibition (a). In a, c and e, P values were determined in comparison with target cells expressing SP-5B using a two-sided paired t-test for primary NK cells and an unpaired t-test for NKL cells. **P < 0.01, ***P < 0.001, ****P < 0.0001. In b, d, f and g, R2 was determined by Spearman correlation analysis and is shown with a two-tailed P value.
Functional signal peptides in human populations and HCMV VL9 mimics
Analysis of HLA class I allele frequencies in the NMDP dataset indicated that HLA-A encodes the highest frequencies of functional SPs across populations, closely followed by HLA-C, whereas only a small fraction of HLA-B alleles encodes functional SPs in each population (Fig. 4). The haplotypic distribution of functional SPs based on predicted HLA haplotypes25 showed remarkably consistent patterns across distinct NMDP populations (Fig. 5a and Extended Data Fig. 9).
Fig. 4 |. Frequencies of combined functional signal peptides at each HLA locus across NMDP populations.
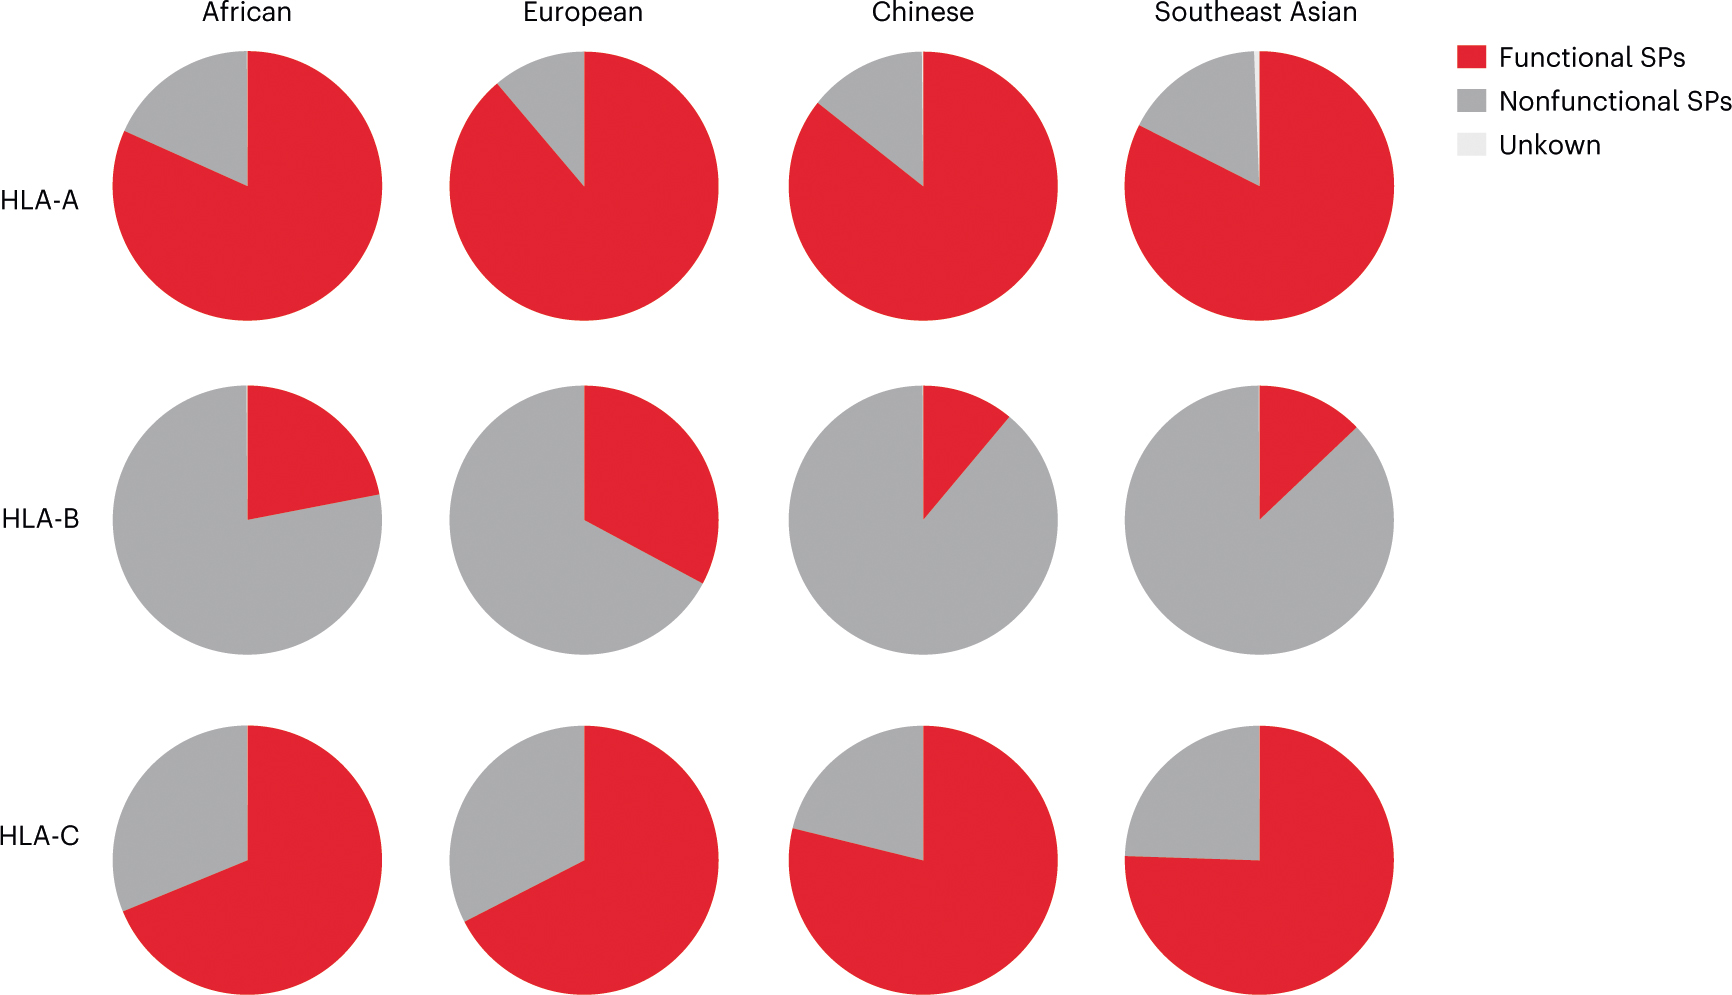
The frequencies of HLA alleles encoding functional SP-A (SP-1A/SP-2A/SP-5A), SP-B (SP-6B) and SP-C (SP-1C/SP-2C) were combined for each HLA class I locus based on data available at http://www.allelefrequencies.net/ for four US NMDP populations (Extended Data Fig. 1).
Fig. 5 |. HLA-A, HLA-B and HLA-C haplotypes and genotypes stratified by the presence of alleles encoding functional signal peptides.
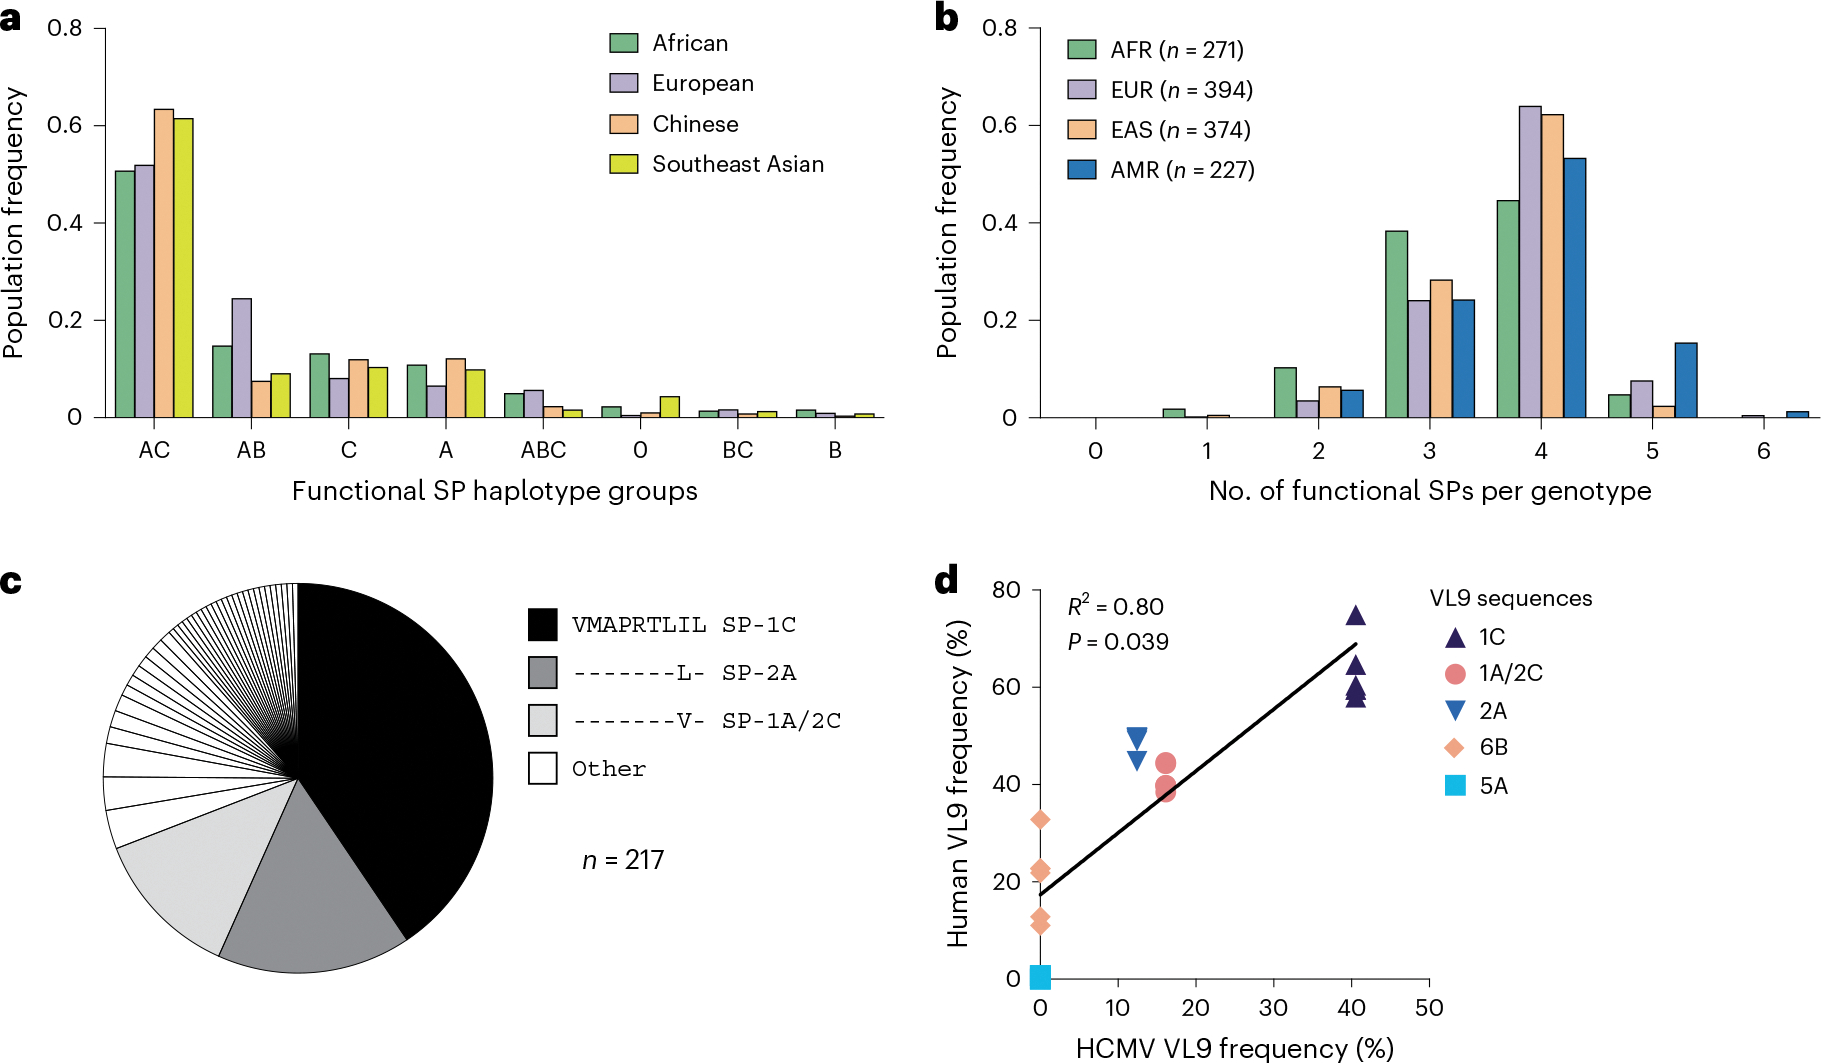
a, Frequencies of HLA class I haplotype groups that encode 0–3 functional SPs in four NMDP populations. Classical HLA class I haplotypes were analyzed for the presence of alleles encoding functional SPs. Labels represent loci providing functional SPs. 0 indicates no functional SPs on the haplotype. b, Distribution of HLA-A, HLA-B and HLA-C genotypes containing different numbers of functional SPs in four populations from the 1000 Genomes Project genotyped for HLA class I. AFR, Africans; AMR, Admixed Americans; EAS, East Asians; EUR, Europeans. c, Distribution of HCMV VL9 mimics in the dataset reported previously17. The legend lists the three major VL9 mimic sequences corresponding to the functional SPs shown. d, Correlation between the frequencies of HCMV VL9 variants (c) and the frequencies of matching functional SPs in the NMDP haplotypes (a). R2 was determined by Spearman correlation analysis based on average frequencies between the populations and is shown with a two-tailed P value.
Functional SP genotypes determined from classical HLA class I data available for 1,274 individuals from the 1000 Genomes Project26 indicated a high frequency of genotypes encoding four functional SPs, followed by those encoding three functional SPs (Fig. 5b). The vast majority of individuals (>98%) had at least two HLA class I alleles that supply epitopes for HLA-E facilitating CD94/NKG2 engagement.
Sequence analysis of the VL9 encoded within the UL40 gene from 217 HCMV clinical isolates found that the most common sequence variants were VMAPRTLIL (41%), VMAPRTLLL (16%) and VMAPRTLVL (12%)17, which are identical to VL9s derived from SP-1C, SP-1A/SP-2C and SP-2A, respectively (Fig. 5c). There were no matching sequences to VL95A or VL96B, and only 1 of the 217 sequences matched VL9G. Comparison of functional SP frequencies in NMDP populations with the frequencies of corresponding HCMV mimics showed a positive correlation (Fig. 5d). This pattern suggests that HCMV has evolved to imitate two aspects of the human SPs: high frequency, explaining why there is not an HCMV mimic for VL95A, and relatively strong recognition by CD94/NKG2A, explaining why there is not an HCMV mimic for VL96B. These two features may allow HCMV to escape from NK cell activation through CD94/NKG2A recognition and from HLA-E restricted CD8+ T cell responses by mimicking self27. As previously proposed17, HCMV may avoid mimicking VL9G, which is associated with the highest level of CD94/NKG2 engagement observed in this study (Figs. 2b,c and 3a,c,e) and previous work7,13–17, due to immunological pressure from adaptive NKG2C+ NK cells.
HLA signal peptide variants compete for HLA-E loading
SP variation differentially affects HLA-E cell surface expression levels by altering the processing/quantity of VL9 and the affinity of VL9 for HLA-E (Fig. 1). These findings raise the possibility that the functional SPs may compete for loading of their VL9s onto HLA-E in a normal cell resulting in a nonadditive effect of SP variants on receptor recognition. To examine this, 360 BLCLs were used as targets for JurkatNKG2A reporter cells. The level of HLA-E expression on BLCLs correlated positively with reporter cell activity against these BLCLs (Fig. 6a). As expected, the presence of the HLA-E*01:03 allele associated with both elevated HLA-E expression and reporter cell activity (Fig. 6b). However, increasing numbers of functional SPs present in the BLCLs associated very weakly with higher HLA-E expression levels and not at all with reporter activity (Fig. 6c). If the HLA-E concentration in the ER is limited, competition between distinct peptides for loading onto HLA-E will ensue, and VL9s with high affinity for HLA-E, such as VL96B, would outcompete those with lower affinity for HLA-E. We tested this model using mass spectrometry analysis of HLA class I-associated peptides in two BLCLs, each carrying three functional SPs (Fig. 6d): BLCL1 (SP-2A, SP-1C and SP-2C) and BLCL2 (SP-2A, SP-1C and SP-6B). As expected, VL92C and VL96B were identified only from cells carrying SP-2C and SP-6B, respectively. Notably, however, the presence of SP-6B (BLCL2) associated with substantially lower amounts of both VL92A and VL91C relative to that observed in the presence of SP-2C (BLCL1), supporting a model in which VL96B can successfully compete against other VL9 variants for binding to HLA-E (Fig. 6d). Together, these data show that SP variants are not simply additive in their contribution to HLA-E expression, but rather affinity of specific VL9s for HLA-E affects cell surface distribution of these complexes.
Fig. 6 |. HLA-E expression levels on BLCLs and recognition of BLCLs by reporter cells suggest competition between SP variants in providing VL9 epitopes to HLA-E.
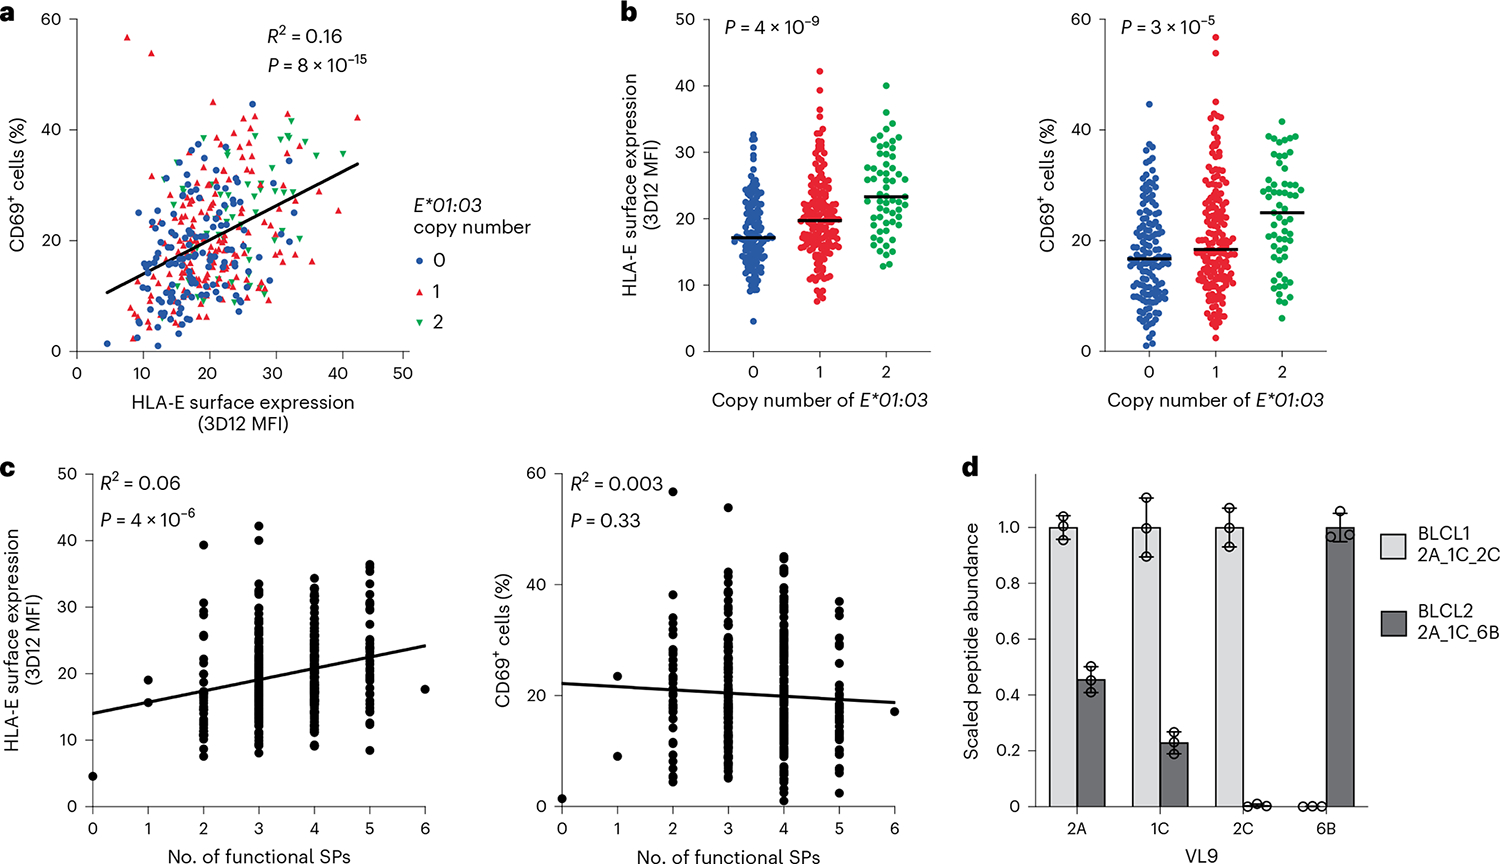
a, Correlation between cell surface HLA-E expression on BLCLs and JurkatNKG2A reporter cell activity after co-incubation with the same BLCLs (n = 360). b, Cell surface HLA-E expression levels on BLCLs and the corresponding JurkatNKG2A reporter cell activity (percentage of CD69+ cells) as stratified by HLA-E*01:03 copy number. Lines in each group represent the median. P values for multigroup comparisons were determined by Kruskal–Wallis tests. c, Cell surface HLA-E expression levels on BLCLs and the corresponding JurkatNKG2A reporter cell activity as stratified by the number of functional SPs encoded by BLCL HLA genotypes. d, Scaled abundance of VL9s eluted from HLA class I expressed on two different BLCLs as determined by mass spectrometry. Peptide abundance values were normalized to the amount of HLA-E observed in the tryptic digests; the highest peptide abundance obtained between the two BLCLs was set to a value of 1. Data are mean ± s.d. from three technical replicates. In a–c, data represent average measurements from four experiments. In a and c, R2 was determined by Spearman correlation analysis and is shown with a two-tailed P value.
High-affinity binding of a given VL9 to HLA-E may result in either strong NK cell inhibition if that HLA-E–VL9 complex is well recognized by CD94/NKG2A, or alternatively, a lower threshold for NK cell activation if the complex is poorly recognized by CD94/NKG2A. We tested this model by determining the distributions of HLA-E expression levels on the cell surface, and JurkatNKG2A reporter cell activity elicited in response to each BLCL, depending on the copy number of HLA alleles encoding individual functional SPs in the respective genomes. Inconsistent patterns of effects on HLA-E expression and reporter cell activity were observed (Fig. 7a,b and Extended Data Fig. 10), but among these, the opposing effects of SP-6B and SP-1C on reporter cell activity were particularly notable (Fig. 7a,b). As expected, increasing SP-1C copy number associated with both increasing HLA-E expression level and increasing reporter cell activity, which concurs with the high-level recognition of HLA-E–VL91C by CD94/NKG2A (Fig. 2b,c). While increasing SP-6B copy number did associate with an increase in HLA-E expression, it also associated with a marked decrease in reporter cell activity (Fig. 7b). These data suggest that the presence of SP-6B diminishes CD94/NKG2A-mediated NK cell inhibition, resulting in a lower threshold of NK cell activation.
Fig. 7 |. Increasing copy number of alleles encoding SP-1C versus SP-6B associate with opposing effects on JurkatNKG2A reporter cell activity.
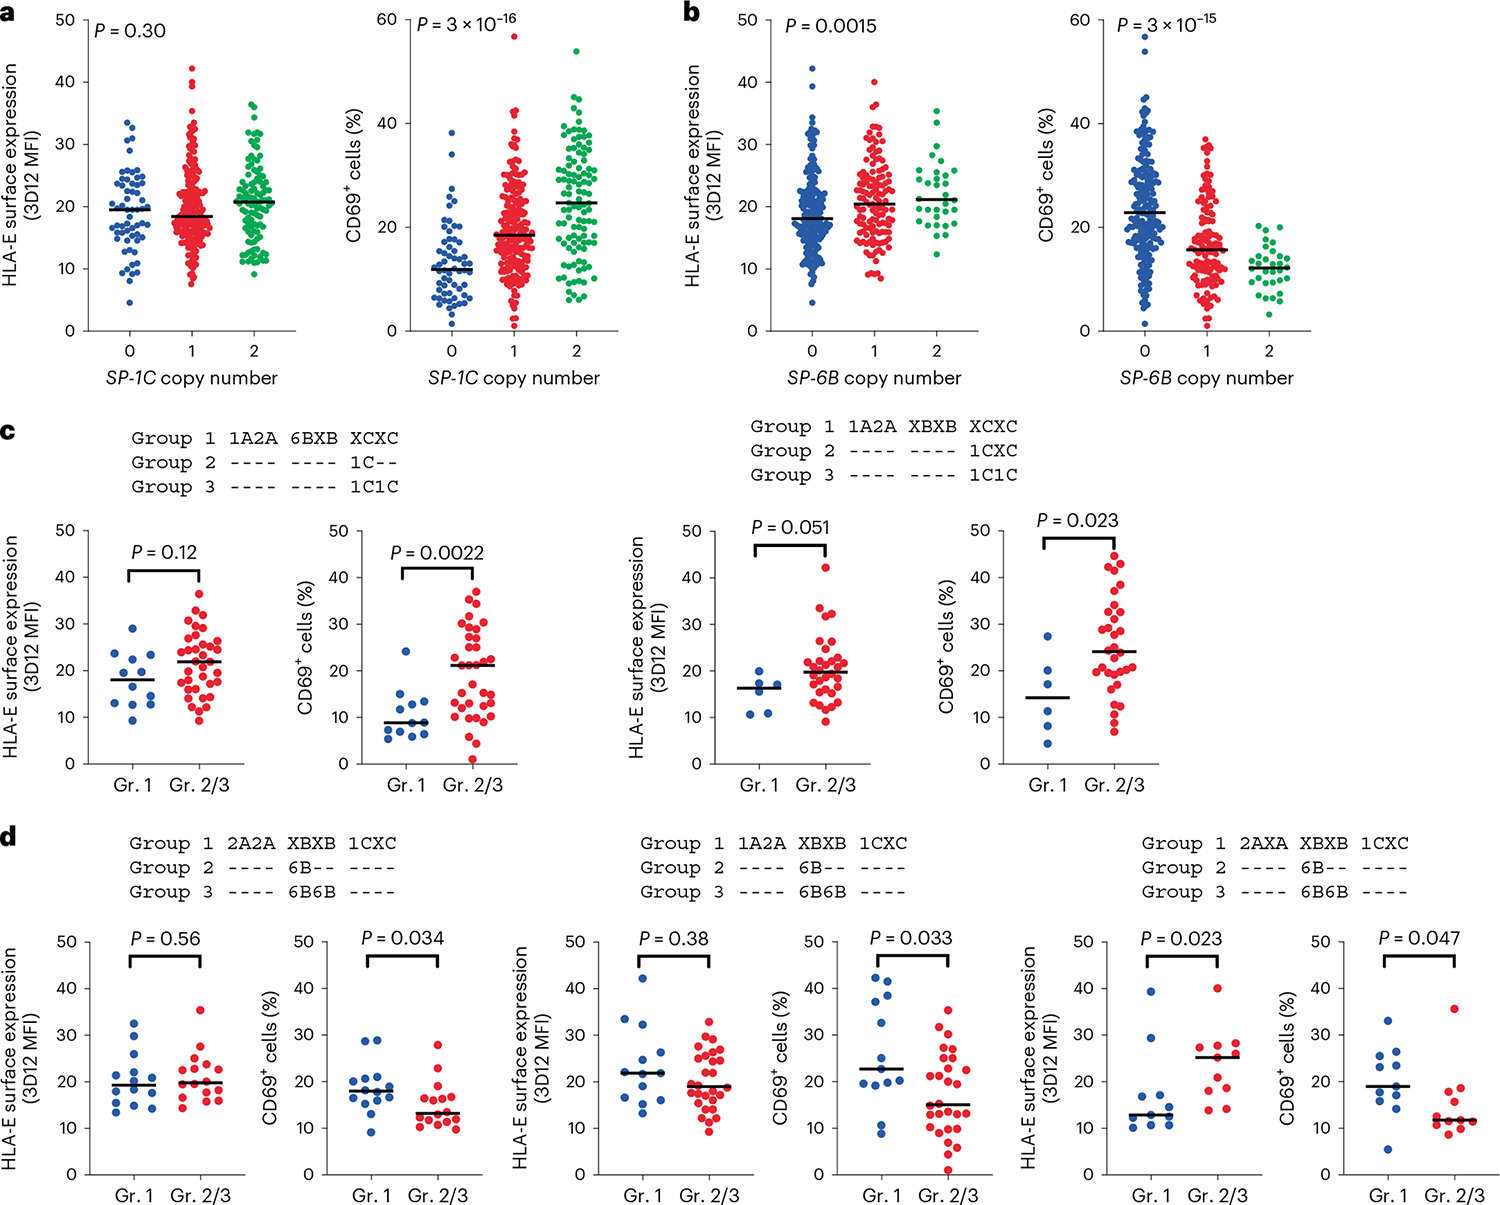
a,b, HLA-E surface expression levels on BLCLs (n = 360) and corresponding JurkatNKG2A reporter cell activity (percentage of CD69+ cells), as stratified by copy number of alleles encoding SP-1C (a) and SP-6B (b). P values for multigroup comparisons were determined by the Kruskal–Wallis test. c,d, HLA-E surface expression on BLCLs and corresponding JurkatNKG2A reporter cell activity as stratified by HLA genotypes encoding SPs (indicated above the graphs), which differed only by the presence of HLA class I alleles encoding SP-1C (c; left, n = 47; right, n = 38) or SP-6B (d; left, n = 30; middle, n = 41; right, n = 22). X designates nonfunctional SPs. Dashes indicate identity with the genotype in each respective group 1. P values were determined by a two-sided Mann–Whitney test. In a–d, lines in each group represent the median.
SP-6B is in strong negative linkage disequilibrium with SP-1C (Extended Data Fig. 10), so to definitively eliminate the possibility that presence or absence of just one of these SPs is responsible for the opposing effects of SP-1C versus SP-6B, groups of BLCLs that differed only by the presence of SP-1C (Fig. 7c) or SP-6B (Fig. 7d), and no other functional SP variants, were compared. The presence of SP-1C when holding the remainder of the SP genotype constant resulted in increased reporter cell activity (Fig. 7c), whereas the presence of SP-6B when holding the remainder of the SP genotype constant demonstrated a consistent and significant decrease in reporter cell activity (Fig. 7d). Thus, both SP-6B and SP-1C appear to contribute independently to CD94/NKG2A recognition, where SP-1C induces CD94/NKG2A-mediated inhibition of NK cells and SP-6B diminishes the inhibitory capacity of this receptor.
Discussion
Polymorphism within HLA class I SPs can affect their ability to provide a VL9 epitope for HLA-E by influencing SP processing and by changing affinity of the HLA-E–VL9 complex for CD94/NKG2. Here we systematically characterized the degree to which all common HLA-A-, HLA-B- and HLA-C-derived SPs facilitate cell surface expression of HLA-E and recognition by CD94/NKG2. Our experimental data show that only 6 out of 16 common classical HLA class I SP variants can be efficiently processed to generate epitopes that enable CD94/NKG2A–HLA-E engagement, termed ‘functional SPs’. Expression of these six SPs elicited variable levels of reporter activities, likely due to combinations of their differential influence on HLA-E expression levels and on the affinity between the specific HLA-E–VL9 complex and CD94/NKG2. Differential reporter activities were validated in blood NKG2A+ and NKG2C+ NK cells as well as NKL cells, suggesting that these data are applicable to NK cell populations in general, including tissue-resident NK cells28 that express high levels of NKG2A, as well as HCMV-induced adaptive NKG2C+ NK cells23. Importantly, the effects of SP polymorphism are not additive due to competition between the VL9 variants for binding to HLA-E. These results point to the complex nature of HLA-E–VL9 interactions with CD94/NKG2 under physiological conditions.
Low CD94/NKG2 receptor reactivity associated with SP-6B was observed consistently across experiments described here, despite VL96B showing the highest affinity for HLA-E among all common VL9 variants in peptide-pulsing experiments, which concurs with recent SPR-based data on HLA-E–VL9 stability29. These characteristics suggested that VL96B might compete with other VL9 variants for binding to HLA-E in a manner that ultimately lowers the overall receptor recognition of HLA-E–VL9 complexes on the cell. Use of BLCLs, which express multiple functional SPs, indicated that indeed, increasing copies of VL96B resulted in decreasing reporter cell recognition. VL96B, also known as −21M HLA-B, has been implicated in NK cell education based on increased functional capacity of NKG2A+ NK cells30 derived from donors carrying HLA alleles encoding this VL9 variant. According to this model, a strong interaction between CD94/NKG2A and HLA-E in the presence of −21M HLA-B results in robust education of NKG2A+ NK cells, such that these effector cells are particularly responsive against aberrant target cells. Our findings indicating relatively weak receptor binding to HLA-E–VL96B expressed on cells bearing one or two copies of this variant suggest an alternative model in which VL96B behaves antagonistically to inhibitory CD94/NKG2A–HLA-E interactions, thereby lowering the threshold for NK cell activation.
The combined frequencies of functional SPs at each individual HLA locus are remarkably similar across populations despite well-described differences in HLA allele frequencies across these same populations, suggesting that selection pressure may maintain prescribed frequencies of functional SPs at each locus. The frequency patterns indicate a dominant role for HLA-A and HLA-C loci in HLA-E-mediated regulation of effector cells at the population level, particularly given that the single ‘functional’ HLA-B SP (SP-6B) confers poor CD94/NKG2 recognition. The major contribution of HLA-A and HLA-C is also supported by the frequencies of HCMV VL9 variants, which mimic HLA-A and HLA-C (but not HLA-B) functional SPs with frequencies that correlate between the virus and the host. This correlation suggests viral adaptation to mimic host, thereby avoiding recognition by HLA-E-restricted CD8+ T cells27, yet reinforcing recognition by CD94/NKG2A, resulting in NK cell inhibition. Interestingly, VMAPRTLIL, the most frequent HCMV VL9 variant, is a derivative of SP-1C, which induced relatively high levels of HLA-E expression and receptor recognition across experiments. Thus, these data suggest that HCMV has adapted not only to the most common host classical HLA VL9 variant, but also to the most optimal in terms of binding to HLA-E and engaging CD94/NKG2A.
Differential CD94/NKG2 recognition of HLA-E–VL9 is likely to impact immune responses in disease/clinical settings31–34. HLA-E-mediated inhibition of NK and T cells expressing CD94/NKG2A has been suggested to impact antitumor immunity, which led to the development of a novel immune checkpoint inhibitor, monalizumab, that blocks CD94/NKG2A–HLA-E interactions35. HLA class I genotypes may differentially regulate the strength of CD94/NKG2A-mediated inhibition, and, if they do so predictably, it may be possible to determine the subset of patients who will benefit most from monalizumab treatment. Some tumors have been reported to express HLA-G, which is normally expressed by trophoblasts and a few immune-privileged tissues36. Expression of HLA-E–VL9G on tumor cells has been suggested to render monalizumab less effective due to strong CD94/NKG2A recognition of HLA-E–VL9G (ref. 37). Given the observed competition among VL9 peptides, the effect of HLA-G expression in response to monalizumab treatment may depend on the patient’s HLA class I genotype and the relative levels of HLA-A, HLA-B, HLA-C and HLA-G expression by tumor cells.
HLA-E is capable of restricting CD8+ T cell responses in human immunodeficiency virus (HIV) infection38, and the rhesus monkey ortholog of HLA-E, Mamu-E, is essential for clearance of simian immunodeficiency virus (SIV) infection in monkeys vaccinated with the rhesus cytomegalovirus strain 68–1 (RhCMV68–1) vectors containing an SIV insert39. The protection conferred by Mamu-E involves its ability to restrict an extremely large and diverse set of SIV CD8+ T cell epitopes, which necessarily requires RhCMV68–1-derived VL9 (refs. 39,40). The mechanism of loading noncanonical peptides is not known, but it probably involves intracellular exchange of the RhCMV68–1-derived VL9 loaded into the groove of MHC-E for the pathogen-derived epitopes39. Given that HLA SP polymorphism influences the HLA-E–VL9 assembly, it may also affect the process of viral peptide loading onto HLA-E upon HIV infection, implicating genetic regulation of immune responses in individuals vaccinated with the human analog of the RhCMV68–1-vectored vaccine.
Our comprehensive characterization of HLA class I SP polymorphism and its influence on HLA-E-mediated regulation of effector cells expressing CD94/NKG2 provide the foundation for building computational models to predict strength of immune responses based on HLA class I genotypes, affording more accurate interpretation of disease association data and understanding of disease pathogenesis.
Online content
Any methods, additional references, Nature Portfolio reporting summaries, source data, extended data, supplementary information, acknowledgements, peer review information; details of author contributions and competing interests; and statements of data and code availability are available at https://doi.org/10.1038/s41590-023-01523-z.
Methods
Blood samples and cell lines
Blood samples from healthy adult individuals for NK cell experiments were collected at the National Institutes of Health (NIH) Blood Bank under an institutional review board-approved research donor protocol 99-CC-0168 or as by-products of allogeneic blood donation. Blood samples for generating monocyte-derived macrophages were collected at the University Medical Center Hamburg-Eppendorf (Hamburg, Germany) as part of a study approved by the ethical committee of the Landesärztekammer Hamburg (PV4780). All donors provided written informed consent and blood samples were de-identified before distribution. The human B cell line 721.221 (.221, Sigma-Aldrich) was previously generated by γ-radiation of 721 cells and does not express HLA-A or HLA-B but may express very low levels HLA-C41,42. .221 cells and BLCLs were maintained in RPMI 1640 medium (Thermo Fisher Scientific) with 10% FBS (Atlanta Biologicals). β2m-knockout Jurkat cells21 were maintained in RPMI 1640 with 20% FBS. NKL cells13,24 were a gift from D. Geraghty and were maintained in RPMI 1640 with 10% FBS, 5% human serum (Sigma-Aldrich) and 1 ng ml−1 human interleukin-2 (BioLegend). RPMI 1640 medium was always supplied with 2 mM l-glutamine and 100 μg ml−1 primocin (Invivogen). HEK293T cells were maintained in advanced DMEM (Gibco) with 10% FBS and 2 mM l-glutamine (Thermo Fisher Scientific). Cells were incubated at 37 °C or 26 °C (for peptide-pulsing pre-incubation) and 5% CO2.
Antibodies and flow cytometry
Antibodies used for flow cytometry included antibodies against: HLA-E (clone 3D12), Flag (clone L5), CD3 (clone UCHT1 or SK7), CD4 (clone PRA-T4), CD8 (clone SK1), CD14 (clone HCD14 or MφP9), CD19 (clone HIB19), CD56 (clone HCD56), CD69 (clone FN50), CD94 (clone DX22), CD107a (clone H4A3), HLA-DR (clone L243), NKG2A (clone Z199, S19004C or REA110) and NKG2C (clone S19005E or REA205). Antibody REA293 was used as an isotype control for REA110. The antibodies were obtained from BioLegend, except for clones MφP9 (Invitrogen), Z199 (Beckman Coulter) and REA110/205/293 (Miltenyi Biotec). Flow cytometry analyses were performed using MACSQuant Analyzer 16 (MACSQuantufy 2.13; Miltenyi Biotec) and Flowlogic 8 (Inivai Technologies), except for the monocyte-derived macrophage experiment, where a BD LSRFortessa Cell Analyzer (FACSDiva 9.0; BD Biosciences) and FlowJo 10.8.1 (BD Biosciences) were used. The gating strategy is shown in Supplementary Fig. 1.
Immunogenetic analyses
HLA class I allele frequencies for the US NMDP populations were obtained from Allele Frequency Net Database (http://www.allelefrequencies.net/). Allele-specific SP sequences were determined using IPD-IMGT/HLA Database (https://www.ebi.ac.uk/ipd/imgt/hla/). Predicted haplotypes for the US NMDP populations were collected from https://frequency.nmdp.org/. Of 20,109 HLA haplotypes, 18,200 (91%) contained HLA-A, HLA-B and HLA-C alleles encoding SPs considered in this study. The 2014 1000 Genomes Project HLA data are available from https://www.internationalgenome.org/category/hla/. This dataset contains 1,274 genotypes, and we were able to assign SP variants to 1,266 of them.
HLA typing of BLCLs was performed using a targeted next-generation sequencing method. Briefly, locus-specific primers were used to amplify polymorphic exons of HLA-A, HLA-B, HLA-C and HLA-E genes with Fluidigm Access Array (Fluidigm). The PCR amplicons were pooled and subjected to sequencing on either the Roche 454 platform (Roche) or the Illumina MiSeq platform (Illumina). HLA alleles and genotypes were called using the Assign ATF 1.5.0.1158 (Conexio Genomics) or HLA Explore 2.0.0 (Omixon) software.
HLA-E stabilization on .221 cells by peptide pulsing
Synthetic peptides (GenScript Biotech) were dissolved in DMSO at 10 mM. .221 cells were cultured at 26 °C overnight, washed and resuspended in Opti-MEM I Reduced Serum Medium (Gibco). Approximately 106 cells were mixed with peptides at various concentrations (0.1–100 μM) in 300 μl total volume in a 96-well round-bottom plate and incubated at 26 °C for 30 min. For the flow cytometric analysis, the cells were further incubated at 37 °C for 3 h. For experiments using the pulsed cells as targets, the cells were added to effector cells immediately after incubation at 26 °C and further incubated at 37 °C. A separate flask of .221 cells was kept at 26 °C after the overnight incubation, and these cells were used as positive control for flow cytometry analysis.
HLA-E peptide exchange sandwich ELISA assay
A previously optimized peptide exchange ELISA-based binding assay was used to test SP binding to HLA-E*01:03 (refs. 18,19). In brief, pre-purified HLA-E*01:03 refolded with an ultraviolet-sensitive VL9 variant (VMAPJTLVL) was incubated in l-arginine-redox buffer (100 mM Tris pH 8.0, 400 mM l-arginine monohydrochloride, 2 mM EDTA, 5 mM reduced glutathione, 0.5 mM oxidized glutathione) with 25 μM of test peptide overnight at 4 °C. The degree of peptide-HLA-E*01:03 complex recovery for the individual SPs was interrogated the following day, using a sandwich ELISA that uses anti-HLA-E capture (3D12, BioLegend) and β2m detection (polyclonal anti-human β2m horseradish peroxidase-conjugated IgG detection antibody, Thermo Fisher Scientific) with signal enhancement (EnVision+ System-HRP, Agilent). ELISA plates were developed in 100 μl of 3,3′,5,5′-tetramethyl benzidine (TMB) substrate (BioLegend) and reactions were terminated by adding 100 μl H2SO4 STOP solution (BioLegend). Absorbance readings were subsequently measured at 450 nm on a FLUOstar OMEGA plate reader. Two biological repeats and three technical repeats for each biological sample were tested for each peptide.
Differential scanning fluorimetry-based HLA-E thermal melt analysis
The thermal stability of SP-loaded HLA-E*01:03 was measured by differential scanning fluorimetry, according to a previously described protocol19 but with minor modifications. In brief, peptide ‘empty’ β2m-HLA-E*01:03 material, pre-refolded and frozen in 50 mM Tris pH 7, 150 mM NaCl buffer/20% glycerol, was thawed and immediately incubated with a molar-equivalent concentration of test peptide in a 20 μl final volume of 50 mM Tris pH 7, 150 mM NaCl buffer. Following a 30-min room-temperature incubation to allow peptide binding, individual samples were split between two Prometheus Grade Standard Capillaries (Nanotemper) and placed in the capillary tray of a Prometheus Panta (Nanotemper) instrument. Excitation power was adjusted to cover a range of 8,000 to 15,000 raw fluorescence units, with fluorescence emission detection at 330 nm and 350 nm. A 1 °C min−1 thermal ramp over a range of 20 °C to 95 °C, was applied. Automated thermal melt data calling was achieved using the Thermal Unfolding Analysis software within PR.Panta Analysis, v1.2. Three biological repeats and two technical repeats per biological sample were assayed for each peptide.
Lentiviral transduction
.221 cells expressing SP/HLA hybrids and JurkatNKG2 reporter cells were generated using lentiviral transduction. DNA fragments encoding genes of interest were either synthetically derived (LifeSct and Thermo Fisher Scientific) or generated by PCR and cloned into lentiviral transfer vector pLVX-SFFV-IRES-Puro21 using NEBuilder HiFi DNA assembly kit (New England Biolabs). The transfer plasmid of interest, envelope (pCMV-VSVG; Addgene) and packaging (psPAX2; NIH AIDS Reagent Program) plasmids were transfected into HEK293T cells using Lipofectamine 2000 Reagent (Thermo Fisher Scientific). Lentiviral supernatant was collected after 72 h and used to transduce either .221 or Jurkat-β2m-knockout cells. The expression cassettes in plasmids used for the .221 cells transduction encoded HLA with a FLAG-tag inserted between the SP variant and the mature protein. The .221-transductants were selected using 0.25 μg ml−1 puromycin. Jurkat-β2m-knockout cells were transduced simultaneously with plasmids encoding DAP12, CD94 and chimeric NKG2A (or NKG2C). The chimeric NKG2A and NKG2C were composed of original ectodomains, the membrane-proximal and transmembrane domains of NKG2C to allow association with DAP12, and the cytoplasmic domain of CD94 (Fig. 2a). After transduction, Jurkat-β2m-knockout cells were cultured for 3 days and sorted for CD3+NKG2+ cell population (Sony SH800S Cell Sorter).
HLA-E and NKG2A expression measurements
.221 cells expressing individual SP/HLA hybrids were grown to similar densities in 24-well plates (105–106) in a 1-ml volume. Flow cytometric analysis of HLA-E expression was performed with 3D12 and/or anti-FLAG antibodies on at least three different days, with 2-day intervals. For each experiment, 800 μl cells were used for staining, and 200 μl cells were cultured further with fresh medium. Estimation of HLA-E expression levels involved two adjustments: (1) background MFI values of cells transduced with vector expressing irrelevant protein (ZsGreen) were subtracted; (2) MFI values were normalized to the average MFI across samples to adjust for daily instrumental variation.
For peptide-pulsed .221 cells, HLA-E expression index was calculated as follows: ((sample − neg_ctrl)/(pos_ctrl − neg_ctrl)) × 100, where neg_ctrl represents unpulsed .221 cells mixed with DMSO and pos_ctrl represents unpulsed .221 cells incubated constantly at 26 °C.
BLCLs were stained with 7AAD and 3D12 antibody, and HLA-E expression levels were estimated for the 7AAD negative population. To detect HLA-E expression levels on blood cell subsets, peripheral blood mononuclear cells (PBMCs) were stained with 3D12 or isotype control and the subset-specific antibodies: anti-CD3, anti-CD4, anti-CD8, anti-CD14, anti-CD19 and anti-CD56. B cells were defined as CD19+, monocytes as CD14+, NK cells as CD3−CD56+, CD4+ T cells as CD3+CD4+CD8− and CD8+ T cells as CD3+CD4−CD8+. Isotype control MFI values were subtracted from 3D12 MFI values. MFI values were normalized to the average MFI across samples to adjust for daily instrumental variation. To compare MFI data across different experiments, reference sets of samples repeated between the experiments were used for further adjustment of MFI values.
To measure HLA-E expression levels on subsets of PBMCs after IFNγ treatment, one million PBMCs were cultured in 1 ml of RPMI 1640 medium containing 10% FBS with 5 ng ml−1 IFNγ (BioLegend) in 24-well plates for 2 days. Cells were stained and gated as described above for untreated PBMCs.
For measurement of HLA-E expression levels on monocyte-derived macrophages, monocytes were isolated from human PBMCs using the EasySep Human CD14 Positive Selection Kit II (StemCell). The cells were cultured in RPMI 1640 medium containing 10% FBS and 40 ng ml−1 M-CSF at 1 million cells per ml in a 24-well plate for a minimum of 7 days. In total, 1% penicillin–streptomycin and 2.5 μg ml−1 amphotericin B were added to medium for the first 3 days of culture. Macrophages were then stimulated overnight with 100 U ml−1 IFNγ (PeproTech) and stained with 3D12.
NKG2A expression level was determined for JurkatNKG2 reporter cells, NKL cells and PBMCs by staining with anti-NKG2A antibody and the isotype control. Primary NK cells were gated as the CD3−CD56+ population among PBMCs. Isotype control MFI values were subtracted from anti-NKG2A MFI values.
JurkatNKG2 reporter cell activation assay
Target cells were mixed with JurkatNKG2 reporter cells at an effector-to-target ratio of 1:4 (.221-SPE, VL9-pulsed .221 and BLCLs) or 1:10 (monocyte-derived macrophages) in a round-bottom 96-well plate. The plate was centrifuged at 450g for 1 min and incubated for 4 h (.221-SPE, BLCLs and macrophages) or 3 h (VL9-pulsed .221) at 37 °C. Reporter cells without target cells were used as background control. Cells were subsequently stained with anti-CD3, anti-CD69, anti-NKG2A or anti-NKG2C antibodies. Reporter activity (percentage) was calculated as the percentage of CD69+ cells among CD3+NKG2A+ or CD3+NKG2C+ cell populations.
Surface plasmon resonance analysis
Soluble NKG2 heterodimers were produced as NKG2A/C fused to the ectodomain of CD94 via a flexible (GGS)2 linker. In brief, constructs encoding the chimeric proteins with a His6 tag, utilizing the pHLSec-Avitag3 construct backbone, were transfected into Expi293F suspension cells according to the manufacturer’s protocols (Expi293 Expression System, Thermo Fisher Scientific). After 5 days of expression, the supernatant was harvested, clarified by centrifugation and filtration, and the tagged proteins purified by immobilized metal affinity chromatography utilizing a Ni-NTA column attached to an Akta start FPLC system (Cytiva Life Sciences) followed by size-exclusion chromatography using a Superdex S200 increase column, equilibrated with 150 mM NaCl 20 mM Tris pH 8. Biotinylated HLA-E*01:03 trimers were produced by chemical refolding from Escherichia coli-expressed inclusion bodies and enzymatic biotinylation4,15,16,43.
SPR equilibrium dissociation measurements were made using a BIAcore T200 system equilibrated with HBS-EP+ buffer, with multiple streptavidin-coated Series S SA Sensor Chips. Two independent experiments were conducted, utilizing two chips for each experiment (three peptides and a control flow cell for each chip). In experiment 1, approximately 500 response units of ligand were immobilized in each flow cell, as compared to Experiment 2, in which approximately 700 response units were immobilized. An irrelevant control protein of roughly the same molecular weight as HLA-E trimer was immobilized in flow cell 1 of each chip, and the response across this flow cell was subtracted as a background signal. Analytes (soluble NKG2 proteins) were injected as a twofold dilution series at a flow rate of 30 μl min−1, and 30 s association followed by 15–30 s dissociation time and the response at equilibrium was measured. Concentration of analyte was plotted against equilibrium binding response for each protein and peptide interaction and the Kd and Bmax values determined using Prism 9 (GraphPad) to fit the data using a 1:1 equilibrium model.
Primary human NK cell and NKL cell degranulation assay
For experiments assessing the activity of primary NK cells toward .221-SPE*01:03 cells, primary NK cells were isolated from cryopreserved PBMCs by using EasySep Human NK Cell Isolation Kit (StemCell Technologies). After isolation, NK cells were incubated for 1 h at 37 °C/5% CO2 in RPMI 1640 medium containing 10% FBS, 2 mM l-glutamine and 100 μg ml−1 primocin, and subsequently mixed with 2 × 10⁵ .221-SPE*01:03 cells at an effector-to-target ratio of 1:1 in 200 μl medium containing brefeldin A (BioLegend) and anti-CD107a antibody in a round-bottom 96-well plate. The plate was centrifuged at 450g for 1 min and incubated for 2 h at 37 °C/5% CO2. Following incubation, cells were stained with 7AAD, anti-CD3, anti-CD56, anti-NKG2A and anti-NKG2C antibodies. NK cells were gated as the 7AAD−CD3−CD56+ population. NK cell activation level was measured as the percentage of cells expressing degranulation marker CD107a. Inhibition level of NK cells was calculated as: (1 − (sample − neg_ctrl)/(pos_ctr − neg_ctrl)) × 100, where neg_ctrl represents NK cells incubated without target cells (Target−) and pos_ctrl represents NK cells incubated with .221 cells expressing transgenic HLA-E*01:03 with its own SP. NKL cell assays assessing activity toward .221-SPE*01:03 cells were done identically as for primary human NK cells.
Molecular dynamics simulation analysis
Models of CD94/NKGA–HLA-E complexes with VL91A and VL96B were built from Protein Data Bank structure 3CDG loaded with VL9G (https://www.rcsb.org/) by performing the edits to VL9G in PyMOL 2.4.0 (https://www.pymol.org/). Molecular dynamics simulations used Amber 22 (ref. 44). The explicit solvent simulations used the latest force-field parameters ff19SB and water model OPC45,46. The receptor–HLA complexes, water and monovalent ions (Na+/Cl−) were combined in a cuboid solvent box, with the solute-periodic box minimum distance of 12 Å, using Amber’s LEaP module. Explicit solvent PME dynamics was used, with the net solute charge neutralized with Na+ ions and additional Na+/ Cl−ions added for the net 0.15 M salt concentration. Molecular dynamics simulations were run with time steps of 2 fs using the SHAKE algorithm, with the Berendsen thermostat and algorithm used to maintain the temperature of 298 K and the pressure of 1.0 Pa in NPT simulations with a 9-Å cutoff for the non-bonded interactions.
A 12-step equilibration started with solvent energy minimization (proteins restrained), followed by short phases of heating and dynamics at 298 K and energy minimizations with decreasing harmonic restraints applied at first to all the heavy atoms of the proteins and then only to the backbone heavy atoms. The last phase was an unrestrained heating to 298 K over 0.2 ns and dynamics over 2 ns. Unrestrained production MDs were performed for 5 μs.
The results were analyzed with Amber tools, PyMOL (Supplementary Code 1), and Prism 9 (GraphPad). Root-mean-square deviation analysis (Cα atoms) showed that the α1 and α2 helices comprising the binding groove and the β-sheets experience low and comparable distortions (~1 Å) in both models and thus can be used as a frame of reference for measuring distortions of the peptides inside them and the heterodimeric receptor and its subunits.
Quantitative analysis of HLA-E bound peptides by mass spectrometry
The immunoprecipitation of HLA immune complex from two BLCLs, BLCL1 (A*02:01/32:01, B*40:02/44:03, C*04:01/02:02; alleles encoding functional SPs are underlined) and BLCL2 (A*02:01/74:02, B*42:01/50:01, C*06:02/*17:01) was performed using W6/32 antibody. HLA peptides were acid eluted from 90% of the immune complex, while 10% were subjected to trypsin digestion to access the HLA-E pull down.
Parallel reaction monitoring (PRM) was performed on the HLA peptides using Fusion (Thermo Scientific) coupled to nanoflow liquid chromatography (Thermo Easy nLC 1200, Thermo Scientific). The acquisition scan involved two scan events, the first being a full scan event followed by a PRM event targeting the doubly charged precursor HLA-E peptides. The full scan event was performed at a resolution of 120,000 over a mass range of 400–1,200 m/z with an ion accumulation target set at 4e5 and max injection set at 250 ms. The PRM event was performed at an orbitrap resolution of 30,000, a target automatic gain control of 5e4 and maximum fill time of 500 ms. The precursor ion was isolated using a window of 1.6 m/z, and fragmentation was performed with a normalized collision energy of 30. The tryptic digest was analyzed using Fusion, where instead of PRM, tandem mass spectrometry was performed at an orbitrap resolution of 15,000, a target automatic gain control of 5e4 and maximum fill time of 22 ms.
Analysis of these PRM data was performed with Skyline (22.2.0.351)47, and Proteome Discoverer 2.4 (Thermo Scientific) was used for analysis of the tryptic digest. The selection of the precursor and their fragment ions was automatically performed by the program. Each selected peak was manually verified and only the integrated peak values for the precursor ion were retained for further analysis. The area intensity was normalized to the abundance of HLA-E obtained from the tryptic digest to compare the intensities of the peptides within cell lines.
Statistics and software
Statistical analyses were performed using Prism 9. Pairwise comparisons were performed by the Mann–Whitney U test. Comparisons between three or more groups were performed by the Kruskal–Wallis test. R2 for correlations were determined by Spearman correlation analysis. Plasmids design and DNA sequence analyses were performed by using SnapGene 5.3.3 (Dotmatics) and Sequencher 5.4.6 (Gene Codes).
Extended Data
Extended Data Fig. 1 |. HLA class I SP frequencies in human populations.
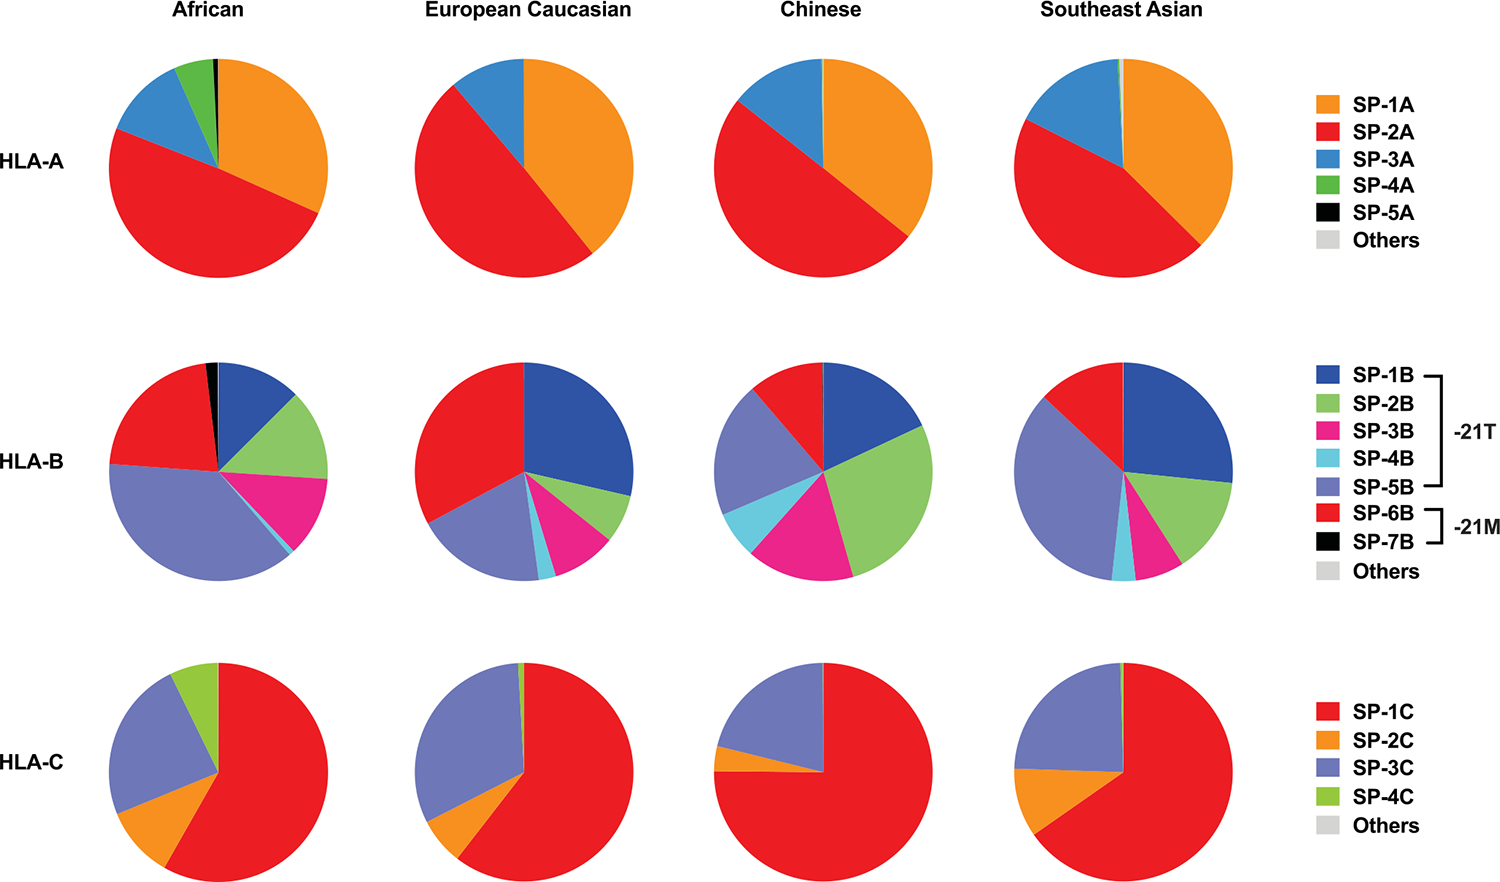
Allelic frequencies of SP variants were determined based on HLA class I allele frequencies obtained from www.allelefrequencies.net for four USA NMDP populations, including African (n = 28,557), European (n = 1,242,890), Chinese (n = 99,672), and Southeast Asian (n = 27,978). SP sequences and corresponding HLA class I alleles are shown in Table 1.
Extended Data Fig. 2 |. Differential binding of VL9 peptides to HLA-E.
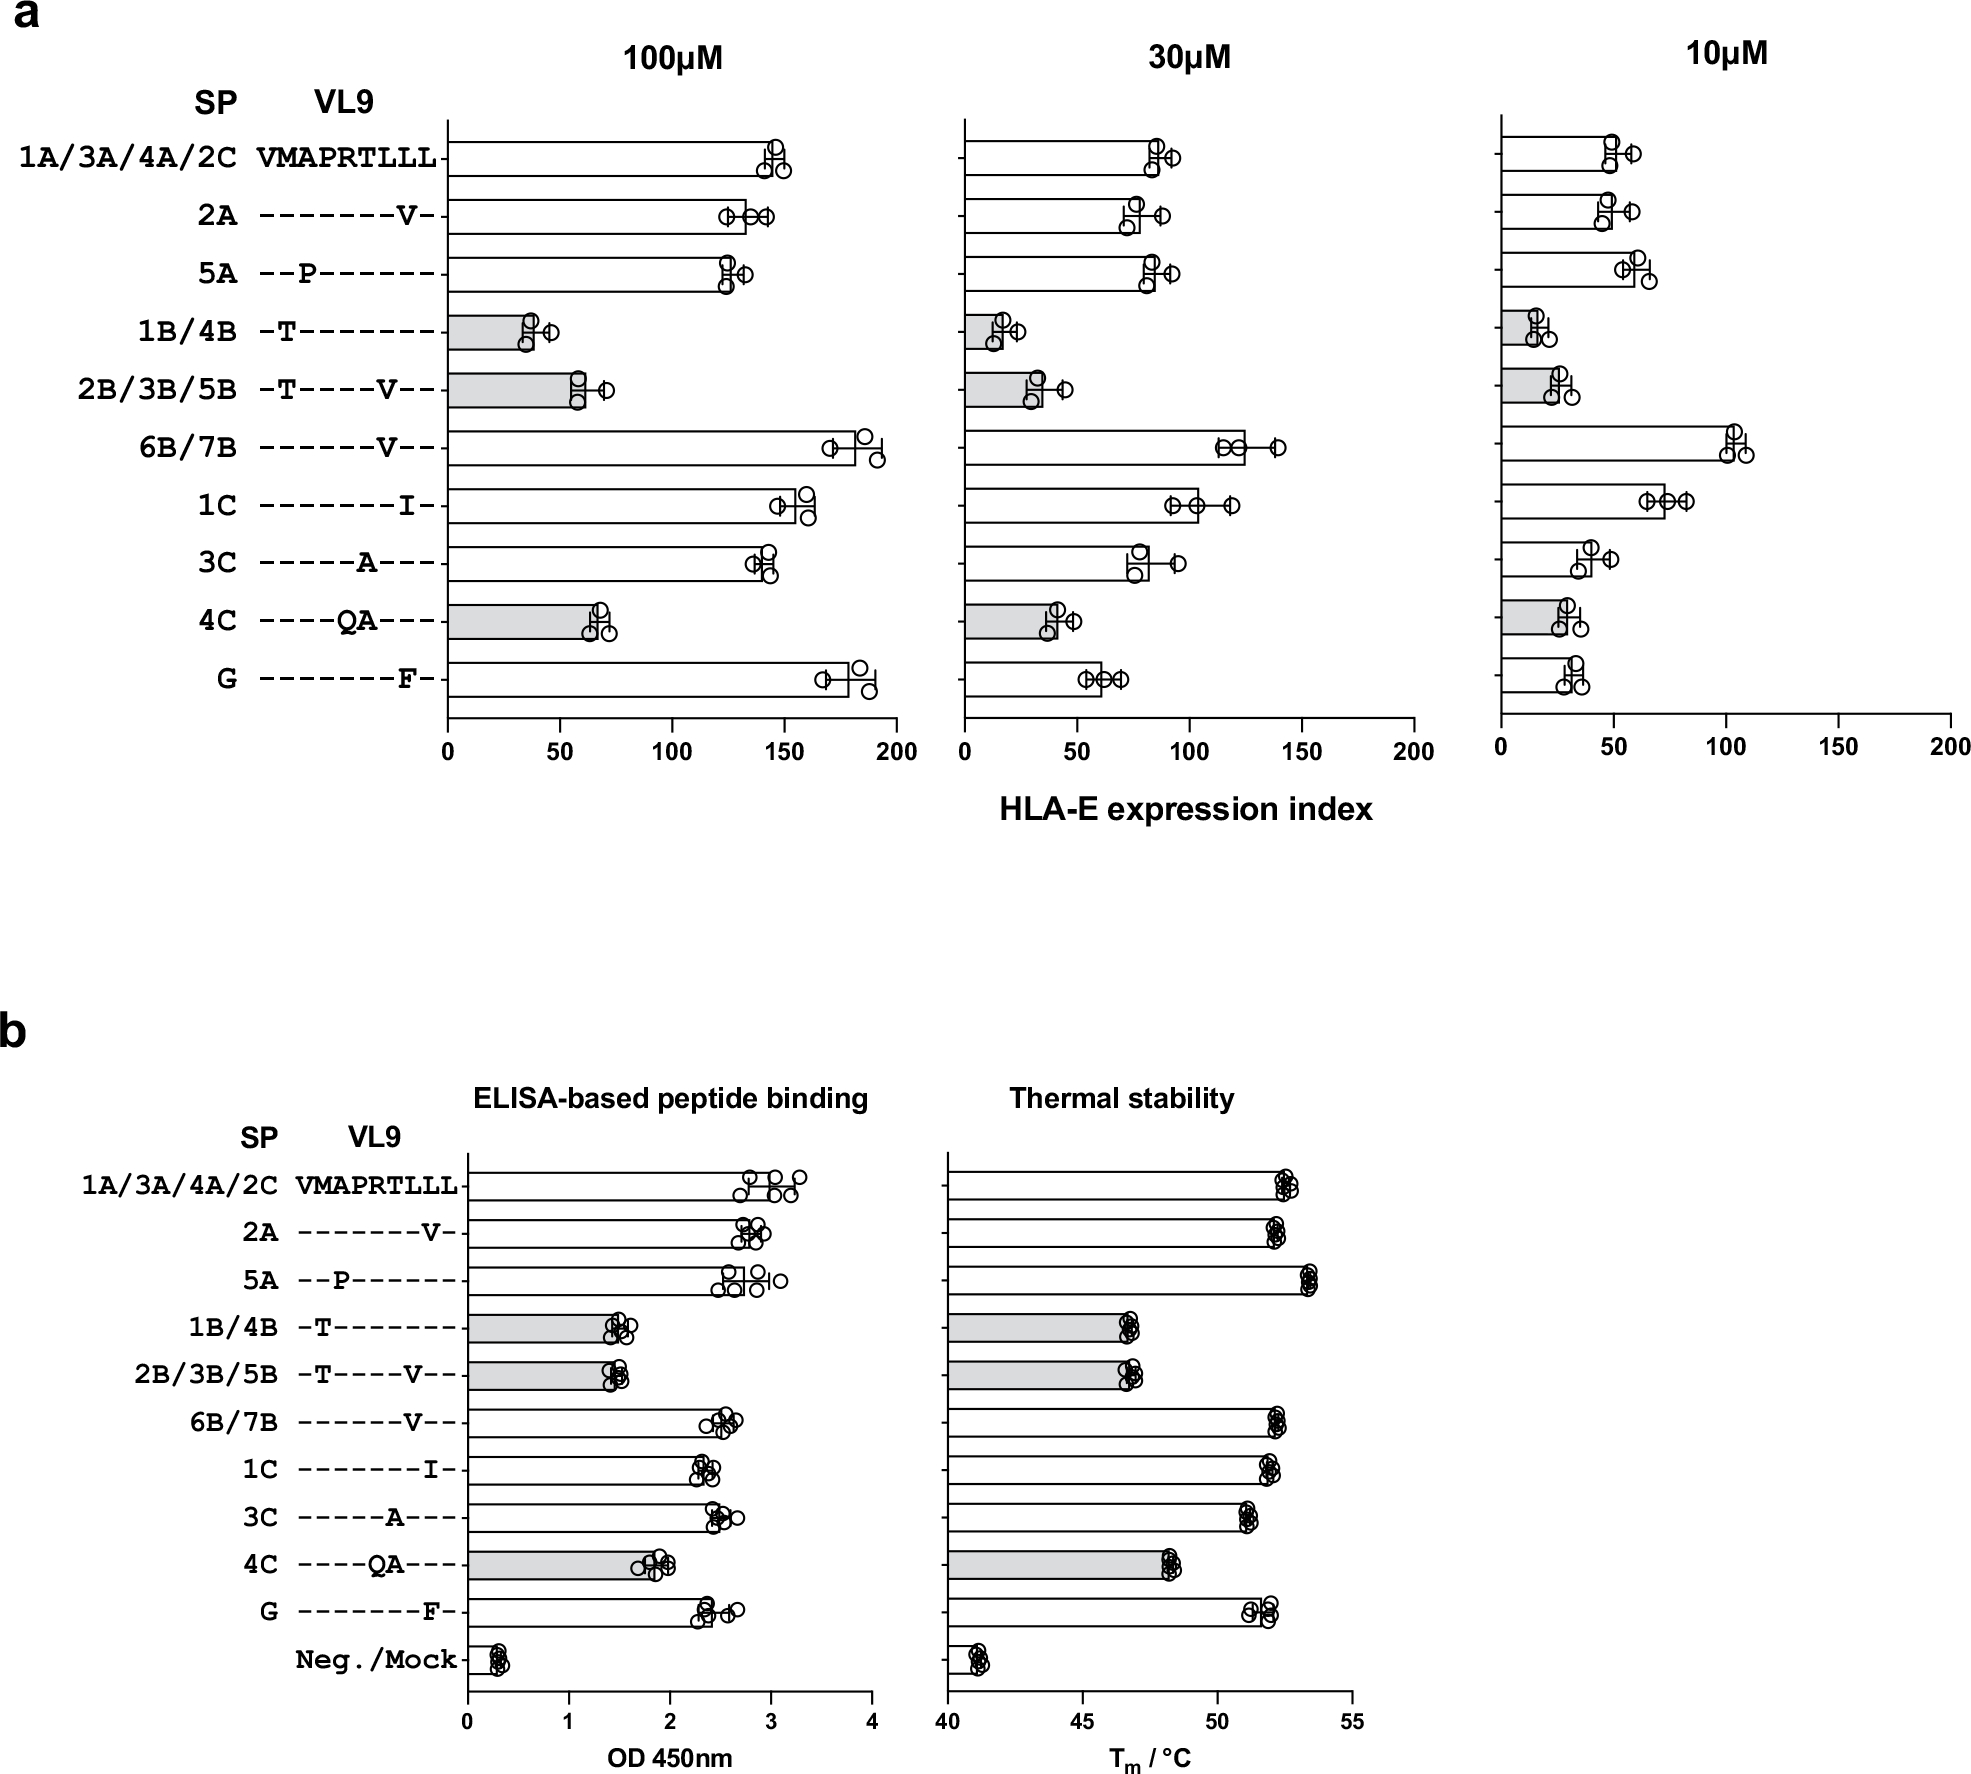
a, HLA-E surface expression level on VL9-pulsed .221 cells measured by flow cytometry using 3D12 antibody. Cells were pulsed with peptides at 100, 30, and 10 μM concentrations. Peptide sequence alignments labeled with the corresponding SP variants are shown on the left. The expression index was calculated using 3D12 MFI as follows: ((sample − neg_ctrl) ÷ (pos_ctrl − neg_ctrl)) × 100, where neg_ctrl represents unpulsed .221 cells mixed with DMSO and pos_ctrl represents unpulsed .221 cells incubated constantly at 26 °C. Data represent triplicate experiments and reflect endogenous HLA-E*01:01 expression. b, VL9 binding to HLA-E*01:03 estimated using ELISA-based peptide binding and thermal stability assays. Bar charts represent absorbance signals at 450 nm reflecting the degree of VL9HLA-E complex recovery in the sandwich ELISA assay and thermal melting temperatures of VL9HLA-E determined using differential scanning fluorimetry. Data represent six experiments. a, b, Light gray bars depict the three peptides that showed the lowest binding levels consistently across experiments. Error bars represent the mean ± SD.
Extended Data Fig. 3 |. Differential HLA-E expression on the surface of .221-SPE cells and correlations of HLA-E expression levels between pairs of distinct measurements.
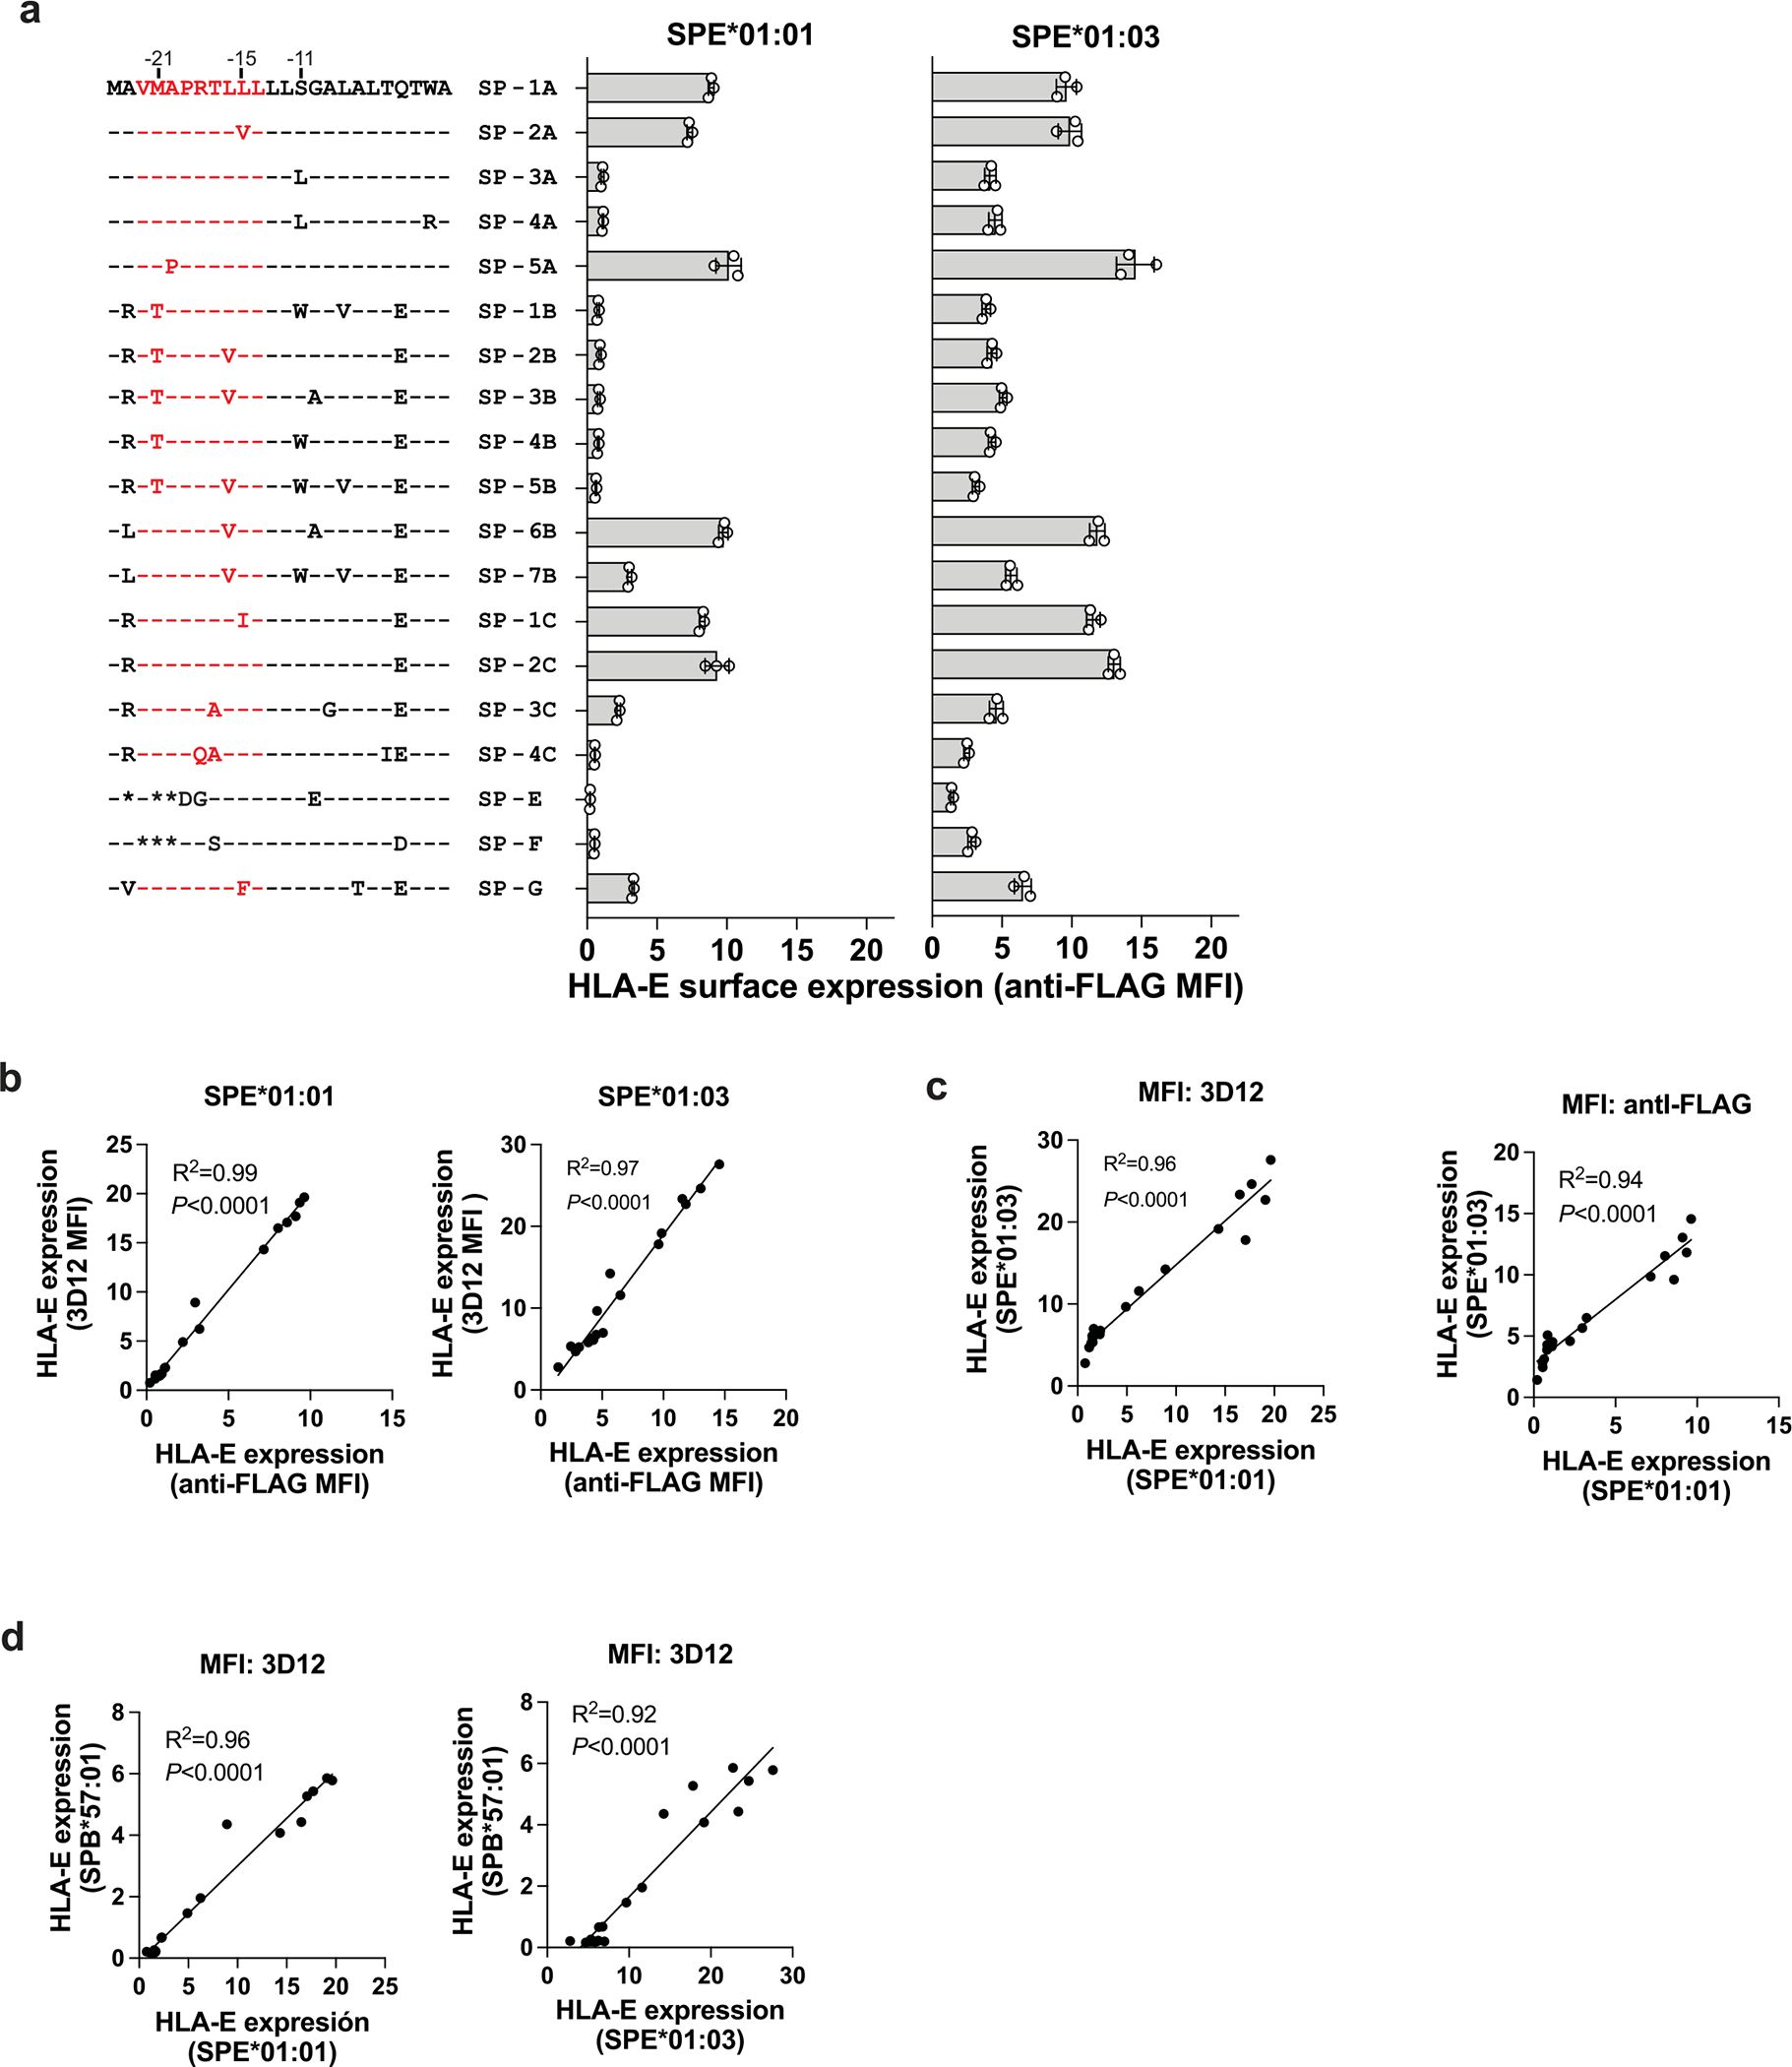
a, Cell surface expression levels of HLA-E on .221-SPE*01:01 and .221-SPE*01:03 cells measured by flow cytometry using anti-FLAG antibody. Data represent measurements on different days (n = 3). Error bars represent the mean ± SD. Amino acid sequence alignments of corresponding SP variants are shown on the left. VL9 peptide is shown in red. b, Correlations between HLA-E expression levels measured using anti-FLAG antibody and those measured using 3D12 antibody on the surface of .221-SPE*01:01 or .221-SPE*01:03 cells. c, Correlations between HLA-E expression levels on .221-SPE*01:01 cells and those on .221-SPE*01:03 cells measured using 3D12 or anti-FLAG antibodies. d, Correlations of HLA-E expression levels on .221-SPB*57:01 and those on .221-SPE*01:01 or .221-SPE*01:03. b-d, R2 was determined by Spearman correlation analysis and is shown with a two-tailed P value.
Extended Data Fig. 4 |. HLA-E expression levels on various cell types.
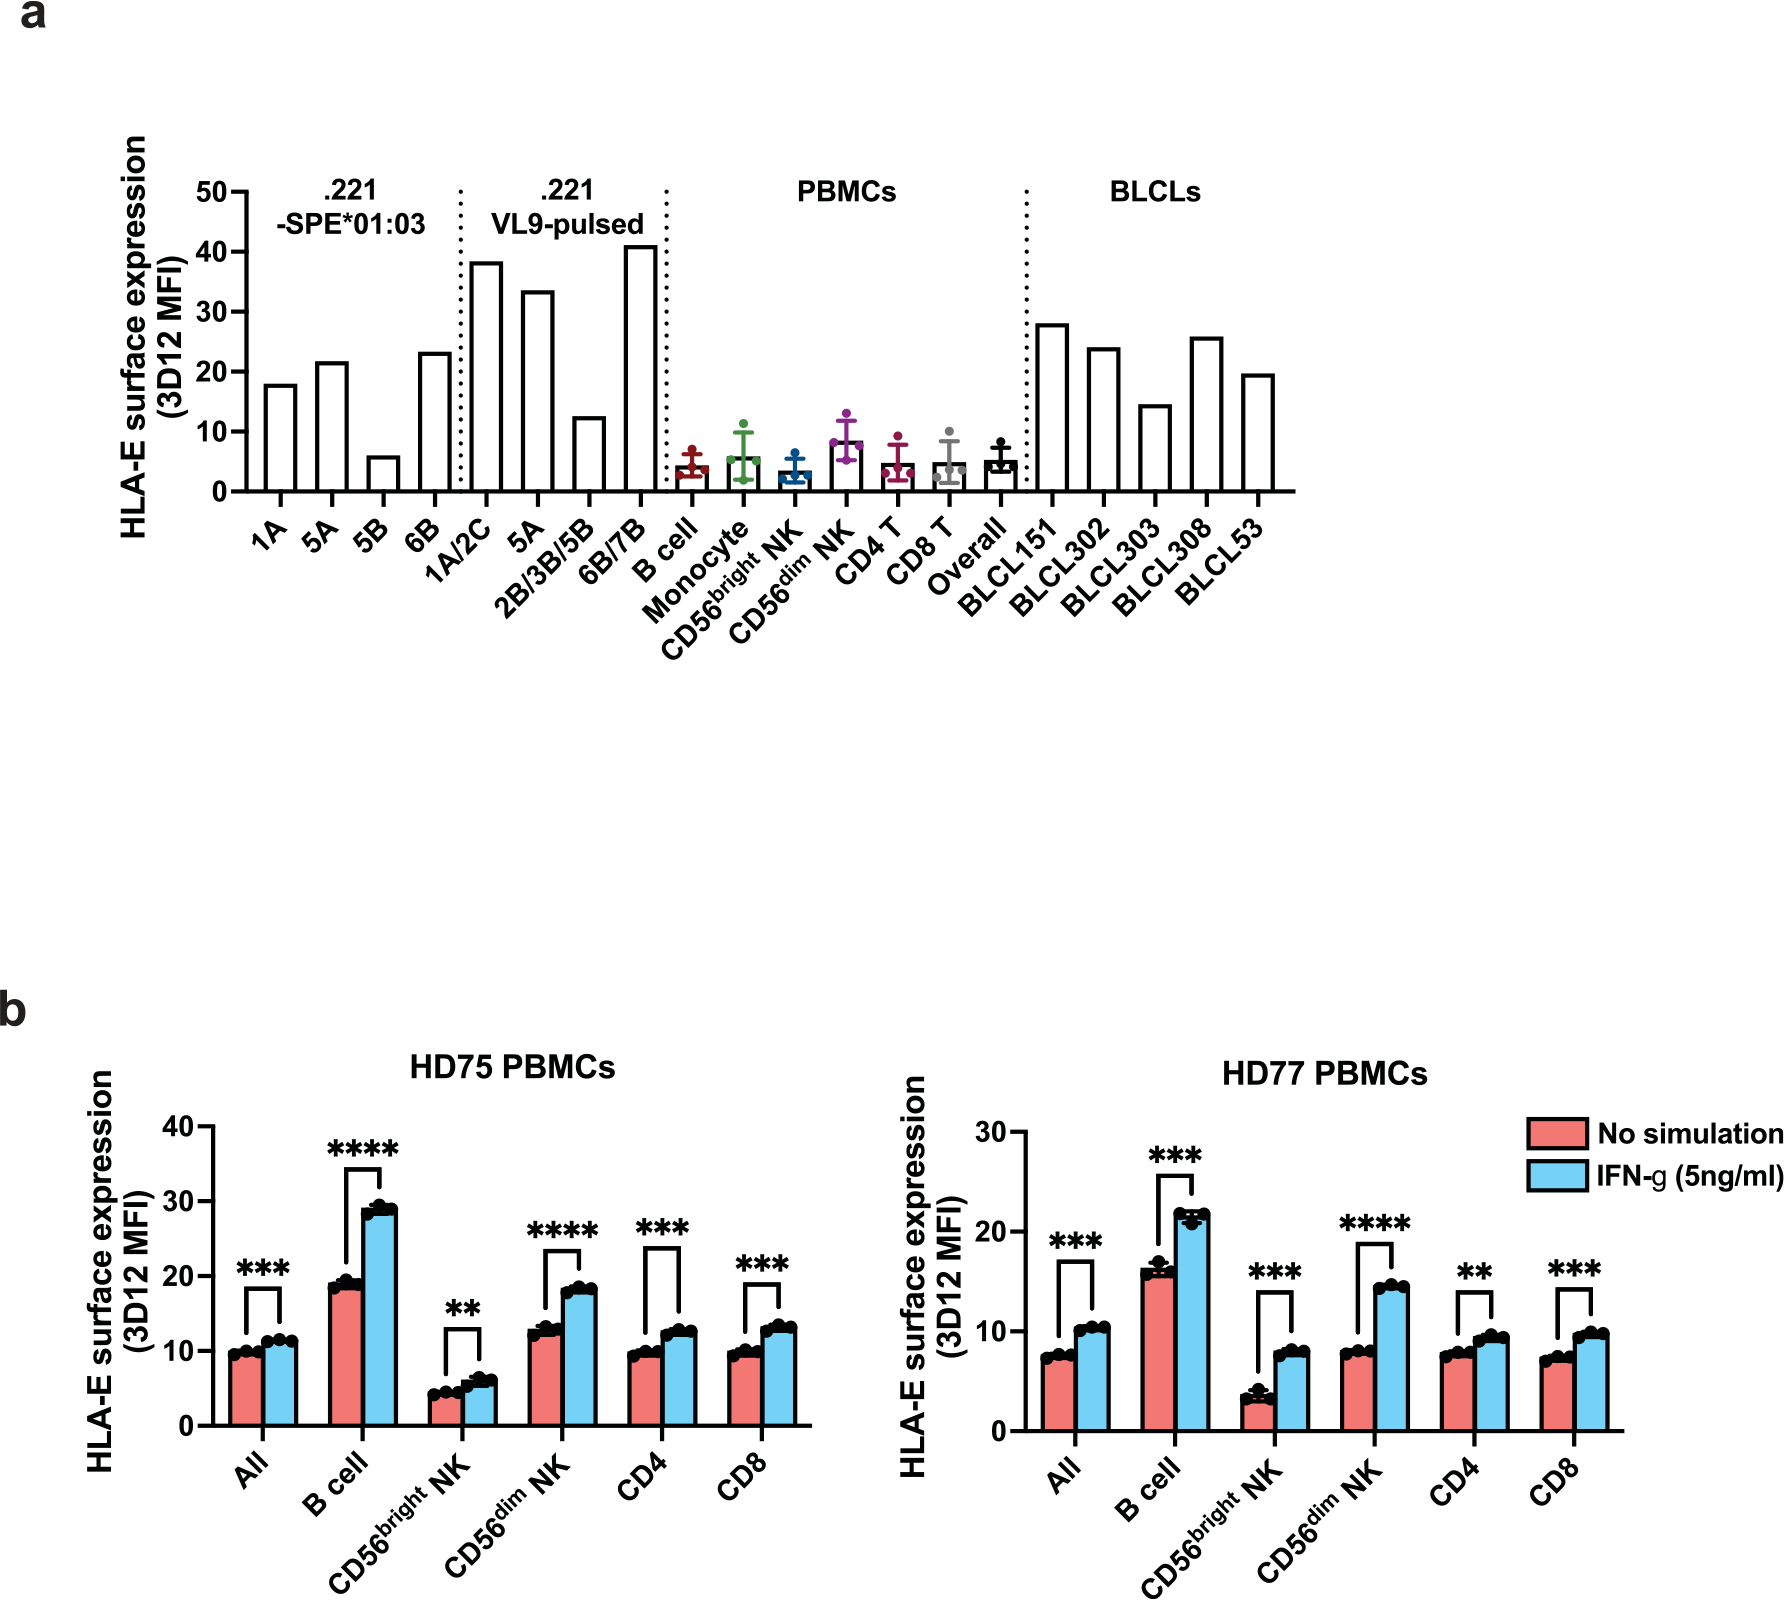
a, HLA-E expression levels on .221-SPE*01:03 cells, .221 cells pulsed with 100 μM VL9 peptides, PBMCs, and BLCLs. Error bars for PBMCs reflect variation across four donors (mean ± SD). The Y axis represents MFI obtained by 3D12 antibody staining minus MFI obtained by isotype control staining for each cell type. b, HLA-E expression levels on PBMCs and cell type subsets after 48 hours in culture with or without IFN-γ treatment. Data for two healthy donors (HD) are shown (HD75 and HD77) and represent triplicate experiments. Error bars represent the mean ± SD. P values for comparison between IFN-γ-treated and untreated cells were determined by a two-sided unpaired t-test: * - P < 0.05, ** - P < 0.01, *** - P < 0.001, **** - P < 0.0001.
Extended Data Fig. 5 |. JurkatNKG2A and JurkatNKG2C reporter activity against VL9-pulsed .221 cells.
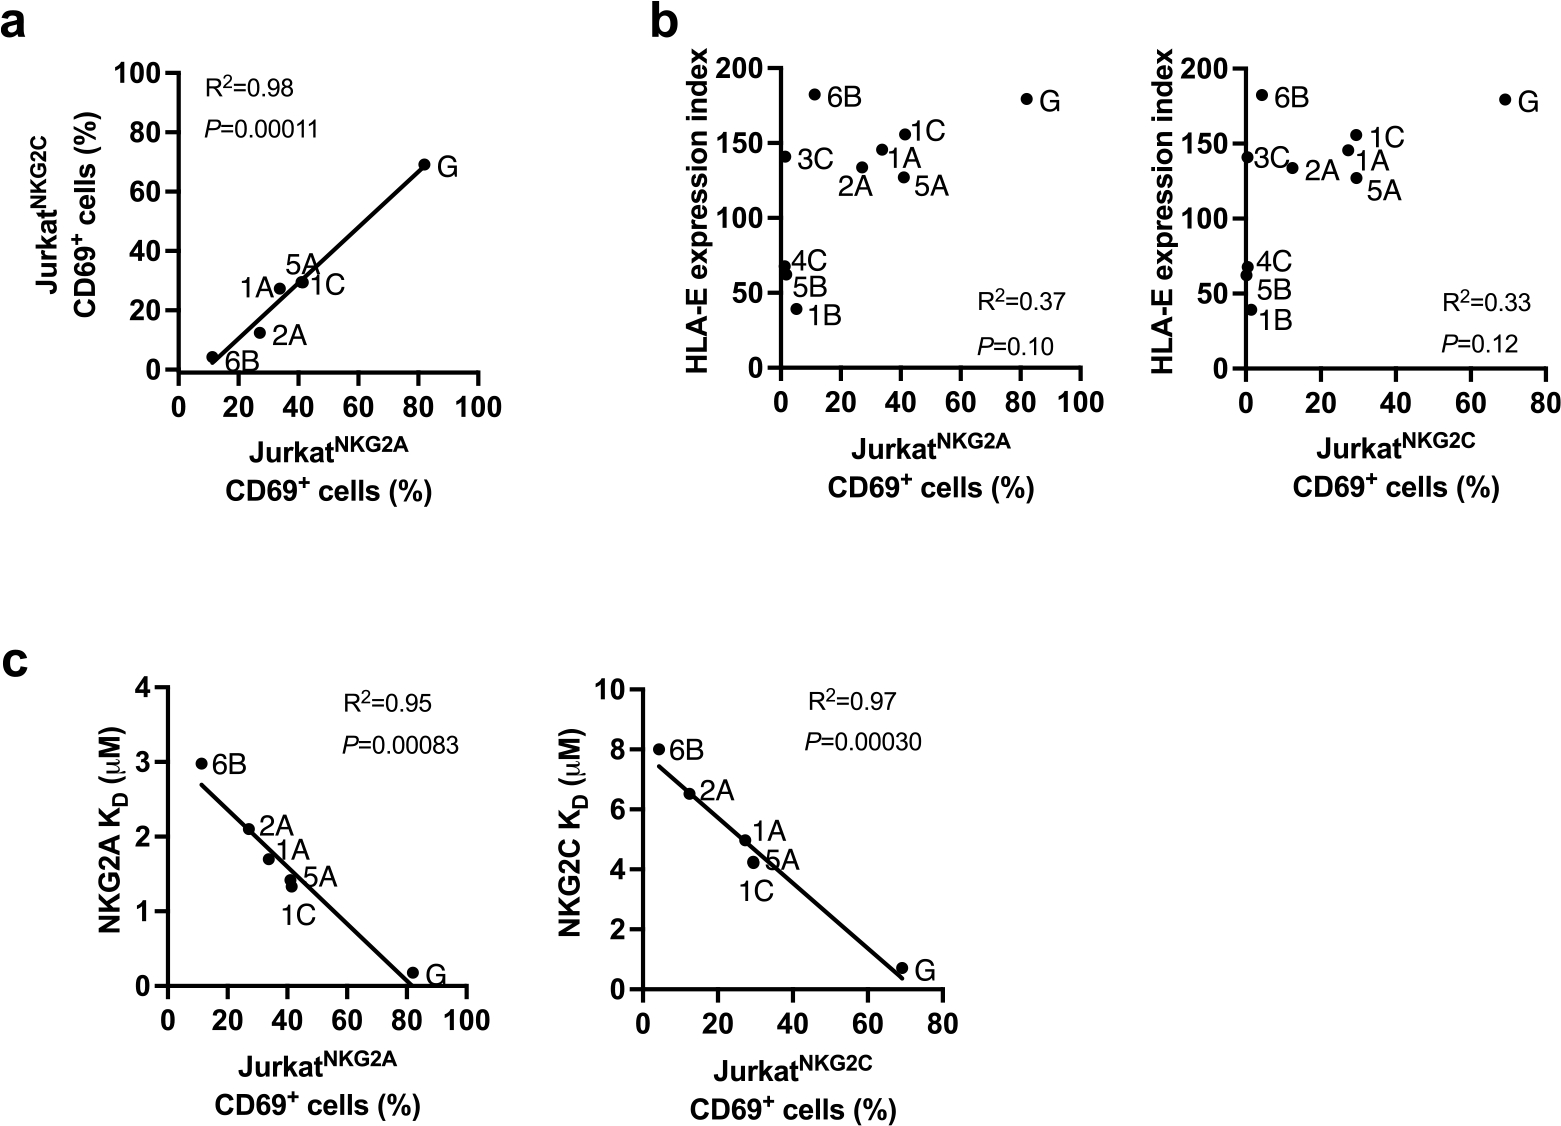
a, Correlations between JurkatNKG2A and JurkatNKG2C reporter activity against VL9-pulsed (100uM) .221 expressing endogenous HLA-E*01:01 (shown in Fig. 2b). b, Absence of a correlation between HLA-E expression level on VL9-pulsed (100uM) .221 cells (shown in Fig. 1a) and Jurkat reporter cell activity against these cells (shown in Fig. 2b). Peptides are labeled with representative SPs. c, Correlations between Jurkat reporter cell activity against VL9-pulsed (100uM) .221 cells and KD values for HLA-E*01:03/VL9 binding to CD94/NKG2 determined by SPR analysis (Supplementary Table 1). a-c, R2 was determined by Spearman correlation analysis and is shown with a two-tailed P value.
Extended Data Fig. 6 |. Increase of HLA-E surface expression on monocyte-derived macrophages and enhanced JurkatNKG2A activity against these cells after IFN-γ treatment.
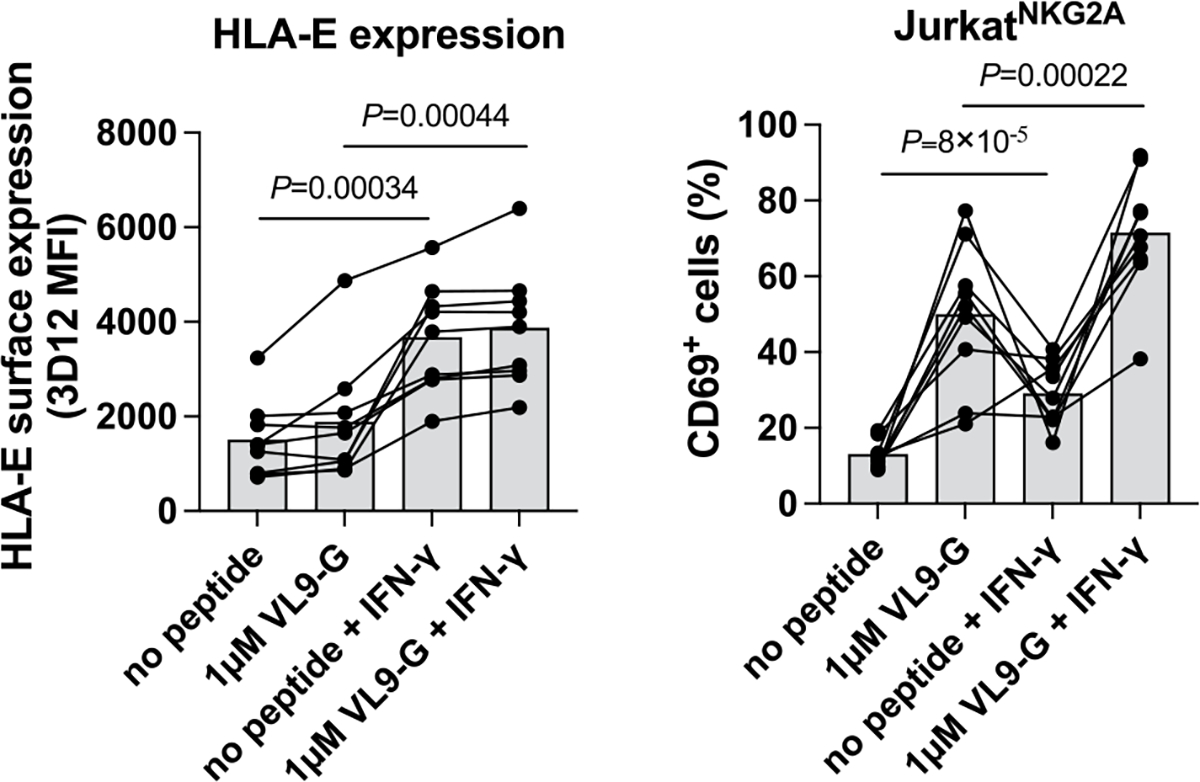
Monocytes were isolated from nine healthy donors and differentiated to monocyte-derived macrophages that were exposed to IFN-γ overnight (both unpulsed and VL9G-pulsed). Peptide pulsing was performed at 37°C for one hour prior to co-culture with reporter cells. P values for comparison between IFN-γ-treated and untreated cells were determined by a two-sided paired t-test.
Extended Data Fig. 7 |. Influence of valine at P7 of VL96B on CD94/NKG2A recognition.
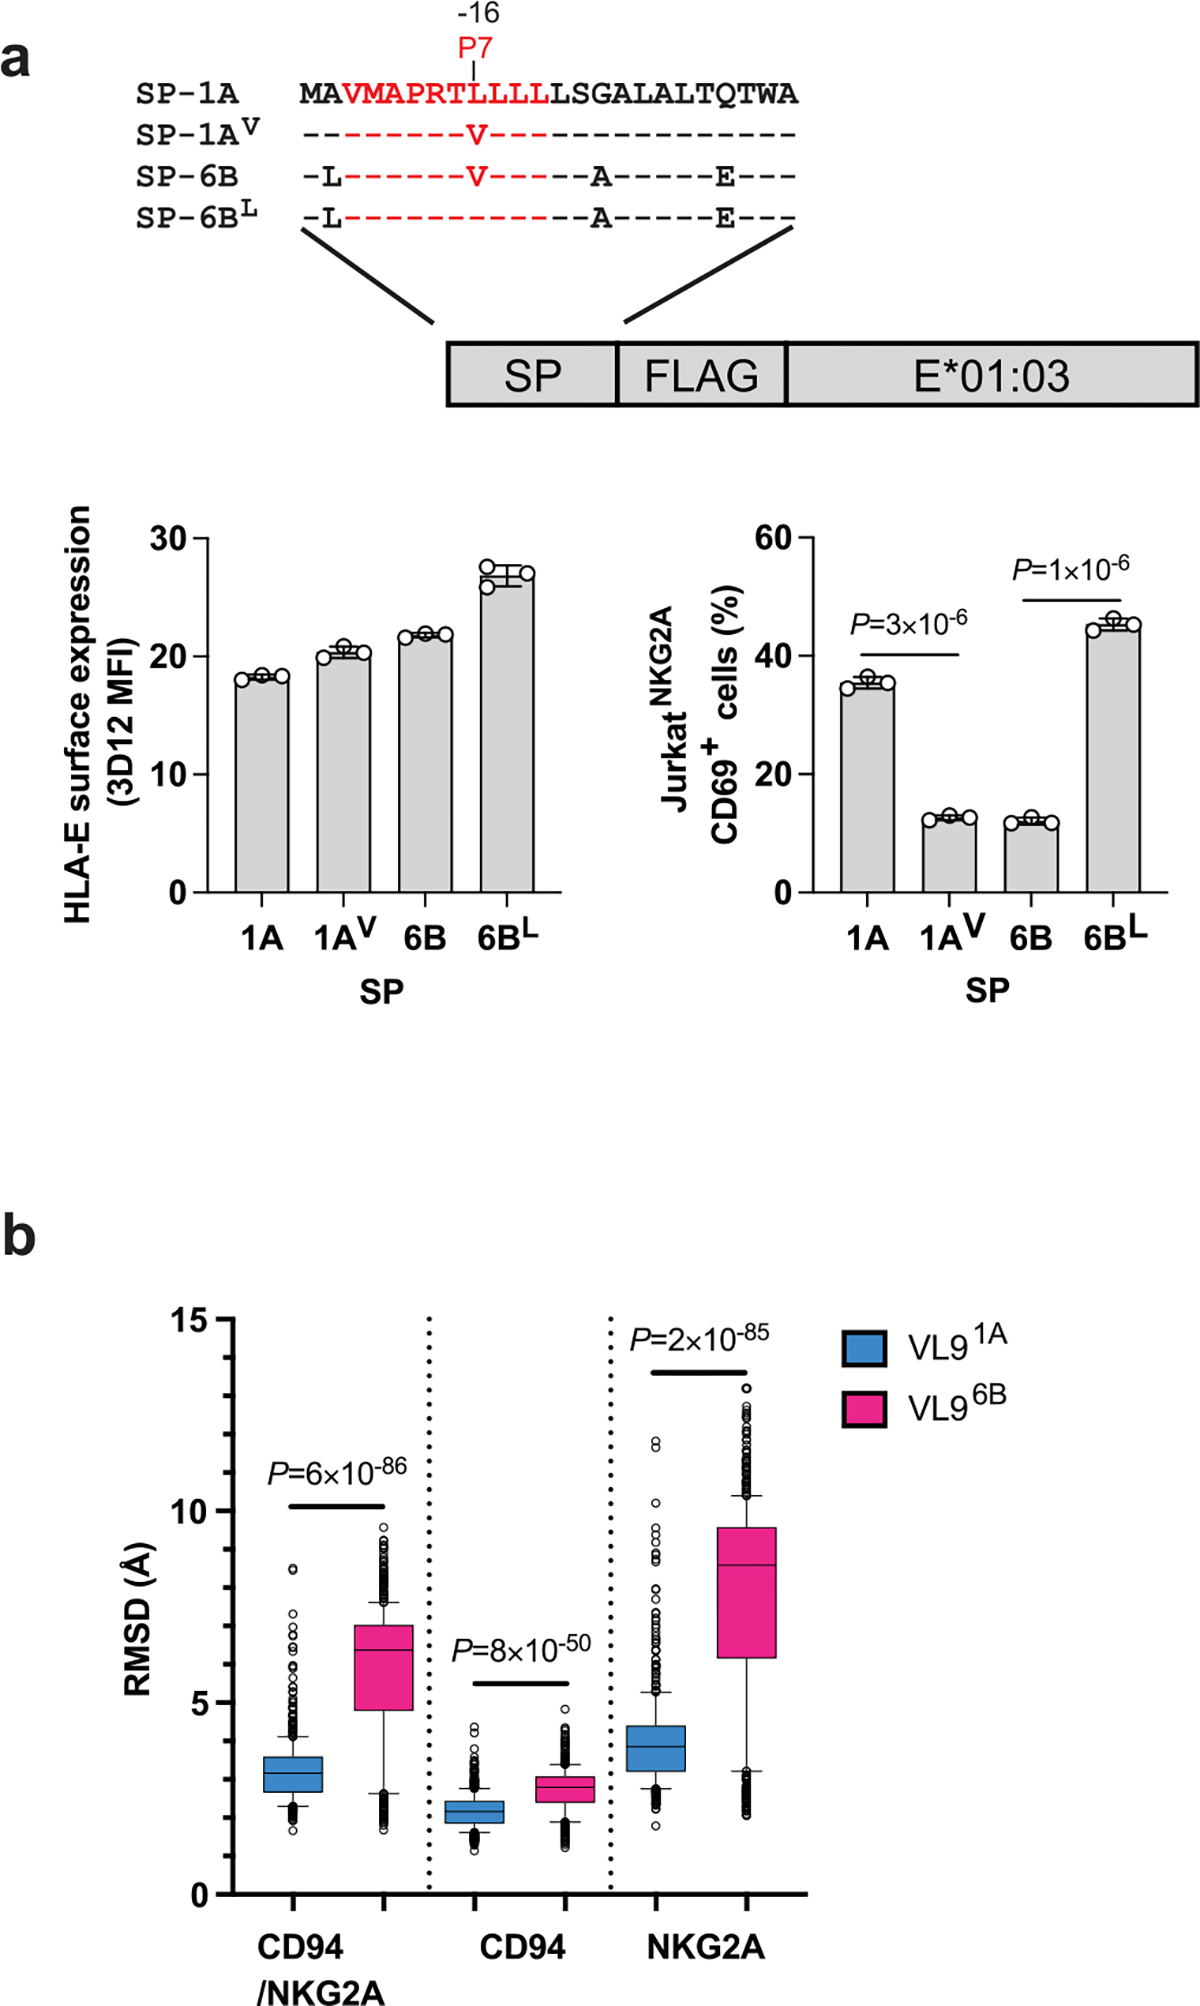
a, Mutation analysis of P7 using JurkatNKG2A reporter cell response to .221-SPE*01:03 cells. Schematic representation of hybrid swap constructs transduced into .221 cells is shown on top. HLA-E expression level on .221-SPE*01:03 cells expressing wild-type (1A, 6B) and mutant (1AV, 6BL) SPs, and JurkatNKG2A activity against these cells are shown below. Data represent triplicate experiments. Error bars represent the mean ± SD. P values for comparisons between wild type and mutant SPs were determined by a two-sided unpaired t-test. b, Molecular dynamics simulation analysis of CD94/NKG2A–HLA-E*01:03 complexes in the presence of VL91A and VL96B peptides. Box plots show the root-mean-square deviations (RMSDs) of the full receptor, CD94, or NKG2A depending on the presence of the two distinct VL9 peptides in the binding groove during a 5 μs simulation (n = 500). Box boundaries span the 25–75 percentiles with the median marked in the middle; the whiskers extend to 10 and 90 percentiles, and the remaining data points are shown as gray circles. The RMSD box plots demonstrate higher receptor motions in VL96B-loaded complexes P values for comparisons between VL91A and VL96B were determined by a two-sided Mann-Whitney test.
Extended Data Fig. 8 |. NKG2A surface expression levels on different effector cells.
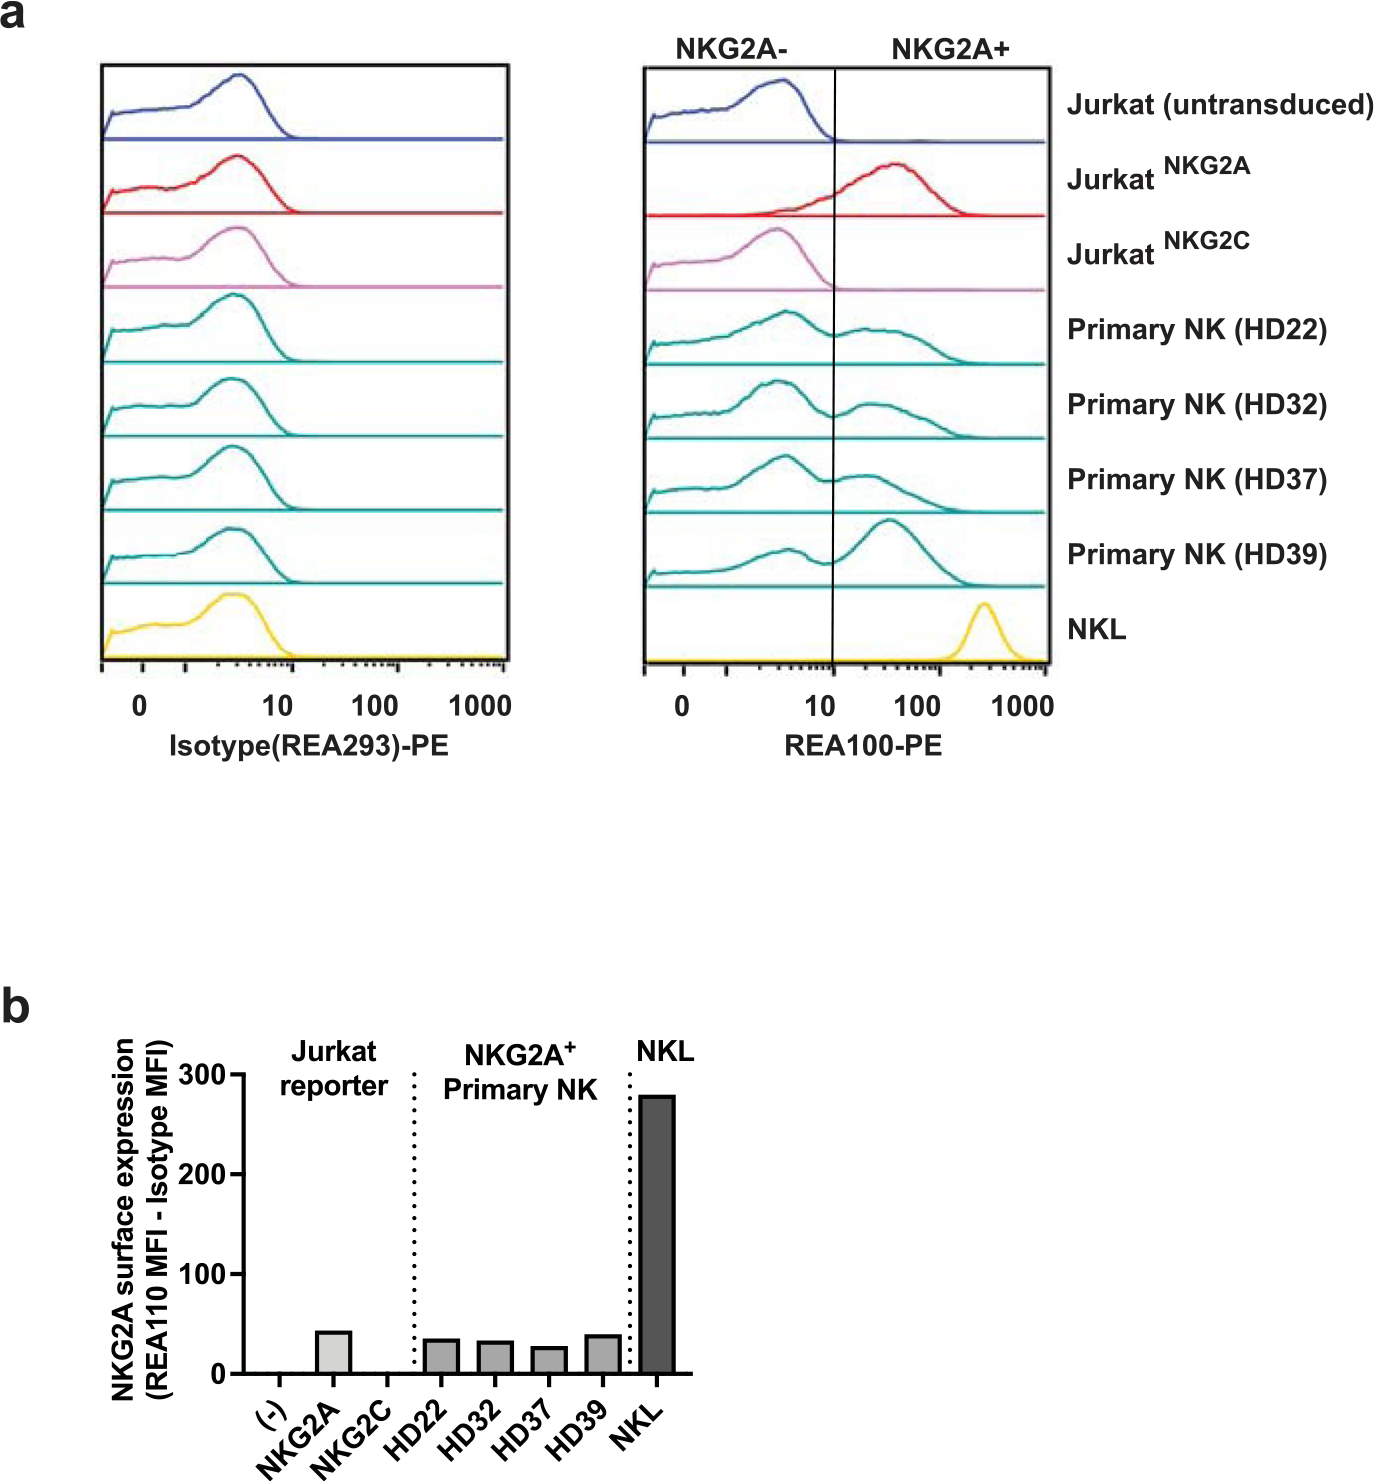
Jurkat reporter cells, primary NK cells from four healthy donors (HD), and NKL cells were stained with anti-NKG2A antibody (clone REA110). Flow cytometry histograms are shown on top, and graphical representation of the corresponding MFI data is shown below. The vertical line on the REA110 histogram separates NKG2A− from NKG2A+ populations. NKG2A expression levels are determined as MFI values of NKG2A+ cells obtained by REA110 staining minus MFI values obtained by isotype control staining for each cell type. (−) represents untransduced parental Jurkat cells.
Extended Data Fig. 9 |. Distribution of specific functional SP haplotype groups present in NMDP samples.
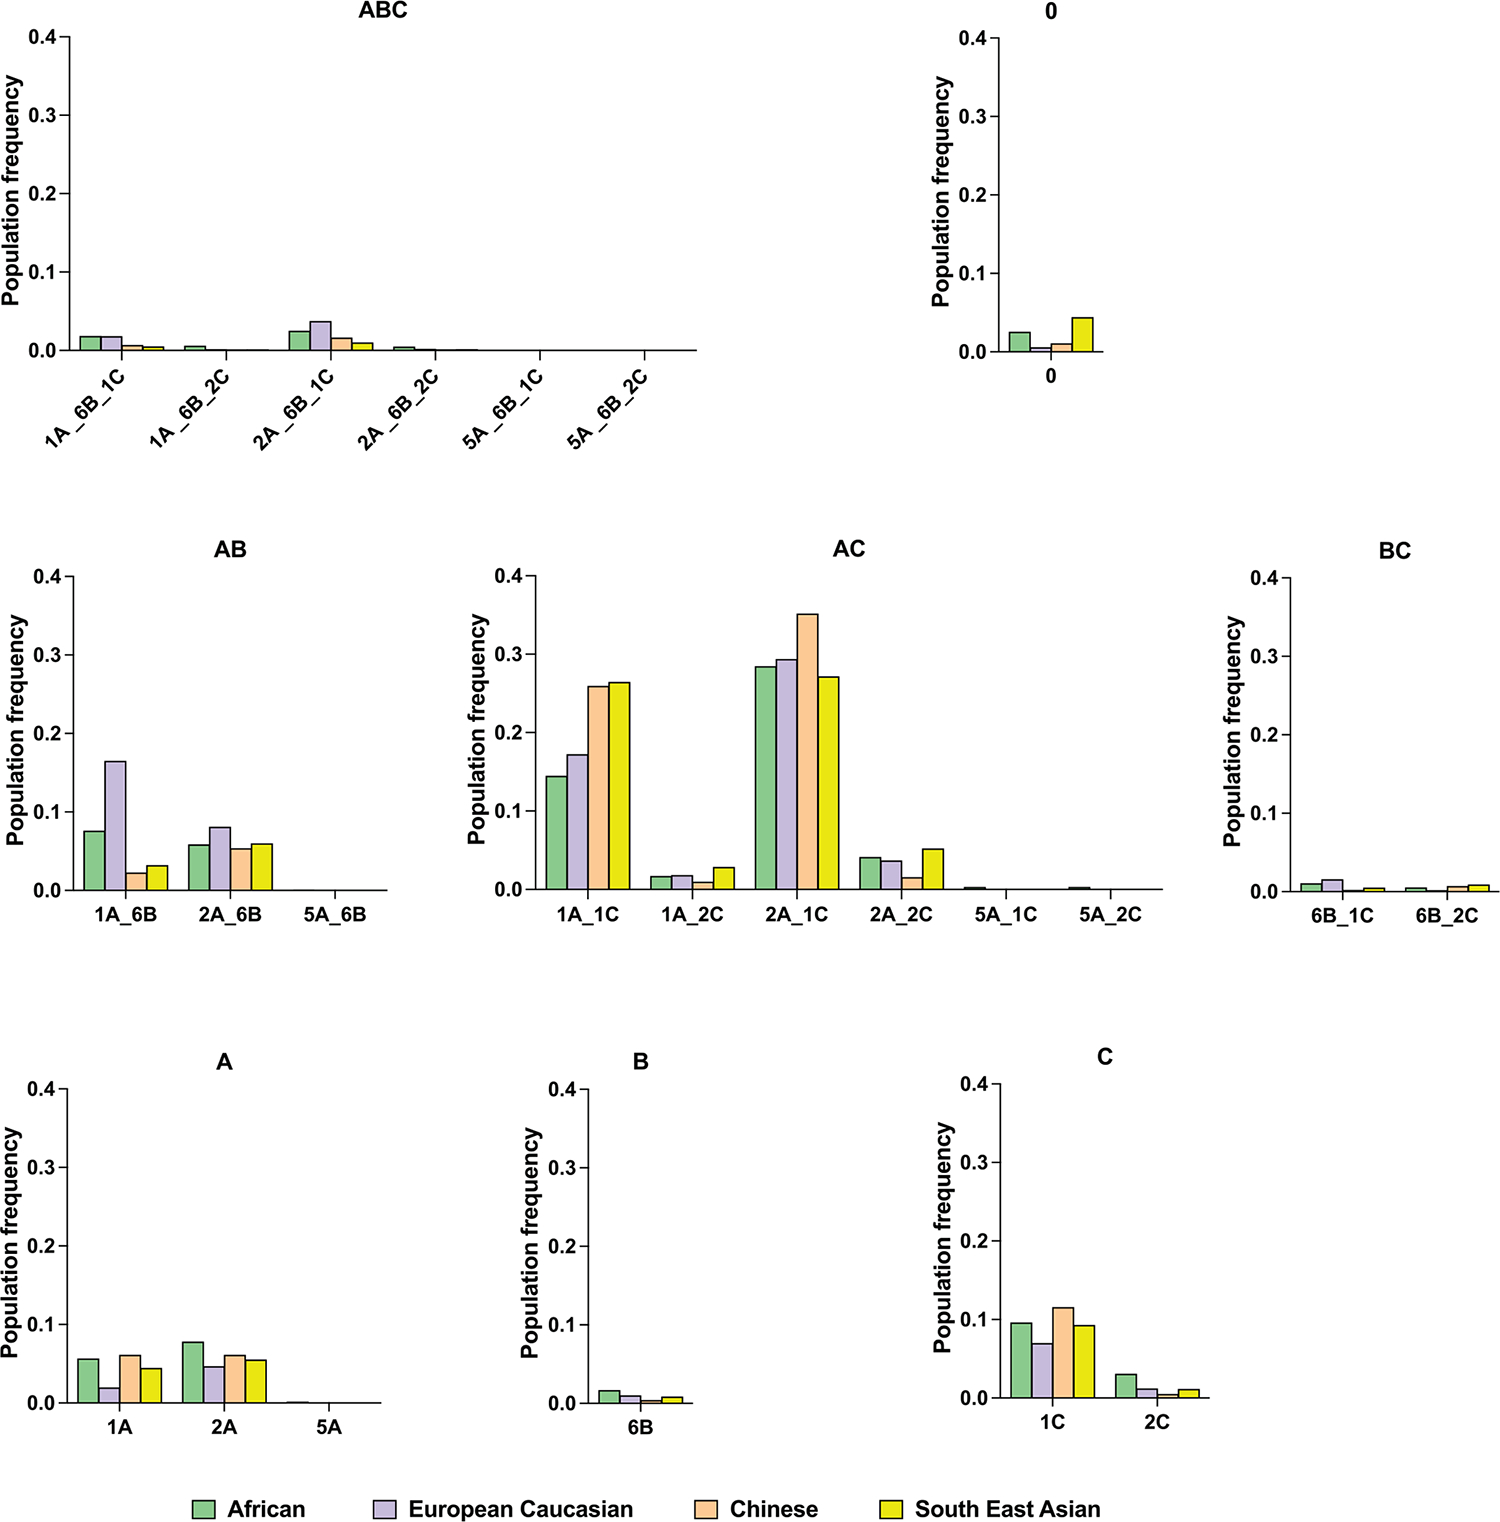
Each SP haplotype group presented in Fig. 5a (main text) was further stratified by specific SP variants encoded by HLA-A, -B, -C haplotypes. Haplotype groupings are labeled according to the encoded functional SP variants.
Extended Data Fig. 10 |. HLA-E surface expression on BLCLs and reporter cell recognition of BLCLs stratified by copy number of alleles encoding SP-1A, SP-2A, or SP-2C.
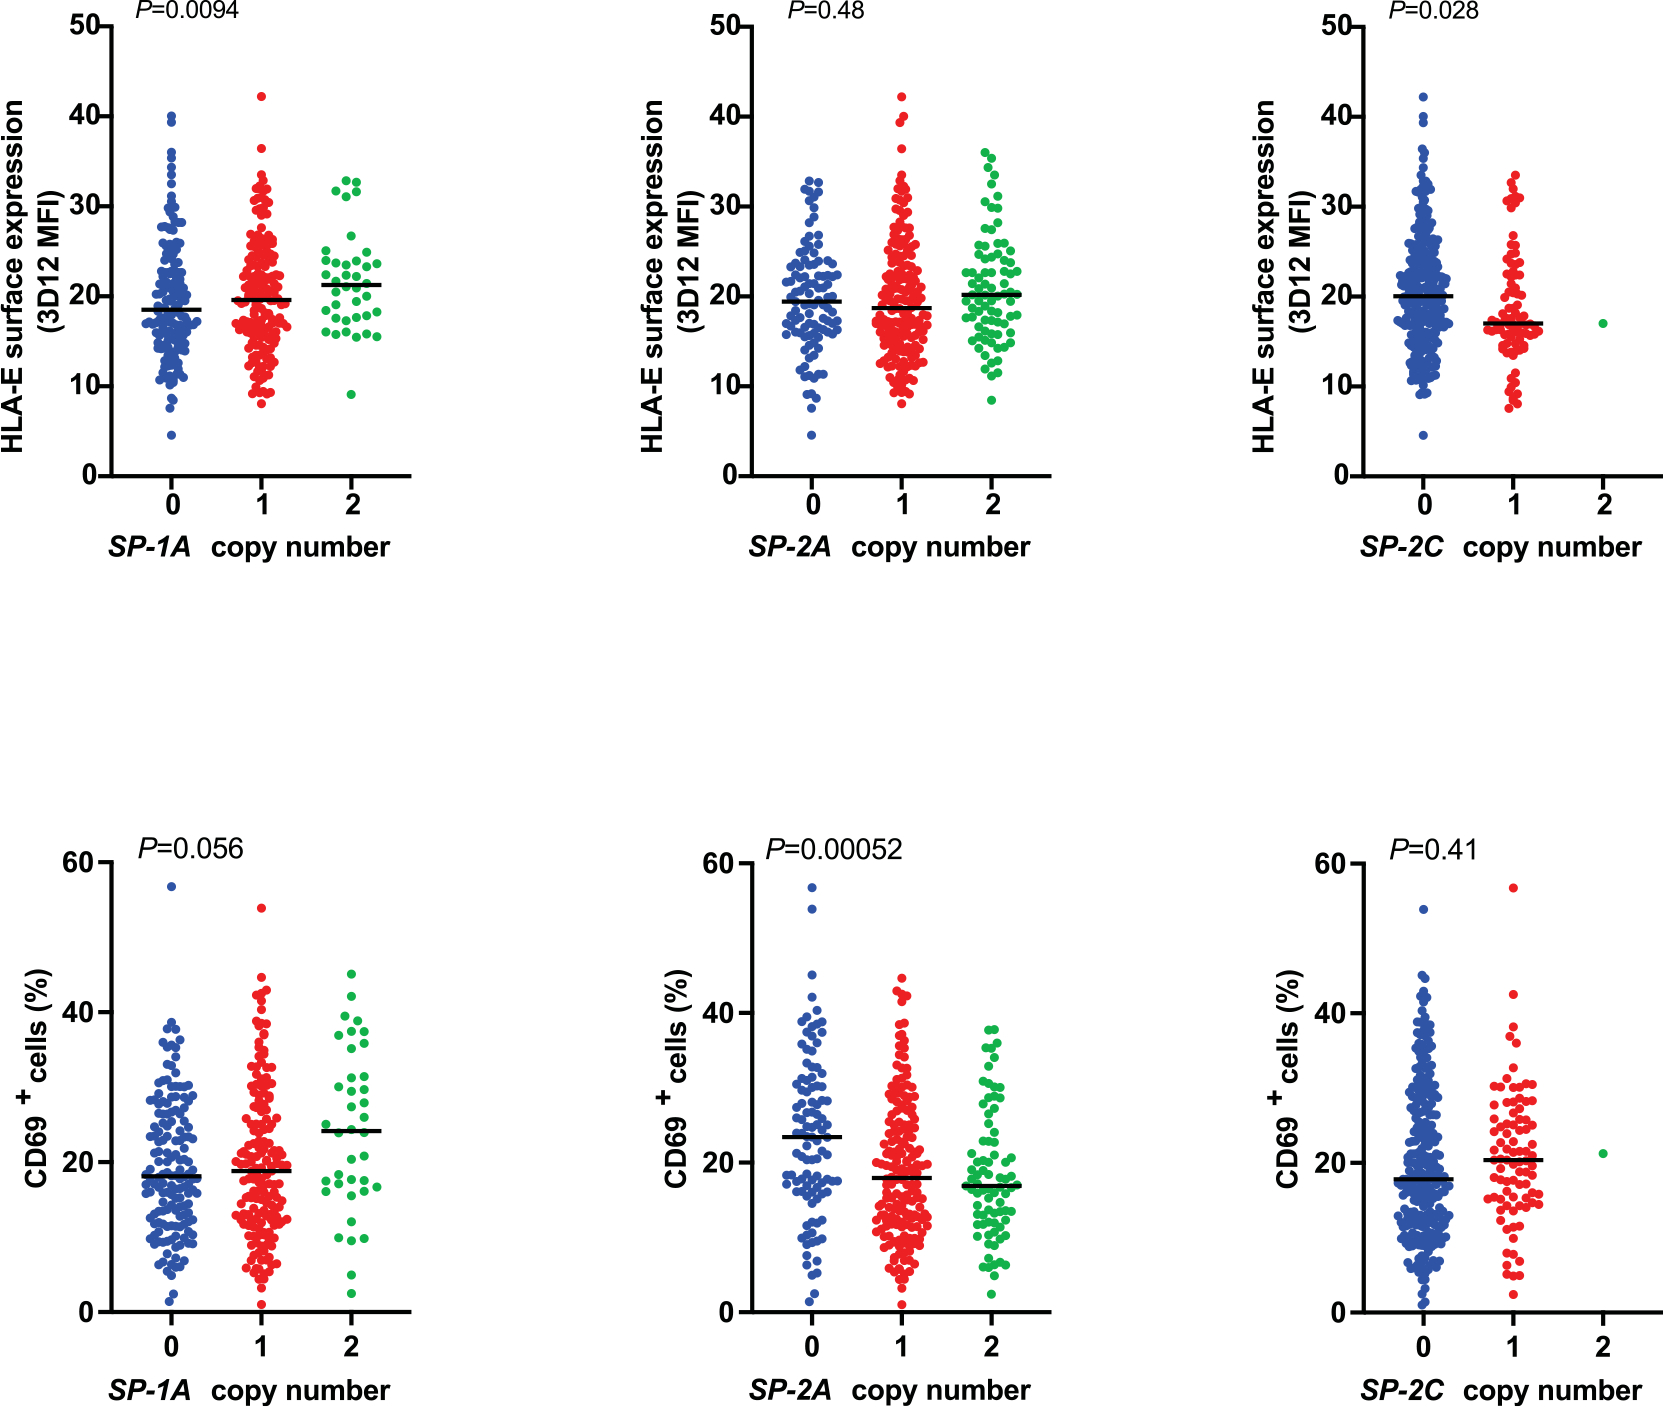
HLA-E surface expression levels on BLCLs measured by flow cytometry using 3D12 antibody is shown on top and the corresponding JurkatNKG2A reporter cell activity (% of CD69+ cells) is shown below (n = 360). Lines in each group represent the median. P values for multi-group comparisons were determined by the Kruskal-Wallis test.
Supplementary Material
Acknowledgements
We thank Q. Hammer, G. Nelson and M. P. Martin for discussions and M. Thompson for technical assistance. We also thank the NIH Blood Bank, the University Medical Center Hamburg-Eppendorf, and donors for providing blood samples. This project has been funded in whole or in part with federal funds from the Frederick National Laboratory for Cancer Research, under contract no. 75N91019D00024. The content of this publication does not necessarily reflect the views or policies of the Department of Health and Human Services, nor does mention of trade names, commercial products or organizations imply endorsement by the US Government. This research was supported in part by the Intramural Research Program of the NIH, Frederick National Laboratory, Center for Cancer Research. A. Hoelzemer and M.B. are supported by the Federal Ministry of Education and Research (01KI2110) and DZIF (German Center for Infection Research).
Footnotes
Competing interests
The authors declare no competing interests.
Reporting summary
Further information on research design is available in the Nature Portfolio Reporting Summary linked to this article.
Code availability
PyMOL script is provided in the Supplementary Information.
Extended data is available for this paper at https://doi.org/10.1038/s41590-023-01523-z.
Supplementary information The online version contains supplementary material available at https://doi.org/10.1038/s41590-023-01523-z.
Peer review information Nature Immunology thanks Peter Parham and the other, anonymous, reviewer(s) for their contribution to the peer review of this work. Peer reviewer reports are available. Primary handling editor: S. Houston, in collaboration with the Nature Immunology team.
Reprints and permissions information is available at www.nature.com/reprints.
Data availability
Publicly available HLA genetic datasets used in this study include Allele Frequency Net database (http://www.allelefrequencies.net/), IPD-IMGT/HLA database (https://www.ebi.ac.uk/ipd/imgt/hla/), NMDP Registry Haplotype Frequencies (https://frequency.nmdp.org/) and the 2014 1000 Genomes Project HLA data (https://www.internationalgenome.org/category/hla/). The structure of the human CD94/NKG2A complex with HLA-E (3CDG) was downloaded from the Protein Data Bank (https://www.rcsb.org/). Source data are provided with this paper. All other data are available within the article and Supplementary Information.
References
- 1.Quatrini L et al. Human NK cells, their receptors and function. Eur. J. Immunol. 51, 1566–1579 (2021). [DOI] [PMC free article] [PubMed] [Google Scholar]
- 2.McMahon CW & Raulet DH Expression and function of NK cell receptors in CD8+ T cells. Curr. Opin. Immunol. 13, 465–470 (2001). [DOI] [PubMed] [Google Scholar]
- 3.Borrego F, Ulbrecht M, Weiss EH, Coligan JE & Brooks AG Recognition of human histocompatibility leukocyte antigen (HLA)-E complexed with HLA class I signal sequence-derived peptides by CD94/NKG2 confers protection from natural killer cell-mediated lysis. J. Exp. Med. 187, 813–818 (1998). [DOI] [PMC free article] [PubMed] [Google Scholar]
- 4.Braud VM et al. HLA-E binds to natural killer cell receptors CD94/NKG2A, B and C. Nature 391, 795–799 (1998). [DOI] [PubMed] [Google Scholar]
- 5.Lee N et al. HLA-E is a major ligand for the natural killer inhibitory receptor CD94/NKG2A. Proc. Natl Acad. Sci. USA 95, 5199–5204 (1998). [DOI] [PMC free article] [PubMed] [Google Scholar]
- 6.Andre P et al. Anti-NKG2A mAb is a checkpoint inhibitor that promotes anti-tumor immunity by unleashing both T and NK cells. Cell 175, 1731–1743 (2018). [DOI] [PMC free article] [PubMed] [Google Scholar]
- 7.Vales-Gomez M, Reyburn HT, Erskine RA, Lopez-Botet M & Strominger JL Kinetics and peptide dependency of the binding of the inhibitory NK receptor CD94/NKG2-A and the activating receptor CD94/NKG2-C to HLA-E. EMBO J. 18, 4250–4260 (1999). [DOI] [PMC free article] [PubMed] [Google Scholar]
- 8.Tomasec P et al. Surface expression of HLA-E, an inhibitor of natural killer cells, enhanced by human cytomegalovirus gpUL40. Science 287, 1031 (2000). [DOI] [PubMed] [Google Scholar]
- 9.Orr MT & Lanier LL Natural killer cell education and tolerance. Cell 142, 847–856 (2010). [DOI] [PMC free article] [PubMed] [Google Scholar]
- 10.Strong RK et al. HLA-E allelic variants. Correlating differential expression, peptide affinities, crystal structures, and thermal stabilities. J. Biol. Chem. 278, 5082–5090 (2003). [DOI] [PubMed] [Google Scholar]
- 11.Lee N, Goodlett DR, Ishitani A, Marquardt H & Geraghty DE HLA-E surface expression depends on binding of TAP-dependent peptides derived from certain HLA class I signal sequences. J. Immunol. 160, 4951–4960 (1998). [PubMed] [Google Scholar]
- 12.Bland FA, Lemberg MK, McMichael AJ, Martoglio B & Braud VM Requirement of the proteasome for the trimming of signal peptide-derived epitopes presented by the nonclassical major histocompatibility complex class I molecule HLA-E. J. Biol. Chem. 278, 33747–33752 (2003). [DOI] [PubMed] [Google Scholar]
- 13.Llano M et al. HLA-E-bound peptides influence recognition by inhibitory and triggering CD94/NKG2 receptors: preferential response to an HLA-G-derived nonamer. Eur. J. Immunol. 28, 2854–2863 (1998). [DOI] [PubMed] [Google Scholar]
- 14.Miller JD et al. Analysis of HLA-E peptide-binding specificity and contact residues in bound peptide required for recognition by CD94/NKG2. J. Immunol. 171, 1369–1375 (2003). [DOI] [PubMed] [Google Scholar]
- 15.Kaiser BK et al. Interactions between NKG2x immunoreceptors and HLA-E ligands display overlapping affinities and thermodynamics. J. Immunol. 174, 2878–2884 (2005). [DOI] [PubMed] [Google Scholar]
- 16.Sullivan LC et al. The heterodimeric assembly of the CD94-NKG2 receptor family and implications for human leukocyte antigen-E recognition. Immunity 27, 900–911 (2007). [DOI] [PubMed] [Google Scholar]
- 17.Hammer Q et al. Peptide-specific recognition of human cytomegalovirus strains controls adaptive natural killer cells. Nat. Immunol. 19, 453–463 (2018). [DOI] [PubMed] [Google Scholar]
- 18.Walters LC, McMichael AJ & Gillespie GM Detailed and atypical HLA-E peptide binding motifs revealed by a novel peptide exchange binding assay. Eur. J. Immunol. 50, 2075–2091 (2020). [DOI] [PubMed] [Google Scholar]
- 19.Walters LC et al. Primary and secondary functions of HLA-E are determined by stability and conformation of the peptide-bound complexes. Cell Rep. 39, 110959 (2022). [DOI] [PMC free article] [PubMed] [Google Scholar]
- 20.Gustafson KS & Ginder GD Interferon-gamma induction of the human leukocyte antigen-E gene is mediated through binding of a complex containing STAT1α to a distinct interferon-γ-responsive element. J. Biol. Chem. 271, 20035–20046 (1996). [DOI] [PubMed] [Google Scholar]
- 21.Garcia-Beltran WF et al. Open conformers of HLA-F are high-affinity ligands of the activating NK cell receptor KIR3DS1. Nat. Immunol. 17, 1067–1074 (2016). [DOI] [PMC free article] [PubMed] [Google Scholar]
- 22.Petrie EJ et al. CD94-NKG2A recognition of human leukocyte antigen (HLA)-E bound to an HLA class I leader sequence. J. Exp. Med. 205, 725–735 (2008). [DOI] [PMC free article] [PubMed] [Google Scholar]
- 23.Lopez-Botet M, De Maria A, Muntasell A, Della Chiesa M & Vilches C Adaptive NK cell response to human cytomegalovirus: facts and open issues. Semin. Immunol. 65, 101706 (2023). [DOI] [PubMed] [Google Scholar]
- 24.Robertson MJ et al. Characterization of a cell line, NKL, derived from an aggressive human natural killer cell leukemia. Exp. Hematol. 24, 406–415 (1996). [PubMed] [Google Scholar]
- 25.Gragert L, Madbouly A, Freeman J & Maiers M Six-locus high resolution HLA haplotype frequencies derived from mixed-resolution DNA typing for the entire US donor registry. Hum. Immunol. 74, 1313–1320 (2013). [DOI] [PubMed] [Google Scholar]
- 26.Gourraud PA et al. HLA diversity in the 1000 Genomes dataset. PLoS ONE 9, e97282 (2014). [DOI] [PMC free article] [PubMed] [Google Scholar]
- 27.Pietra G et al. HLA-E-restricted recognition of cytomegalovirus-derived peptides by human CD8+ cytolytic T lymphocytes. Proc. Natl Acad. Sci. USA 100, 10896–10901 (2003). [DOI] [PMC free article] [PubMed] [Google Scholar]
- 28.Bjorkstrom NK, Strunz B & Ljunggren HG Natural killer cells in antiviral immunity. Nat. Rev. Immunol. 22, 112–123 (2022). [DOI] [PMC free article] [PubMed] [Google Scholar]
- 29.Barber C et al. Structure-guided stabilization of pathogen-derived peptide-HLA-E complexes using non-natural amino acids conserves native TCR recognition. Eur. J. Immunol. 52, 618–632 (2022). [DOI] [PMC free article] [PubMed] [Google Scholar]
- 30.Horowitz A et al. Class I HLA haplotypes form two schools that educate NK cells in different ways. Sci. Immunol. 1, eaag1672 (2016). [DOI] [PMC free article] [PubMed] [Google Scholar]
- 31.Hallner A et al. The HLA-B −21 dimorphism impacts on NK cell education and clinical outcome of immunotherapy in acute myeloid leukemia. Blood 133, 1479–1488 (2019). [DOI] [PMC free article] [PubMed] [Google Scholar]
- 32.Merino AM et al. HLA-B signal peptide polymorphism influences the rate of HIV-1 acquisition but not viral load. J. Infect. Dis. 205, 1797–1805 (2012). [DOI] [PMC free article] [PubMed] [Google Scholar]
- 33.Ramsuran V et al. Elevated HLA-A expression impairs HIV control through inhibition of NKG2A-expressing cells. Science 359, 86–90 (2018). [DOI] [PMC free article] [PubMed] [Google Scholar]
- 34.Petersdorf EW et al. Role of HLA-B exon 1 in graft-versus-host disease after unrelated haemopoietic cell transplantation: a retrospective cohort study. Lancet Haematol. 7, e50–e60 (2020). [DOI] [PMC free article] [PubMed] [Google Scholar]
- 35.van Hall T et al. Monalizumab: inhibiting the novel immune checkpoint NKG2A. J. Immunother. Cancer 7, 263 (2019). [DOI] [PMC free article] [PubMed] [Google Scholar]
- 36.Martin-Villa JM et al. HLA-G: too much or too little? Role in cancer and autoimmune disease. Front. Immunol. 13, 796054 (2022). [DOI] [PMC free article] [PubMed] [Google Scholar]
- 37.Battin C et al. NKG2A-checkpoint inhibition and its blockade critically depends on peptides presented by its ligand HLA-E. Immunology 166, 507–521 (2022). [DOI] [PMC free article] [PubMed] [Google Scholar]
- 38.Bansal A et al. HLA-E-restricted HIV-1-specific CD8+ T cell responses in natural infection. J. Clin. Investig. 131, e148979 (2021). [DOI] [PMC free article] [PubMed] [Google Scholar]
- 39.Verweij MC et al. Modulation of MHC-E transport by viral decoy ligands is required for RhCMV/SIV vaccine efficacy. Science 372, eabe9233 (2021). [DOI] [PMC free article] [PubMed] [Google Scholar]
- 40.Hansen SG et al. Broadly targeted CD8+ T cell responses restricted by major histocompatibility complex E. Science 351, 714–720 (2016). [DOI] [PMC free article] [PubMed] [Google Scholar]
References
- 41.Partridge T et al. Discrimination between human leukocyte antigen class I-bound and co-purified HIV-derived peptides in immunopeptidomics workflows. Front. Immunol. 9, 912 (2018). [DOI] [PMC free article] [PubMed] [Google Scholar]
- 42.Shimizu Y & DeMars R Production of human cells expressing individual transferred HLA-A,-B,-C genes using an HLA-A,-B,-C null human cell line. J. Immunol. 142, 3320–3328 (1989). [PubMed] [Google Scholar]
- 43.Kaiser BK, Pizarro JC, Kerns J & Strong RK Structural basis for NKG2A/CD94 recognition of HLA-E. Proc. Natl Acad. Sci. USA 105, 6696–6701 (2008). [DOI] [PMC free article] [PubMed] [Google Scholar]
- 44.Case DA et al. Amber 2022 (University of California, 2022). [Google Scholar]
- 45.Tian C et al. ff19SB: amino-acid-specific protein backbone parameters trained against quantum mechanics energy surfaces in solution. J. Chem. Theory Comput. 16, 528–552 (2020). [DOI] [PubMed] [Google Scholar]
- 46.Izadi S, Anandakrishnan R & Onufriev AV Building water models: a different approach. J. Phys. Chem. Lett. 5, 3863–3871 (2014). [DOI] [PMC free article] [PubMed] [Google Scholar]
- 47.MacLean B et al. Skyline: an open source document editor for creating and analyzing targeted proteomics experiments. Bioinformatics 26, 966–968 (2010). [DOI] [PMC free article] [PubMed] [Google Scholar]
Associated Data
This section collects any data citations, data availability statements, or supplementary materials included in this article.
Supplementary Materials
Data Availability Statement
Publicly available HLA genetic datasets used in this study include Allele Frequency Net database (http://www.allelefrequencies.net/), IPD-IMGT/HLA database (https://www.ebi.ac.uk/ipd/imgt/hla/), NMDP Registry Haplotype Frequencies (https://frequency.nmdp.org/) and the 2014 1000 Genomes Project HLA data (https://www.internationalgenome.org/category/hla/). The structure of the human CD94/NKG2A complex with HLA-E (3CDG) was downloaded from the Protein Data Bank (https://www.rcsb.org/). Source data are provided with this paper. All other data are available within the article and Supplementary Information.


