

Abstract
Objective
Differentiating status epilepticus (SE) from prolonged psychogenic nonepileptic seizures (pPNES) can be difficult clinically. We aimed to define the utility of peripheral cell counts, cell ratios, and lactate levels in distinguishing SE from pPNES.
Methods
Retrospective two‐center study investigating the sensitivity and specificity of acute (≤12 h of event offset) peripheral cell counts, cell ratios (neutrophil–lymphocyte ratio, neutrophil–monocyte ratio, monocyte–lymphocyte ratio, platelet–lymphocyte ratio, systemic immune‐inflammatory index [SII], systemic inflammatory response index [SIRI]), and lactate levels in differentiating SE from pPNES. Patients were identified from two tertiary hospitals, with one forming the development cohort and the other the validation cohort. Using generalized additive models to generate biomarker vs time curves, optimal blood collection times were defined for set parameters. Three diagnostic scores combining neutrophil count, SII, or SIRI with lactate levels were developed and validated in separate cohorts.
Results
For the development cohort, 1262 seizure‐like events were reviewed and 79 SE and 44 pPNES events were included. For the validation cohort, 241 events were reviewed and 20 SE and 11 pPNES events were included. Individually, the biomarkers generally had low sensitivity and reasonable specificity for differentiating SE from pPNES, with the neutrophil count, SIRI, and SII performing best with sensitivities of 0.65–0.84, specificities of 0.64–0.89, and ROC AUCs of 0.78–0.79. Lactate levels peaked at 60 min, while cell counts and ratios peaked after 240 min. Combining early peaking lactate levels and later peaking neutrophil count, SIRI or SII resulted in three scores that improved predictive potential with sensitivities of between 0.75 and 0.79, specificities between 0.93 and 1.00, and ROC AUCs of 0.89–0.91.
Significance
Lactate levels peak early post‐SE, whereas cell counts and ratios do so later. The differing post‐event time profiles of lactate levels vs neutrophil count, SIRI, and SII allow incorporation into three separate scores which can assist in differentiating SE from pPNES.
Keywords: lactate, lymphocyte, monocyte, neutrophil, PNES, seizures
Key Points.
Distinguishing status epilepticus (SE) from prolonged psychogenic nonepileptic seizures (pPNES) can be difficult clinically and easily accessible biomarkers are needed.
Peripheral cell counts, cell ratios, and lactate levels have low sensitivity and better specificity for differentiating SE events from pPNES.
Lactate levels can differentiate SE from pPNES out to 150 min postonset of event.
Cell counts and cell ratios can differentiate the SE from PNES out to 540 min.
Combined scores utilizing both lactate and neutrophil count SII or SIRI had sensitivities of 0.75–0.79 and specificities between 0.93 and 1.00 for the diagnosis of SE.
1. INTRODUCTION
Psychogenic nonepileptic seizures (PNES) are a common source of epilepsy misdiagnosis 1 , 2 , 3 , 4 and the rate of misdiagnosis may be higher in those with prolonged “status epilepticus‐like” events. 5 , 6 Conversely, incorrectly diagnosing epileptic seizures as nonictal phenomena can also occur; one study in a neurological ICU setting, demonstrated a 15.6% rate of misdiagnosis of seizures as nonictal phenomena. 3 Misdiagnosis often results in inappropriate treatment which can have serious risks for patients. Inadequately treated epileptic seizures can lead to an increased risk of injury and death. 7 Similarly, misidentification of PNES can lead to inappropriate interventions (e.g., intubation, ventilation), 8 , 9 medical therapies (e.g., antiseizure medications), 10 and activity restrictions (e.g., driving) with detrimental consequences encompassing the physical, psychological, and social domains. 1 , 11
While video electroencephalography (EEG) is currently the gold standard for diagnosis of seizure‐like events, it is resource intensive and not promptly accessible in an emergency setting. A readily accessible diagnostic biomarker is needed in this setting. Peripheral cell counts, cell ratios, and lactate levels may fulfill this role. Cell count changes can be caused by increased production by the bone marrow or demargination of cells predominantly from vessel walls into the circulation. 12 Demargination can occur in the context of raised catecholamine levels as seen during epileptic seizures 13 and is likely the main mechanism at play. Various permutations of cell ratios exist, but there is limited data on their ability to differentiate between epileptic seizures and PNES. Three studies comparing neutrophil‐lymphocyte ratios (NLR) between epileptic seizures and either healthy controls (HC) or PNES have had mixed results, 14 , 15 , 16 possibly due to differences in the timing of post‐event blood collection. There is no literature regarding the utility of other cell ratios, such as neutrophil‐monocyte ratio (NMR), monocyte‐lymphocyte ratio (MLR), systemic immune‐inflammatory index (SII), 17 and systemic inflammatory response index (SIRI 18 ), in this context. Elevation in SII and SIRI scores have been seen in various neurological diseases (e.g., multiple sclerosis, stroke, spinocerebellar ataxia) and correlate with disease severity and prognosis. 19 , 20 , 21 Lactate levels increase during periods of anaerobic respiration and have been shown to be elevated acutely during epileptic seizures. When measured within 2 h of an event, serum lactate levels differentiate generalized tonic–clonic seizures from seizure mimics such as syncope and PNES, with a sensitivity of 74%–94% and specificity of 88%–93%. 22 , 23 , 24 , 25 , 26 Although the sensitivity and specificity of lactate likely fall with time, being lower in a study where the time of collection was undefined, 5 the optimal timing for testing is unknown. We hypothesize that there will be increased physical stress from status epilepticus (SE) compared with prolonged PNES (pPNES). Consequently, cell counts, cell ratios, and lactate will be different between the two groups and may aid clinical diagnosis.
The primary aim of this study was to investigate the utility of postevent peripheral cell counts in differentiating SE from pPNES. Secondary aims were to (1) determine the optimal timing for blood sample collection, (2) define whether blood lactate levels can differentiate between SE and pPNES, (3) develop and validate a diagnostic score combining cell counts or ratios and blood lactate levels that can be utilized in an emergency setting to differentiate SE from pPNES.
2. MATERIALS AND METHODS
2.1. Study design, setting, and patients
This was a retrospective case–control study. We identified two cohorts to develop a diagnostic score in one cohort (“development cohort”) and validate it in a separate cohort (“validation cohort”). For the development cohort, patients presenting to a single tertiary hospital (Alfred Hospital, Australia) between May 2019 and May 2020 were captured by a medical records search using International Classification of Disease (ICD‐10) codes (Table S1). Additional patients were identified by reviewing continuous EEG monitoring reports and recordings between September 2018 and January 2021. Patients for the validation cohort were identified from presentations to a second tertiary hospital (Royal Melbourne Hospital, Australia) between November 2019 and June 2022 using the same strategy as above.
Patients with either SE or pPNES were included if they had a peripheral cell count performed during or within 12 h of offset of the event (“acute” cell count).
SE was defined as per the ILAE 2015 definition for timepoint 1 27 (tonic–clonic seizure lasting over 5 min or absence/focal seizure lasting over 10 min) or where multiple epileptic seizures occurred over a period of at least 30 min without return to baseline between events.
PNES was defined as any event that resembled an epileptic seizure in terms of its episodic motor and/or behavioral manifestations but had features on examination or investigations that supported a psychological origin. 28 Prolonged PNES events had to meet the same timepoint criteria as SE.
Where time of onset was not documented, documented time of call to the ambulance service or time of self‐presentation to the emergency department was used. For SE events with no clear clinical onset that were discovered on EEG, onset time was taken as the first definite ictal EEG change. For pPNES events discovered on EEG, onset was taken as the time of first clinical manifestation seen on video recording.
Where offset time was not documented, time was taken as one of the (1) last known witnessed clinical seizure/seizure‐like activity, (2) duration of seizure activity added on to onset time, (3) last definite ictal EEG change (for SE events) or last clinical manifestation seen on video (for pPNES events) on EEG monitoring.
Patients were excluded if they had comorbidities or treatments that would be expected to significantly alter peripheral cell counts (Figure 1).
FIGURE 1.
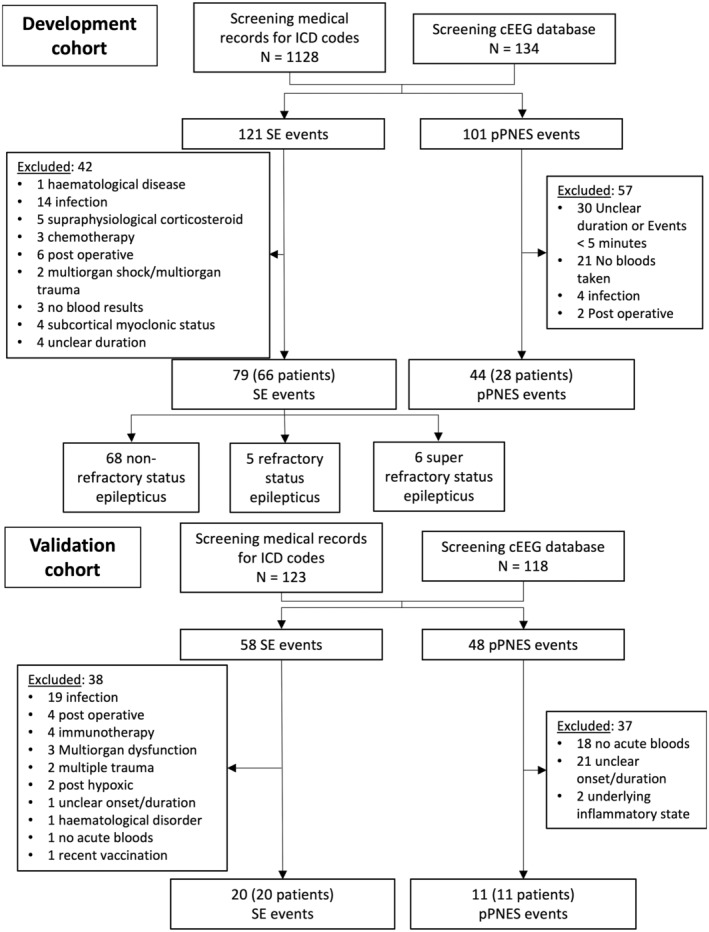
Study flowchart. Refractory status epilepticus is defined as ongoing seizure activity despite the use of two intravenous antiseizure medications, one of which was from a nonbenzodiazepine class. Super‐refractory SE is defined as ongoing seizure activity lasting over 24 h despite the use of an anesthetic agent or recurrence of seizures following weaning of anesthetic agent after over 24 h of use. pPNES, prolonged psychogenic nonepileptic seizures; SE, status epilepticus.
2.2. Data acquisition
Following a comprehensive review of the medical records, events of SE or pPNES were identified by an epilepsy fellow (T.T.). For the development arm, events that did not occur during video‐EEG monitoring (98 of 123 events) were independently reviewed by a senior neurology registrar (B.C.). Diagnosis was based on a combination of clinical information and paraclinical results (e.g., EEG, MRI) without reference to cell count and lactate levels. The concordance rate between the two examiners was 99%. One classification disagreement was resolved at a case conference with two senior epileptologists (T.O. and P.K.). The sample size was determined by data availability.
Data were also collected on patient demographics, medical history, medications, radiological and EEG findings, and outcome measures such as modified Rankin Score (mRS; a score of 0–6), 29 , 30 , 31 , 32 , 33 length of stay, and intensive care unit (ICU) admission. Each event was analyzed for time of onset and offset, duration, motor or nonmotor features and for SE events, etiology, and severity.
Acute blood neutrophil, monocyte, lymphocyte, and platelet counts were recorded (cells/μL).
Peripheral cell ratios were calculated by dividing the absolute cell count of the first named cell by that of the second named cell in the pair to obtain NLR, MLR, NMR, and platelet‐lymphocyte ratio (PLR). For example, NLR = neutrophil count/lymphocyte count. SII 17 was calculated as follows: SII = (neutrophil count × platelet count)/lymphocyte count. SIRI 18 was calculated as follows: (neutrophil count × monocyte count)/lymphocyte count. The term “cell ratio” was used to designate NLR, MLR, NMR, PLR, SII, and SIRI as a group.
Venous or arterial blood lactate levels (mmol/L) were recorded if they were obtained within 30 min of peripheral cell counts.
2.3. Standard protocol approvals, registrations, and patient consent
This study was approved by the Human Research Ethics Committee of Alfred Health and Melbourne Health (project numbers: 155/20 and QA2021120, respectively).
2.4. Statistical analysis
Patient‐level clinical and demographic data were analyzed using GraphPad Prism (Version 9.0.1). For patients with multiple presentations, a mean value of the variable in question (e.g., age) was calculated and used as a summary measure. Continuous variables were assessed using parametric (t‐test) or nonparametric (Mann–Whitney test) methods, depending on distributional properties. Fisher exact test was used for dichotomous variable analysis. Results were presented as mean ± standard deviation (SD) or median and interquartile range (IQR).
All other analyses were conducted in R (v4.1.2). Linear mixed effects models were used for between‐group comparisons of various event metrics and to investigate the potential confounding effects of age, gender, preexisting epilepsy history, number of medical comorbidities (excluding epilepsy), and events with prominent motor symptoms on the association between SE or pPNES group status and cell counts, cell ratios, or lactate levels. Separate models were constructed for each cell count, cell ratio, and lactate formulated as a function of the linear combination of specified predictors. In all cases, where log‐transformations were undertaken to improve distributional properties, effect estimates were back‐transformed and displayed as ratios of geometric means and their associated 95% confidence intervals (i.e., ). All tests were two‐sided with significance set at P < 0.05.
ROC curves for the various peripheral biomarkers were generated. Optimal cutoff values with associated sensitivity and specificity (where true positive was SE correctly identified as SE) were identified by maximizing the Youden's Index.
To define optimal blood collection times, generalized additive models were fitted to each biomarker versus time data (development cohort only) using a Tweedie distribution. Separate models were constructed for each peripheral biomarker and the marginal means for each group were estimated at 30‐min intervals. Differences between groups at each 30‐min timepoint were calculated and those statistically significantly different from zero were identified. Benjamini‐Hochberg procedure was used to adjust for multiple tests.
Three different prediction models were examined with one of neutrophil count, SIRI, or SII as predictors in combination with lactate. These models were adjusted for confounders (history of prior epilepsy and presence of prominent motor features) to determine if this improved the predictive accuracy. Cell ratios without a paired lactate result were excluded from the models. Bootstrap resampling with replacement methods was used to calculate optimism‐corrected AUC (internal validation) and predicted versus observed probability (model calibration) estimates. A nomogram was constructed, whereby risk points were assigned to each predictor depending on the predictor value.
3. RESULTS
3.1. Patient population
Figure 1 details the workflow for patient inclusion in this study. In the development cohort, 79 SE events from 66 patients and 44 pPNES events from 28 patients were included for analysis. One SE patient who presented with two events of SE had a concomitant diagnosis of PNES. This patient had two distinct recognizable semiologies and only SE presentations were included for analysis as no pPNES occurred during the data collection period. Four patients with pPNES, representing 10 events, had comorbid epilepsy and all had a confirmed diagnosis of PNES with at least one typical PNES event captured during video‐EEG monitoring.
In the validation cohort, 20 SE events from 20 patients and 11 pPNES events from 11 patients were included. No patients in the validation cohort had concomitant SE and PNES.
Clinical and demographic data of the study subjects are summarized in Table 1. In general, SE patients were older and more likely to be male. A larger proportion of patients in the SE cohort had a history of epilepsy and an epileptogenic lesion on MRI or CT.
TABLE 1.
Patient demographics, clinical, and event characteristics.
| Patient characteristics | Development cohort | Validation cohort | ||||
|---|---|---|---|---|---|---|
| SE (N = 66) | pPNES (N = 28) | P value | SE (N = 20) | pPNES (N = 11) | P value | |
| Sex | ||||||
| Female, % | 36.4% | 57.1% | 0.07 | 35% | 81.8% | 0.02 |
| Male, % | 63.6% | 42.9% | 65% | 18.2% | ||
| Age, years, mean (±SD) | 58.03 (18.21) | 35.10 (16.64) | <0.001 | 57.23 (18.53) | 40.56 (15.17) | 0.02 |
| History of epilepsy, % | 51.5% | 14.3% | <0.001 | 50% | 10% a | 0.05 |
| Modified Rankin Scale score (mRS) | ||||||
| On admission, median (Q1–Q3) | 2 (0–5) | 0 (0–3) | 0.0008 | 1.5 (0–3) | 1 (0‐2) b | 0.07 |
| On discharge, median (Q1–Q3) | 3 (1–4) | 0 (0–1) | <0.001 | 4 (2–4) | 2 (2‐3) b | 0.09 |
| Δ mRS, median (Q1–Q3) | 0 (0–1) | 0 (0–0) | <0.001 | 1 (0–3) | 0 (0‐1) b | 0.43 |
| Medical comorbidities excluding epilepsy, n, median (Q1–Q3) | 3 (1–4) | 1 (0–2) | <0.001 | 2 (1–3.75) | 2 (2–4) | 0.45 |
| Psychiatric comorbidities excluding PNES, n, median (Q1–Q3) | 0 (0–1) | 1 (0–2) | 0.06 | 0 (0–1) | 1 (1–3) | <0.001 |
| MRI/CT epileptogenic lesion, n (%) | 40/64 (62.5%) | 3/22 (13.64%) | <0.001 | 16/20 (80%) | 1/10 (10%) | <0.001 |
| Event characteristics | SE (N = 79) | pPNES (N = 44) | P value | SE (N = 20) | pPNES (N = 11) | P value |
|---|---|---|---|---|---|---|
| Neurology review, % | 86.4% | 78.6% | 100% | 90.9% | ||
| EEG (any timepoint), n | 63 | 36 | 19 | 10 | ||
| Epileptic seizure (analyzed event), n (%) | 22 (34.9%) | 0 (0%) | 6 (31.6%) | 0 (0%) | ||
| Epileptic seizure on other EEG, n (%) | 6 (9.5%) | 0 (0%) | 3 (15.8%) | 0 (0%) | ||
| IED only (any timepoint), n (%) | 11 (17.5%) | 3 (8.3%) | 3 (15.8%) | 0 (0%) | ||
| PNES (analyzed event), n (%) | 0 (0%) | 5 (13.9%) | 0 (0%) | 0 (0%) | ||
| PNES on other EEG, n (%) | 0 (0%) | 23 (63.9%) | 0 (0%) | 10 (100%) | ||
| Event characteristics | ||||||
| Prominent motor symptoms | 82.3% | 86.4% | 0.56 | 100% | 72.7% | 0.04 |
| Event severity | ||||||
| Event duration, h, median (Q1‐Q3) | 1.6 (0.7–21.60)) | 1.0 (0–3.25) | 0.001 | 2.25 (0.73–41.70) | 0.5 (0.4–2.4) | 0.06 |
| ICU admission, % | 27.9% | 6.8% | 0.02 | 70% | 0% | <0.001 |
| Length of stay, days, median (Q1–Q3) | 5 (2–12) | 1 (0–3.25) | 0.001 | 10.5 (6.25–28) | 4 (1–9) | 0.04 |
| Anti‐seizure medication use | ||||||
| Admission, n, median (Q1–Q3) | 0 (0–2) | 1 (0–1) | 0.98 | 1 (0–2) | 0 (0–1) | 0.65 |
| During event, n, median (Q1–Q3) | 2 (2–4) | 0 (0–1.25) | <0.001 | 2.5 (2–4) | 1 (0–2) | 0.002 |
| Post event c , n, median (Q1–Q3) | 1 (1–3) | 0 (0–1) | <0.001 | 2 (1–3) | 0 (0–2) | 0.007 |
| ΔASM post event c , Δn, median (Q1–Q3) | 1 (0–1) | 0 (0–0) | <0.001 | 1 (0.25–2) | 0 (0–0) | 0.006 |
| Blood draw characteristics | ||||||
| Time from seizure onset to acute blood draw, mins, median (Q1–Q3) | 117 (76.5–206) | 123 (82.5–171.75) | 0.80 | 132.5 (101.3–240.8) | 122.0 (49–148) | 0.27 |
| Time from seizure offset to acute blood draw, mins, median (Q1–Q3) | 18.0 (−372.5–83.5) | 68.5 (25.0–108.5) | 0.003 | 29 (−2401–147) | 21 (−30–104) | 0.56 |
Note: P values reflect the difference between SE and pPNES arms within each cohort. Of note, in the development cohort, two pPNES patients (three episodes) with comorbid epilepsy had interictal epileptiform discharges and PNES on EEG.
Abbreviations: ASM, antiseizure medication; CT, computed tomography; EEG, electroencephalogram; ICU, intensive care unit; IED, interictal discharges; MRI, magnetic resonance imaging; pPNES, prolonged psychogenic nonepileptic seizure; Q1–Q3, interquartile range.
10 of 11 pPNES patients had the presence or absence of a prior epilepsy diagnosis documented.
7 pPNES patients had mRS data.
Postevent defined as 5 days postoffset of SE or pPNES, or at time of discharge, whichever came first.
3.2. Event characteristics
Most patients were reviewed by the local neurology team. Table 1 outlines the EEG findings in more detail.
Most events in both the SE and pPNES arms presented with prominent motor symptoms with no difference between arms in the development group; however, in the validation group, motor presentations were more common among SE patients than those with pPNES (Table 1). SE events had greater morbidity with longer durations, longer inpatient admissions, and a higher ICU admission rate. Higher mRS scores on admission and discharge in patients with SE also suggest a more medically unwell population.
Time from seizure onset to blood collection was similar between the two groups in both the development and validation arms.
3.3. Cell counts, ratios, and lactate
All events had acute cell count results. In the development arm, 42 SE and 22 pPNES events had paired lactate levels measured within 10 min of the cell counts. In the validation arm, all events had paired lactate measured within 30 min of the cell counts.
In the development arm, higher total leukocyte, neutrophil and monocyte counts, and lower lymphocyte counts were seen in the SE group. In the validation arm, only neutrophil and total leukocyte counts were higher in the SE arm. However, the monocyte and lymphocyte trends were similar to the development cohort and lack of statistical significance was likely due to the smaller sample size. Cell ratios, apart from PLR, were higher in SE compared with pPNES in both cohorts (Table 2). Lactate levels were also higher in the SE group in the development cohort with a similar trend in the validation cohort.
TABLE 2.
Cell counts, cell ratios, and lactate.
| Development cohort | Validation cohort | |||||
|---|---|---|---|---|---|---|
| SE (N = 79) | pPNES (N = 44) | P value | SE (N = 20) | pPNES (N = 11) | P value | |
| Cell counts | ||||||
| Total leuks, cells/μL, median (Q1–Q3) | 8.88 (6.90–2.21) | 6.86 (5.91–7.90) | 0.004 a | 12.8 (8.43–16.75) | 6.9 (6.4–8.7) | 0.002 |
| Neutrophils, cells/μL, median (Q1–Q3) | 6.72 (4.74–8.82) | 3.91 (3.03–4.54) | <0.001 a | 9.9 (6–13.05) | 4.1 (3.6–5.3) | 0.001 |
| Monocytes, cells/μL, median (Q1–Q3) | 0.65 (0.48–0.84) | 0.49 (0.42–0.62) | 0.04 a | 0.75 (0.5–1.35) | 0.6 (0.5–0.8) | 0.31 |
| Lymphocytes, cells/μL, median (Q1–Q3) | 1.44 (0.93–2.18) | 2.08 (1.58–2.73) | 0.03 a | 1.5 (0.8–2.53) | 2 (2–2.3) | 0.11 |
| Platelets, cells/μL, median (Q1–Q3) | 229.00 (179.00–274.00) | 206.00 (167.50–248.00) | 0.20 a | 217 (177.3–306.8) | 246 (235–384) | 0.10 |
| Cell ratios | ||||||
| NLR, median (Q1–Q3) | 4.38 (2.23–8.28) | 1.94 (1.37–2.58) | <0.001 a | 6.42 (2.39–15.33) | 2.05 (1.63–2.48) | 0.002 |
| NMR, median (Q1–Q3) | 9.83 (7.47–13.41) | 7.48 (5.83–9.29) | 0.012 a | 12.02 (6.92–15.6) | 6.83 (5.3–7.8) | 0.028 |
| MLR, median (Q1–Q3) | 0.45 (0.30–0.68) | 0.24 (0.18–0.36) | <0.001 a | 0.58 (0.28–0.89) | 0.29 (0.21–0.43) | 0.025 |
| PLR, median (Q1–Q3) | 152.57 (104.66–231.75) | 100.47 (81.42–127.7) | 0.003 a | 174.5 (98.16–257.9) | 123 (111.9–167.7) | 0.47 |
| SII, median (Q1–Q3) | 970.26 (478.45–1583.9) | 377.28 (253.6–573.02) | <0.001 a | 1324 (598.6–3659) | 504.3 (471.3–774.3) | 0.004 |
| SIRI, median (Q1–Q3) | 2.83 (1.49–5.05) | 0.98 (0.61–1.51) | <0.001 a | 6.48 (1.61–12.9) | 1.23 (0.81–1.79) | 0.002 |
| Lactate, mmol/L, median (Q1–Q3) | 2.1 (1.42–8.12) | 1.25 (1.20–1.95) | 0.018 a | 2.35 (1.33–4.73) | 1.4 (0.7–3.9)) | 0.10 |
Note: P values for the event‐level data were derived from mixed effect models.
Abbreviations: Leuks, leukocytes; MLR, monocyte–lymphocyte ratio; NLR, neutrophil–lymphocyte ratio; NMR, neutrophil–monocyte ratio; PLR, platelet–lymphocyte ratio; Q1–Q3, interquartile range; SII, systemic inflammatory index ((neutrophil count × platelet count))/lymphocyte count); SIRI, systemic inflammatory response index ((neutrophil count × monocyte count))/lymphocyte count).
P values were derived from mixed effect models using log‐transformed variables.
Table 3 demonstrates various cutoff values supporting an SE diagnosis and corresponding sensitivity, specificity, and area under the ROC curve for the development cohort.
TABLE 3.
Cutoff values supporting a SE diagnosis.
| Cutoff (Youden's index) | AUC | Sensitivity | Specificity |
|---|---|---|---|
| Total leukocyte count (cells/μL) > 8.43 | 0.70 | 0.58 | 0.89 |
| Neutrophil count (cells/μL) > 4.99 | 0.78 | 0.71 | 0.82 |
| Monocyte count (cells/μL) > 0.61 | 0.65 | 0.61 | 0.71 |
| Lymphocyte count (cells/μL) < 1.80 | 0.68 | 0.65 | 0.75 |
| Platelet count (cells/μL) > 255 | 0.59 | 0.44 | 0.75 |
| NLR >3.23 | 0.76 | 0.55 | 0.89 |
| NMR >9.61 | 0.67 | 0.53 | 0.82 |
| MLR >0.32 | 0.74 | 0.70 | 0.71 |
| PLR > 152.57 | 0.717 | 0.49 | 0.93 |
| Lactate >3.4 | 0.62 | 0.38 | 1.00 |
| SIRI >1.15 | 0.79 | 0.84 | 0.64 |
| SII > 701.08 | 0.79 | 0.65 | 0.89 |
Note: Area under the curve (AUC), sensitivity, and specificity for the various cell counts and ratios were identified using receiver operating characteristics curves and Youden's index.
Abbreviations: MLR, monocyte lymphocyte ratio; NLR, neutrophil–lymphocyte ratio; NMR, neutrophil monocyte ratio; PLR, platelet lymphocyte ratio; SII, systemic inflammatory index ((neutrophil count × platelet count))/lymphocyte count); SIRI, systemic inflammatory response index ((neutrophil count × monocyte count))/lymphocyte count).
3.4. Optimal collection times
The optimal time for taking bloods differed based on the variable assessed but generally appeared best after 60 min postevent onset. Lactate levels began to separate between the SE and pPNES groups at 30 min (5.25 mmol/L vs 1.8 mmol/L; P = 0.051, data not shown) and the largest difference in lactate levels between groups occurred at the 60‐min mark before rapidly falling (Figure 2). The cell ratios and neutrophil count remained significantly different between the two groups for longer (up to 540 min) than the lactate levels (150 min) and, where peaks were observed in the SE cohort, appeared to peak later than lactate levels (Figure 2 and Figure S1).
FIGURE 2.
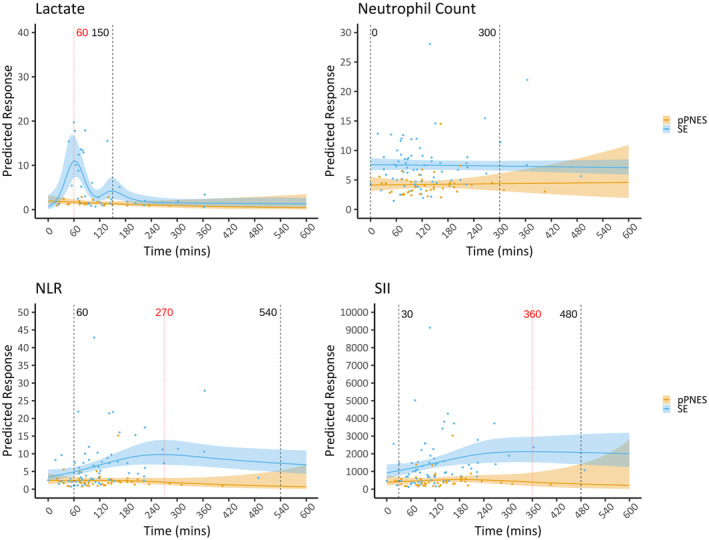
Level versus time curves. Lactate, neutrophil count, neutrophil‐lymphocyte ratio (NLR), and systemic inflammatory index (SII) versus time curves. The solid line represents the calculated estimated marginal mean; the shaded area represents the 95% confidence interval. Blue is the status epilepticus cohort and yellow is the prolonged psychogenic nonepileptic seizure cohort. Vertical black broken lines mark the calculated optimal collection times in minutes postevent onset using timepoints where there were significant differences between the calculated estimated marginal means of the two arms (P < 0.05). The red vertical line marks the time of peak variable measurement in the SE cohort. Lactate optimal collection time onset and time of peak variable measurement in the SE cohort coincided at 60 min. NLR, neutrophil–lymphocyte ratio; SII, systemic immune inflammatory index.
3.5. Combined prediction score
Combined scores were developed to increase test sensitivity over a broader time frame. Neutrophil count, SII, and SIRI performed best and so these variables were individually combined with lactate into three separate scores and nomograms (Figure 3) termed “Neut‐Lac Score,” “SII‐Lac Score,” and “SIRI‐Lac Score,” respectively. Initial risk scores were derived from logistic regression models adjusting for confounders that had an association with lactate, namely prior history of epilepsy and predominant motor features (Appendix S1). Considering confounders did not improve models significantly, the simpler models without confounders were chosen for ease of practical application (shown below). Predicted risks may be calculated from the following formulae:
FIGURE 3.
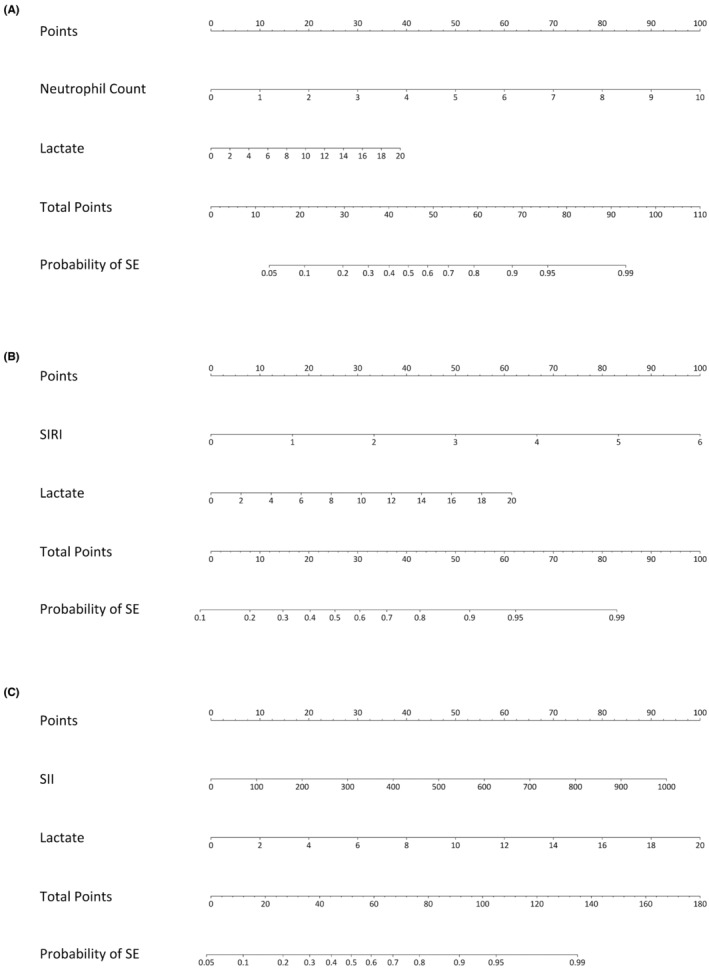
Diagnostic nomograms. Three separate nomograms combining lactate and neutrophil count (Neut‐Lac Score) (A) or lactate and SIRI (SIRI‐Lac Score) (B) or lactate and SII (SII‐Lac Score) (C) to predict the probability an SE diagnosis (as opposed to a PNES diagnosis). The probability of SE is calculated by adding the corresponding points from each variable to give a total point score from which the probability of SE can be read.
where the risk score (linear predictor) of each model was risk score(Neut‐Lac) = −4.18 + (0.94 × neutrophil count[cell/μL]) + (0.18 × lactate(mmol/L)), risk score(SIRI‐Lac) = −2.02 + (1.33 × SIRI) + (0.25 × lactate(mmol/L))), risk score(SII‐Lac) = −2.85 + (0.005 × SII) + (0.28 × lactate).
ROC analyses of the SIRI‐Lac score, SII‐Lac score, and Neut‐Lac score had AUCs of 0.90 (95% C.I. 0.80–0.97), 0.91 (95% C.I. 0.83–0.98), 0.89 (95% C.I. 0.81–0.97); sensitivities of 0.76 (95% C.I. 0.62–0.97), 0.79 (95% C.I. 0.69–0.95), 0.79 (95% C.I. 0.64–0.93); and specificities of 0.93 (95% C.I. 0.77–1.00), 1.00 (95% C.I. 0.89–1.00), 0.93 (95%C.I. 0.84–1.00), where the cutoff for the predicted probability of SE was >0.83, >0.83, and >0.70, respectively. Calibration indicated some model underfitting, with overestimation of the predicted probability of SE for low‐risk patients and underestimation for high‐risk patients, notably for the SII‐Lac Score and Neut‐Lac Score models (Figure S2).
Validation of the scores using an external cohort revealed slightly lower accuracy but overall similar results (Table S2).
3.6. Confounding variables
Age, sex, prior history of epilepsy, and number of medical comorbidities were different between the SE and pPNES groups. Of these, a prior history of epilepsy was associated with lactate level (e β 0.54, 95% C.I. 0.32, 0.90, P = 0.02), monocyte count (e β 0.83, 95% C.I. 0.70, 0.99, P = 0.04), lymphocyte count (e β 0.75, 95% C.I. 0.58, 0.97, P = 0.03), and platelet count (e β 0.86, 95% C.I. 0.77, 0.97, P = 0.02) after adjusting for other covariates in the model (Table S3). Female sex was associated with monocyte count, MLR and SIRI with lower cell ratios observed in females relative to males (monocyte count: e β 0.78, 95% C.I. 0.65, 0.94, P = 0.008; MLR: e β 0.72, 95% C.I. 0.56, 0.93, P = 0.01; SIRI: e β 0.66, 95% C.I. 0.45, 0.98, P = 0.04). Concordantly, the magnitude of the association between group status and cell ratios was attenuated in these adjusted models compared with their unadjusted counterparts. This resulted in a weaker association between the SE and pPNES groups for both biomarkers (monocyte count: 1.27, 95% C.I. 1.01, 1.59, P = 0.04); MLR: e β 1.36, 95% C.I. 0.99, 1.87, P = 0.06; SIRI: e β 2.32, 95% C.I. 1.42, 3.79, P < 0.001).
No significant association between prominent motor symptoms and cell ratios was observed in the adjusted models. However, the presence of prominent motor symptoms was associated with higher lactate levels when adjusted for other covariates (e β 2.58, 95% C.I. 1.30, 5.15, P = 0.01). Nevertheless, there was still a significant difference between SE and pPNES cohorts in terms of lactate levels when this was accounted for (e β 2.28, 95% C.I. 1.22, 4.26, P = 0.01).
4. DISCUSSION
While differentiating SE from pPNES ultimately relies on careful and expert history taking supported by tests such as video‐EEG monitoring, this is not always possible especially in emergency or low‐resource settings. Easily available biomarkers that can aid in the diagnostic process are required. We hypothesized that peripheral cell counts, cell ratios, and lactate levels may fulfill this role. Our study showed neutrophil and monocyte elevation in the SE compared with pPNES groups (6.72 vs 3.91 cells/μL and 0.65 vs 0.49 cells/μL, respectively) with neutrophils having the greater difference. Total circulating lymphocyte count was lower in SE than pPNES patients (1.44 vs 2.08 cells/μL). The neutrophil findings are similar to prior studies where counts ranged from 4.48 to 8.1 cells/μL postictally 13 , 14 , 15 , 16 and were 3.7 cells/μL within 1 h post‐PNES 14 or between 4.05 and 5.58 cells/μL in HC. 15 , 16 Lymphocyte counts in past studies appeared to be higher postictally than in our study with a range between 1.95 and 2.97 cells/μL 13 , 14 , 15 , 16 and counts of 2.15 cells/μL within 1 h post‐PNES 14 or between 2.45 and 2.89 cells/μL in HC. 15 , 16 Nevertheless, the trend of lower lymphocyte counts postepileptic seizure compared with PNES or HC has been seen before. 15 , 16
Peripheral cell counts had low to moderate accuracy in differentiating between SE and pPNES with ROC curve AUCs between 0.59 and 0.78. Neutrophil counts performed best with the highest AUC, a sensitivity of 0.71, and a specificity of 0.82 with differences in neutrophil counts between groups seen out to 300 min following event onset. Interestingly, a prospective study of 28 patients with a mean seizure duration of 181 s looking at leukocyte count time profiles showed a rise at the time of a generalized convulsive seizure and a return to baseline levels by 2 h. 34 The return to baseline was earlier than would be predicted by this study and may reflect the greater seizure severity in the status epilepticus population and further studies are needed to aid with generalisability of these results.
Lactate levels 5 , 22 , 25 , 26 have also been previously investigated for use in differentiating between seizures and other events. In most studies, lactate levels were measured within 1–2 h of an epileptic seizure which is earlier than in our study where the median time to measurement was closer to the 2‐h mark. Consequently, previous postictal lactate measurements were higher than in our study, ranging from 3.0 to 6.9 mmol/L compared with 2.1 mmol/L. Prolonged PNES lactate levels were similar in our cohorts at 1.25–1.4 mmol/L compared with past studies where lactate was between 1.3 and 1.7 mmol/L with the upper end of the range representing pPNES. 5 , 22 , 25
In prior studies, blood lactate levels had a sensitivity for seizure detection between 0.64 and 0.89 and a specificity between 0.79 and 0.90 when performed within 2 h of event. 5 , 22 , 25 , 26 In another study, 5 where blood collection time was not defined, sensitivity and specificity were lower at 0.6 and 0.82, respectively. In our study, where samples were collected over a longer duration postevent, the sensitivity was further reduced at 0.38. Modeling of the lactate levels versus time showed that lactate levels peaked rapidly at 60 min and remained significantly different between groups only between 60 and 150 min. This supports the measurement of lactate within 150 min, preferably at the 60‐min mark, when used as a sole diagnostic test to maximize its sensitivity for differentiating SE from pPNES.
Cell ratios, particularly NLR, have shown mixed results in several studies mainly comparing seizures with HC. NLR was elevated following epileptic seizures compared with HC in two retrospective studies where levels were measured within 1 h 15 (4.46 vs 1.81) or within 6 h (4.83 vs 1.98) 16 of a seizure; however, NLR was not significantly different compared with PNES events in one prospective study, where blood were taken within 1 h of the VEM‐confirmed event (1.62 vs 1.44). 14 This may reflect a difference in the timing of blood collection with the prospective study blood possibly taken at an earlier timepoint than in the retrospective studies. It seems unlikely to be due to different comparator populations as the main difference between the studies was in the cell ratios of the postepileptic seizure arms. We found a significant difference between SE and pPNES groups in terms of NLR, NMR, MLR, SII, and SIRI. There was no difference in the PLR between SE and pPNES groups which was similar to one prior study. 15
Cell ratios, like cell counts, generally had low sensitivity and high specificity for SE events with moderate ROC curve AUCs of between 0.62 and 0.79. SII and SIRI were the best‐performing cell ratios with an ROC curve AUC of 0.79 and 0.79; sensitivity of 0.65 and 0.84; and specificity of 0.89 and 0.64, respectively. Modeling of cell ratios versus time revealed a later and broader peak than with lactate. Generally, cell ratios peaked after 4 h with optimal collection times out to 9 h. Therefore, while the lactate level is useful prior to 150 min, cell ratios are useful later and for a longer duration.
The generally low sensitivity and high specificity of lactate, peripheral cell counts, and ratios can help rule in, but not rule out, SE diagnosis. Given the different time profiles of lactate versus peripheral cell counts and ratios, combined scores (Neut‐Lac Score, SII‐Lac Score, and SIRI‐Lac Score) were developed with increased sensitivity over a broader period and better predictive capacity. The nomograms have an excellent performance with AUCs between 0.89 and 0.91, sensitivities between 0.76 and 0.79, and specificities between 0.93 and 1.00. These scores were validated in an external cohort with similar results: AUCs between 0.84 and 0.87, sensitivities of 0.75, and specificities of 0.91–1.00. Thus, these scores could be clinically useful to help differentiate between SE and pPNES.
The SE and pPNES groups were different in terms of sex, age, history of epilepsy, and number of medical comorbidities. Prior studies have shown that peripheral cell counts and ratios vary with age and sex. 35 , 36 Studies have also found differences in lactate levels postictally based on gender and seizure type. 24 , 25 After taking these factors into account neutrophils, monocytes, NLR, NMR, SIRI, SII, and lactate remained different between the SE and pPNES groups. In addition, platelet count became significantly different when accounting for confounders while lymphocyte count was no longer different. The SE group was more medically unwell than the pPNES group with longer event durations, length of stays, and ICU admissions. However, analyses (not shown in this paper) did not show any correlation between cell ratios and these parameters within the SE group. This suggests that the differences in cell ratios between the groups are not significantly skewed by the sicker patients in the SE group.
Limitations include the retrospective design and the potential for ascertainment bias. To minimize this, two independent reviewers evaluated the events not captured on video‐EEG to determine if they were consistent with SE or pPNES, with a concordance rate of 99%. Exclusion criteria were particularly strict to remove other potential physiological contributors to cell count. In the real‐world setting, a quick medical history and physical exam would eliminate many of the exclusion criteria, enabling clinical use of these biomarkers in distinguishing between pPNES and SE. We only looked at SE and most events had prominent motor manifestations. Further prospective studies looking at a wider range of seizure types and undertaken in a video‐EEG monitoring unit to allow for more detailed event classification would be useful to confirm and better characterize the findings of this study. Despite its limitations, the benefits of the retrospective study design allowed us to look at a wide range of blood collection timepoints and generate change versus time curves. There was limited data at later timepoints potentially affecting model accuracy. Nevertheless, the suggested optimal collection times generated by these curves are consistent with past studies which suggest that lactate is useful within 2 h of an event 5 , 22 , 25 , 26 and that cell counts and ratios are useful for longer (e.g., 6 h). 16
5. CONCLUSION
Cell counts, cell ratios, and lactate levels can, individually, help to distinguish between SE and pPNES groups, with generally low sensitivity but reasonable specificity. Optimal collection times were earlier for lactate (60–150 min), and longer for cell counts and ratios. Scores combining early peaking lactate and later peaking SIRI, SII, or neutrophil counts possessed high sensitivity and specificity. These scores could help clinicians differentiate between SE and pPNES in settings where access to expert clinical assessment and video‐EEG is limited. Further prospective studies would be warranted to confirm these findings.
AUTHOR CONTRIBUTIONS
Tracie HL Tan: conceptualization, data curation, formal analysis, investigation, methodology, original draft preparation, manuscript revision, and editing; Paul Sanfilippo: formal analysis, validation of results, manuscript revision, and editing; Blake Colman: data collection, manuscript revision, and editing; Piero Perucca: supervision, manuscript revision, and editing; Patrick Kwan: supervision, manuscript revision, and editing; Terence J O'Brien: supervision, manuscript revision, and editing; Mastura Monif: conceptualization, methodology, formal analysis, supervision, manuscript revision, and editing.
CONFLICT OF INTEREST STATEMENT
A/Prof. Perucca has received speaker honoraria or consultancy fees to his institution from Chiesi, Eisai, GRIN Therapeutics, LivaNova, Novartis, Sun Pharma, Supernus, and UCB Pharma, outside the submitted work. He is an Associate Editor for Epilepsia Open; Prof. O'Brien's institution has received research funding for his research and consultancies from Chiesi, Eisai, Biogen, ES Therapeutics, Epidarex, LivaNova, Novartis, Supernus, and UCB Pharma, outside the submitted work; Dr Mastura Monif has served on advisory board for Merck, has received speaker honoraria from Merck and Biogen and Roche. Her institution receives funding from Merck, the Australian National Health Medical Research Council, Brain Foundation, Charles and Sylvia Viertel Foundation, Bethlehem Griffith Foundation, and MS Research. The remaining authors have no conflict of interest.
PATIENT CONSENT
As no identifiable persons are included in this study, individual consent was not required. The study was reviewed by the Human Research Ethics Committee of Alfred Health (HREC 155/20) and Melbourne Health (QA2021120).
ETHICAL APPROVAL
This study has been approved by the Human Research Ethics Committees of Alfred and Melbourne Health (project numbers: 155/20 and QA2021120 respectively). Obtaining consent was determined to be not required for this study. We confirm that we have read the Journal's position on issues involved in ethical publication and affirm that this report is consistent with those guidelines.
Supporting information
Appendix S1
Figure S1
Figure S2
Table S1
Table S2
Table S3
ACKNOWLEDGMENTS
T. Tan is supported by an Australian Government Research Training Program (RTP) Scholarship. P. Sanfilippo has no disclosures. P. Perucca is supported by an Emerging Leadership 2 Investigator Grant from the NHMRC (APP2017651), the University of Melbourne, Monash University, the Weary Dunlop Medical Research Foundation, Brain Australia, and the Norman Beischer Medical Research Foundation. P. Kwan is supported by an MRFF Practitioner Fellow (MRF1136427). Prof. O’Brien is supported by an NHMRC Investigator Grant (APP1176426) and has received grant research funding from the MRFF, ARC, NIH, and DoD. M. Monif is supported by the NHMRC MRFF grant and NHMRC Ideas Grant. She has received funding from the Brain Foundation, Charles and Sylvia Viertel Foundation, Bethlehem Griffith Foundation, and MS Research Australia. Open access publishing facilitated by Monash University, as part of the Wiley ‐ Monash University agreement via the Council of Australian University Librarians.
Tan TH, Sanfilippo P, Colman B, Perucca P, Kwan P, O’Brien TJ, et al. Development and validation of a peripheral cell ratio and lactate score for differentiating status epilepticus from prolonged psychogenic nonepileptic seizures. Epilepsia Open. 2023;8:1460–1473. 10.1002/epi4.12822
DATA AVAILABILITY STATEMENT
The corresponding author Dr Mastura Monif and the first (principle) author Dr Tracie Tan take full responsibility for the data, analyses, interpretation, and conduct of the research and have ongoing full access to all the data used in the generation of this manuscript. Unpublished de‐identified data will be made available on reasonable request from any qualified investigator
REFERENCES
- 1. Smith D, Defalla BA, Chadwick DW. The misdiagnosis of epilepsy and the management of refractory epilepsy in a specialist clinic. QJM. 1999;92:15–23. [DOI] [PubMed] [Google Scholar]
- 2. Scheepers B, Clough P, Pickles C. The misdiagnosis of epilepsy: findings of a population study. Seizure. 1998;7:403–406. [DOI] [PubMed] [Google Scholar]
- 3. Boesebeck F, Freermann S, Kellinghaus C, Evers S. Misdiagnosis of epileptic and non‐epileptic seizures in a neurological intensive care unit. Acta Neurol Scand. 2010;122:189–195. [DOI] [PubMed] [Google Scholar]
- 4. Ghougassian DF, d'Souza W, Cook MJ, O'Brien TJ. Evaluating the utility of inpatient video‐EEG monitoring. Epilepsia. 2004;45:928–932. [DOI] [PubMed] [Google Scholar]
- 5. Lehn A, Watson E, Ryan EG, Jones M, Cheah V, Dionisio S. Psychogenic nonepileptic seizures treated as epileptic seizures in the emergency department. Epilepsia. 2021;62:2416–2425. [DOI] [PubMed] [Google Scholar]
- 6. Jungilligens J, Michaelis R, Popkirov S. Misdiagnosis of prolonged psychogenic non‐epileptic seizures as status epilepticus: epidemiology and associated risks. J Neurol Neurosurg Psychiatry. 2021;92:1341–1345. [DOI] [PMC free article] [PubMed] [Google Scholar]
- 7. Elavarasi A, Parihar J, Kapoor S, Kapoor A, Stredny C, Singh MB, et al. Seizure‐related injuries in inadequately treated epilepsy patients: a case‐control study. Seizure. 2020;83:17–20. [DOI] [PubMed] [Google Scholar]
- 8. Reuber M, Pukrop R, Mitchell AJ, Bauer J, Elger CE. Clinical significance of recurrent psychogenic nonepileptic seizure status. J Neurol. 2003;250:1355–1362. [DOI] [PubMed] [Google Scholar]
- 9. Seneviratne U, Low ZM, Low ZX, Hehir A, Paramaswaran S, Foong M, et al. Medical health care utilization cost of patients presenting with psychogenic nonepileptic seizures. Epilepsia. 2019;60:349–357. [DOI] [PubMed] [Google Scholar]
- 10. Asadi‐Pooya AA, Bahrami Z. Risk factors for the use of antiepileptic drugs in patients with psychogenic nonepileptic seizures. Epilepsy Behav. 2019;90:119–121. [DOI] [PubMed] [Google Scholar]
- 11. Viarasilpa T, Panyavachiraporn N, Osman G, Akioyamen NO, Wasade VS, Barkley G, et al. Intubation for psychogenic non‐epileptic attacks: frequency, risk factors, and impact on outcome. Seizure. 2019;76:17–21. [DOI] [PubMed] [Google Scholar]
- 12. Fay ME, Myers DR, Kumar A, Turbyfield CT, Byler R, Crawford K, et al. Cellular softening mediates leukocyte demargination and trafficking, thereby increasing clinical blood counts. Proc Natl Acad Sci U S A. 2016;113:1987–1992. [DOI] [PMC free article] [PubMed] [Google Scholar]
- 13. Bauer S, Koller M, Cepok S, Todorova‐Rudolph A, Nowak M, Nockher WA, et al. NK and CD4+ T cell changes in blood after seizures in temporal lobe epilepsy. Exp Neurol. 2008;211:370–377. [DOI] [PubMed] [Google Scholar]
- 14. Morkavuk G, Koc G, Leventoglu A. Is the differential diagnosis of epilepsy and psychogenic nonepileptic seizures possible by assessing the neutrophil/lymphocyte ratio? Epilepsy Behav. 2021;116:107736. [DOI] [PubMed] [Google Scholar]
- 15. Gunes M, Buyukgol H. Relationship between generalized epileptic seizure and neutrophil/lymphocyte ratio, platelet/lymphocyte ratio, and neutrophil mediated inflammation. Int J Neurosci. 2020;130:1–6. [DOI] [PubMed] [Google Scholar]
- 16. Ozdemir HH, Akil E, Acar A, Tamam Y, Varol S, Cevik MU, et al. Changes in serum albumin levels and neutrophil‐lymphocyte ratio in patients with convulsive status epilepticus. Int J Neurosci. 2017;127:417–420. [DOI] [PubMed] [Google Scholar]
- 17. Hu B, Yang XR, Xu Y, Sun YF, Sun C, Guo W, et al. Systemic immune‐inflammation index predicts prognosis of patients after curative resection for hepatocellular carcinoma. Clin Cancer Res. 2014;20:6212–6222. [DOI] [PubMed] [Google Scholar]
- 18. Qi Q, Zhuang L, Shen Y, Geng Y, Yu S, Chen H, et al. A novel systemic inflammation response index (SIRI) for predicting the survival of patients with pancreatic cancer after chemotherapy. Cancer. 2016;122:2158–2167. [DOI] [PubMed] [Google Scholar]
- 19. Vazquez‐Mojena Y, Rodriguez‐Cordova Y, Dominguez‐Barrios Y, León‐Arcia K, Miranda‐Becerra D, Gonzalez‐Zaldivar Y, et al. Peripheral inflammation links with the severity of clinical phenotype in spinocerebellar ataxia 2. Mov Disord. 2023;38:880–885. [DOI] [PubMed] [Google Scholar]
- 20. Gokce SF, Bolayir A, Cigdem B, Yildiz B. The role of systemic immune inflammatory index in showing active lesion in patients with multiple sclerosis: SII and other inflamatuar biomarker in radiological active multiple sclerosis patients. BMC Neurol. 2023;23:64. [DOI] [PMC free article] [PubMed] [Google Scholar]
- 21. Huang YW, Yin XS, Li ZP. Association of the systemic immune‐inflammation index (SII) and clinical outcomes in patients with stroke: a systematic review and meta‐analysis. Front Immunol. 2022;13:1090305. [DOI] [PMC free article] [PubMed] [Google Scholar]
- 22. Matz O, Zdebik C, Zechbauer S, Bündgens L, Litmathe J, Willmes K, et al. Lactate as a diagnostic marker in transient loss of consciousness. Seizure. 2016;40:71–75. [DOI] [PubMed] [Google Scholar]
- 23. Matz O, Heckelmann J, Zechbauer S, Litmathe J, Brokmann JC, Willmes K, et al. Early postictal serum lactate concentrations are superior to serum creatine kinase concentrations in distinguishing generalized tonic‐clonic seizures from syncopes. Intern Emerg Med. 2018;13:749–755. [DOI] [PubMed] [Google Scholar]
- 24. Magnusson C, Herlitz J, Hoglind R, Wennberg P, Tranberg AE, Axelsson C, et al. Prehospital lactate levels in blood as a seizure biomarker: a multi‐center observational study. Epilepsia. 2021;62:408–415. [DOI] [PMC free article] [PubMed] [Google Scholar]
- 25. Dogan EA, Unal A, Unal A, Erdogan C. Clinical utility of serum lactate levels for differential diagnosis of generalized tonic‐clonic seizures from psychogenic nonepileptic seizures and syncope. Epilepsy Behav. 2017;75:13–17. [DOI] [PubMed] [Google Scholar]
- 26. Olaciregui Dague K, Surges R, Litmathe J, Villa L, Brokmann J, Schulz JB, et al. The discriminative value of blood gas analysis parameters in the differential diagnosis of transient disorders of consciousness. J Neurol. 2018;265:2106–2113. [DOI] [PubMed] [Google Scholar]
- 27. Trinka E, Cock H, Hesdorffer D, Rossetti AO, Scheffer IE, Shinnar S, et al. A definition and classification of status epilepticus‐report of the ILAE task force on classification of status epilepticus. Epilepsia. 2015;56:1515–1523. [DOI] [PubMed] [Google Scholar]
- 28. Bodde NM, Brooks JL, Baker GA, Boon PAJM, Hendriksen JGM, Mulder OG, et al. Psychogenic non‐epileptic seizures‐definition, etiology, treatment and prognostic issues: a critical review. Seizure. 2009;18:543–553. [DOI] [PubMed] [Google Scholar]
- 29. van Swieten JC, Koudstaal PJ, Visser MC, Schouten HJ, van Gijn J. Interobserver agreement for the assessment of handicap in stroke patients. Stroke. 1988;19:604–607. [DOI] [PubMed] [Google Scholar]
- 30. Broderick JP, Adeoye O, Elm J. Evolution of the modified Rankin scale and its use in future stroke trials. Stroke. 2017;48:2007–2012. [DOI] [PMC free article] [PubMed] [Google Scholar]
- 31. Holm‐Yildiz S, Richter Hansen J, Thonon V, Beniczky S, Fabricius M, Sidaros A, et al. Does continuous electroencephalography influence therapeutic decisions in neurocritical care? Acta Neurol Scand. 2021;143:290–297. [DOI] [PubMed] [Google Scholar]
- 32. Matthews E, Alkhachroum A, Massad N, Letchinger R, Doyle K, Claassen J, et al. New‐onset super‐refractory status epilepticus: a case series of 26 patients. Neurology. 2020;95:e2280–e2285. [DOI] [PMC free article] [PubMed] [Google Scholar]
- 33. Broadley J, Seneviratne U, Beech P, Buzzard K, Butzkueven H, O'Brien T, et al. Prognosticating autoimmune encephalitis: a systematic review. J Autoimmun. 2019;96:24–34. [DOI] [PubMed] [Google Scholar]
- 34. Nass RD, Wagner M, Surges R, Holdenrieder S. Time courses of HMGB1 and other inflammatory markers after generalized convulsive seizures. Epilepsy Res. 2020;162:106301. [DOI] [PubMed] [Google Scholar]
- 35. Takami A, Watanabe S, Yamamoto Y, Miyachi H, Bamba Y, Ohata M, et al. Reference intervals of white blood cell parameters for healthy adults in Japan. Int J Lab Hematol. 2021;43:948–958. [DOI] [PubMed] [Google Scholar]
- 36. Wang J, Zhang F, Jiang F, Hu L, Chen J, Wang Y. Distribution and reference interval establishment of neutral‐to‐lymphocyte ratio (NLR), lymphocyte‐to‐monocyte ratio (LMR), and platelet‐to‐lymphocyte ratio (PLR) in Chinese healthy adults. J Clin Lab Anal. 2021;35:e23935. [DOI] [PMC free article] [PubMed] [Google Scholar]
Associated Data
This section collects any data citations, data availability statements, or supplementary materials included in this article.
Supplementary Materials
Appendix S1
Figure S1
Figure S2
Table S1
Table S2
Table S3
Data Availability Statement
The corresponding author Dr Mastura Monif and the first (principle) author Dr Tracie Tan take full responsibility for the data, analyses, interpretation, and conduct of the research and have ongoing full access to all the data used in the generation of this manuscript. Unpublished de‐identified data will be made available on reasonable request from any qualified investigator