

Abstract
Background and Aims
Cardiovascular disease (CVD) impacts significantly health and social care systems as well as society through premature mortality and disability, with patients requiring care from relatives. Previous pan-European estimates of the economic burden of CVD are now outdated. This study aims to provide novel, up-to-date evidence on the economic burden across the 27 European Union (EU) countries in 2021.
Methods
Aggregate country-specific resource use data on morbidity, mortality, and health, social and informal care were obtained from international sources, such as the Statistical Office of the European Communities, enhanced by data from the European Society of Cardiology Atlas programme and patient-level data from the Survey of Health, Ageing and Retirement in Europe. Country-specific unit costs were used, with cost estimates reported on a per capita basis, after adjustment for price differentials.
Results
CVD is estimated to cost the EU €282 billion annually, with health and long-term care accounting for €155 billion (55%), equalling 11% of EU-health expenditure. Productivity losses accounted for 17% (€48 billion), whereas informal care costs were €79 billion (28%). CVD represented a cost of €630 per person, ranging from €381 in Cyprus to €903 in Germany. Coronary heart disease accounted for 27% (€77 billion) and cerebrovascular diseases for 27% (€76 billion) of CVD costs.
Conclusions
This study provides contemporary estimates of the wide-ranging impact of CVD on all aspects of the economy. The data help inform evidence-based policies to reduce the impact of CVD, promoting care access and better health outcomes and economic sustainability.
Keywords: Cost, Cardiovascular disease, Cerebrovascular disease, Coronary heart disease
Structured Graphical Abstract
Structured Graphical Abstract.
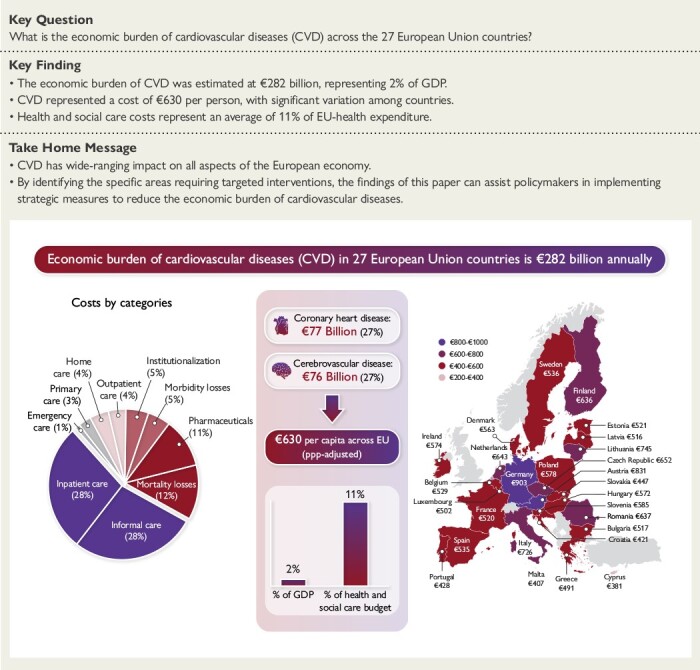
Cardiovascular disease costs €282 billion annually across the 27 European Union countries, representing a cost of €630 per EU citizen. CVD-related costs were estimated using country-specific national data on morbidity, mortality, and health, social and informal care.
See the editorial comment for this article ‘High costs of cardiovascular disease in the European Union’, by W. S. Weintraub, https://doi.org/10.1093/eurheartj/ehad587.
Introduction
Cardiovascular disease (CVD) is a major health problem across Europe, being the largest cause of sickness and morbidity and a leading cause of death and premature mortality.1 CVD [defined as International Classification of Diseases (ICD)-10 category I00–I99] caused 1.7 million deaths in the EU in 2021.2 The most common CVDs are coronary heart disease (CHD; ICD-10 category I20–I25) and cerebrovascular disease (ICD-10 category I60–I69), accounting for 34% and 22% of cardiovascular deaths across the EU, respectively.1 CVD also has a significant impact on the European workforce.3 The disease often leads to disability, premature retirement, and absenteeism, resulting in reduced productivity and economic output. This places an additional burden on both individuals and society.
Previous studies evaluating the costs of CVDs in the EU were conducted some years ago, most recently in 2017.4,5 In 2003, the economic burden for 25 EU countries was estimated at €169 billion, which increased to €210 billion by 2017 for 28 countries. Other studies, using similar methodology, have been conducted for other non-communicable chronic conditions.6–10 For example, in 2009, the cost of cancer was estimated at €126 billion for 27 EU countries, with healthcare costs accounting for 4% of total EU-healthcare expenditure, compared to 11% for CVD in the same year.9
These cross-EU estimates of the cost relied heavily on assumptions to apportion overall totals of non-hospital care resource use rather than informed by individual-patient level data. They have also omitted important costs such as long-term social care (including institutionalization in nursing homes or care at home), with CVD conditions such as stroke being significant drivers of institutionalization.11 It is important that cost-of-illness studies are as precise and up-to-date as possible in order to provide reliable evidence base for policy-makers. They not only estimate the resources consumed in disease diagnosis and treatment but also estimate the non-healthcare impact of CVD such as the opportunity costs of relatives providing care for patients and the lost earnings associated with inability to work due to disability or premature death.
The objectives of this study were to provide an estimate of the societal economic costs of CVD for the 27 member states of the EU in 2021 (see Supplementary data online, Table A1, p2 online), including health and social care costs, informal care costs, and productivity loss, and to estimate the proportion of total CVD cost attributable to CHD and cerebrovascular disease.
Methods
Analysis framework and data sources
We evaluated the costs of CVD in a population-based cost of illness analysis. CVD was defined by the World Health Organization ICD-10 codes I00–I99. We also estimated the costs associated with CHD (I20–I25) and cerebrovascular disease (I60–I69).
We used the same methodological framework to obtain data for and value CVD-related resource use in each of the 27 EU countries. This framework has been applied previously to estimate the costs of CVD and chronic diseases4–10 enabling comparisons across time, countries and diseases, and providing key data for public health policy.
We adopted a societal perspective for our analyses, with the inclusion of health and social care costs, informal care costs, and productivity losses. We used an annual timeframe, that included all costs for 2021 (the most recent year for which data were available in most countries) or from the most recent year if 2021 data were not available, irrespective of the time of disease onset. We obtained country-specific aggregate resource use data from international and national sources, including the Statistical Office of the European Communities (EUROSTAT2) the Organisation for Economic Co-operation and Development (OECD12) the European Society of Cardiology (ESC) Atlas of Cardiology,13 national ministries of health, and statistical institutes (the full list included in the online Supplementary data online). When we could not obtain data from these sources, we consulted relevant reports from peer-reviewed journals or professional bodies. Country-specific data on the number of incidents and prevalent cases of CVD, CHD, and cerebrovascular disease cases were obtained from the Global Burden of Disease (GBD) study.14
The aggregate data were supplemented with analysis of individual-patient-level data from the Survey of Health, Ageing and Retirement in Europe (SHARE).15 SHARE is a multidisciplinary cross-national panel database of data on health, socio-economic status and social, and family networks of older people. Data are collected via face-to-face, computer-aided, personal interviews, supplemented by self-completion paper, and pencil questionnaires. We used data collected in Waves 1, 2, and 4 to 8, which included over 140 000 respondents resident in all 27 EU countries in the EU, Israel, and Switzerland (with the latter two countries not included in this study).
All costs were expressed in 2021 prices and converted to euros where applicable.2 To account for price differentials across countries, we employed the purchasing power parity (PPP) method.2 A brief overview of the methods is provided below (see online Supplementary data online, for more detailed information).
Healthcare costs
The CVD healthcare included primary care, accident and emergency (A&E) care, hospital care, outpatient care, and medications (see online Supplementary data online for methodology and sources of each data estimate).
Primary care consisted of CVD-related visits with family doctors and practice nurses in health care facilities or patients’ homes. A&E care consisted of all CVD-related hospital emergency visits. Outpatient care consisted of CVD-related specialist consultations and treatments in outpatient wards, clinics, or patients’ homes. In order to estimate the full costs associated with these categories we applied the two-step approach. First, we obtained information on the total number of contacts with each type of service (see Supplementary data online, Table A2, p3). Second, we allocated the total number of contacts to CVD using the proportion attributable to CVD based on analysis of SHARE15 (see ‘Primary, outpatient and emergency care’ in Supplementary data online, p3–7). Hospital care consisted of CVD-related days in hospital, including day cases and inpatient stay, where the primary diagnosis was CVD,2 and cardiac procedures recorded in ESC Atlas.13 Costs were calculated by applying country-specific unit costs to the total number of CVD-related contacts/hospital admissions/cardiac procedures. Country-specific surveys to identify unit cost data were drawn-up and distributed to experts in individual countries through contacts in each of the cardiac societies of ESC member countries. Unit costs are reported in Table 1, with details of sources used (see Supplementary data online, Table A7, p11) and methodology described in further detail in the online Supplementary data online (see ‘Healthcare unit costs’, in Supplementary data online, p10–12).
Table 1.
Unit costs in the European Union, by country, 2021 (€)
| Country | Mortality losses | Morbidity losses | Informal care | Healthcare care | Social care | ||||||
|---|---|---|---|---|---|---|---|---|---|---|---|
| Yearly earnings | Daily earnings | Hourly earnings | GP visit | Outpatient visit | A&E visit | Admission CVD | Admission CHD | Admission stroke | Institutionalisation per year | Home care per hour | |
| Austria | 50 962 | 135 | 14 | 32 | 37 | 324 | 10 091 | 9262 | 9857 | 68 844 | 40 |
| Belgium | 48 538 | 162 | 15 | 27 | 41 | 91 | 10 032 | 9437 | 15 551 | 26 952 | 23 |
| Bulgaria | 10 748 | 35 | 3 | 10 | 23 | 33 | 1112 | 726 | 1432 | 7363 | 8 |
| Croatia | 15 841 | 52 | 5 | 17 | 54 | 89 | 1536 | 2399 | 1274 | 10 064 | 12 |
| Cyprus | 27 976 | 91 | 7 | 15 | 32 | 51 | 10 058 | 10 167 | 17 262 | 10 800 | 8 |
| Czech Republic | 20 281 | 69 | 6 | 15 | 27 | 49 | 5930 | 7123 | 4963 | 18 370 | 10 |
| Denmark | 63 114 | 240 | 25 | 28 | 97 | 112 | 9552 | 8978 | 15 535 | 64 563 | 49 |
| Estonia | 19 949 | 69 | 6 | 21 | 82 | 87 | 2670 | 6619 | 2184 | 8400 | 10 |
| Finland | 47 670 | 163 | 17 | 81 | 127 | 215 | 6118 | 5856 | 7824 | 106 906 | 36 |
| France | 40 450 | 139 | 14 | 25 | 67 | 149 | 9973 | 9309 | 11 627 | 24 578 | 19 |
| Germany | 48 291 | 153 | 15 | 31 | 74 | 90 | 7968 | 7727 | 8871 | 58 625 | 24 |
| Greece | 29 679 | 74 | 6 | 20 | 51 | 53 | 4543 | 4854 | 5472 | 16 021 | 15 |
| Hungary | 17 168 | 57 | 5 | 7 | 12 | 46 | 3649 | 2933 | 2933 | 7234 | 12 |
| Ireland | 51 826 | 192 | 17 | 48 | 163 | 289 | 15 257 | 12 354 | 41 109 | 72 898 | 24 |
| Italy | 36 088 | 111 | 11 | 21 | 132 | 252 | 13 747 | 17 667 | 11 784 | 29 652 | 13 |
| Latvia | 17 833 | 61 | 5 | 8 | 18 | 40 | 2195 | 3509 | 1300 | 7054 | 10 |
| Lithuania | 20 417 | 70 | 7 | 6 | 38 | 32 | 3193 | 6549 | 1848 | 14 436 | 10 |
| Luxembourg | 68 455 | 202 | 18 | 51 | 71 | 109 | 14 899 | 13 652 | 17 429 | 44 719 | 49 |
| Malta | 29 205 | 104 | 8 | 15 | 50 | 98 | 5634 | 7747 | 5598 | 23 700 | 9 |
| Netherlands | 48 563 | 152 | 14 | 54 | 101 | 287 | 13 332 | 10 836 | 17 485 | 68 667 | 58 |
| Poland | 16 811 | 59 | 6 | 7 | 22 | 40 | 4389 | 6825 | 3116 | 11 861 | 11 |
| Portugal | 20 297 | 64 | 7 | 31 | 69 | 113 | 5866 | 6776 | 8176 | 11 532 | 7 |
| Romania | 15 136 | 48 | 5 | 9 | 21 | 40 | 2038 | 2810 | 2105 | 5848 | 8 |
| Slovakia | 18 914 | 69 | 6 | 19 | 27 | 40 | 3627 | 3629 | 3116 | 12 764 | 11 |
| Slovenia | 28 815 | 87 | 9 | 18 | 121 | 132 | 9266 | 11 320 | 10 456 | 11 858 | 18 |
| Spain | 30 617 | 93 | 10 | 41 | 86 | 175 | 7285 | 7785 | 9165 | 22 112 | 15 |
| Sweden | 47 216 | 172 | 17 | 49 | 227 | 272 | 10 328 | 9341 | 14 209 | 96 700 | 28 |
Medication expenditure consisted of total retail and hospital sales on cardiovascular system medications (ATC code C, see ‘Expenditure on Medications’ in Supplementary data online, p13). ATC-C medication expenditure was obtained predominantly from the OECD.12 Only Germany and the Netherlands provided information on the proportion of CHD- and stroke-related medicine expenditure.16,17 Hence, the average proportion across these two countries (13.3% for CHD and 6.8% for cerebrovascular disease) was applied to the total ATC-C expenditure in the remaining countries.
Social care costs
We included the costs relating to nursing and residential care home institutionalization, and care at home, both of which are included in OECD’s health accounting framework.18
For each country, the number of people aged 65 years or above living in nursing or residential home care was obtained from the European Commission.19 Using individual-patient-level data from SHARE, we estimated the country-specific probability of a respondent being institutionalized due to CVD.
Hours of home care for patients with CVD were estimated by adding the age- and sex-specific products of:
Prevalence of CVD in the population;14
Probability of a CVD patient receiving care at home;15
The weeks of care a patient with CVD received;15 and
Hours of care received.15
More details on the methodology and sources used to determine social care use and respective unit costs are presented in the Supplementary data online (see p13–15, ‘Social care costs’).
Informal care costs
Informal care costs were defined as the opportunity cost of unpaid care, i.e. the working or leisure time, valued in monetary terms that careers forgo to provide unpaid care for relatives/friends with CVD. Details of methods and data sources are presented in ‘Informal care’, Supplementary data online, p15–23. Briefly, hours of informal care for patients with CVD by adding the age- and sex-specific products of:
Prevalence of CVD in the population;14
Probability of a patient with CVD receiving informal care;15 and the
Hours of informal care received.15
The total hours of informal care provided to CVD patients by careers of working age and employed were then valued using the average hourly wage rate.2 For those careers in retirement or not working, hourly minimum wages (or the lowest decile, for countries with no minimum wage) were applied.2
Productivity costs due to mortality
Mortality costs were estimated as the lost earnings from death due to CVD whilst in productive age. The methods have been reported previously1 and are updated here for 2021. Briefly, we estimated these by using the age- and sex-specific number of CVD deaths to predict the working years lost at the time of death, adjusted for the age-, and gender-specific probability of being employed.2 Mortality costs were calculated using the product of the adjusted working years lost and the average annual earnings of female and male workers. As these costs would have been incurred in future years, all future lost earnings were discounted to present values using a 3.5% annual rate.
Productivity costs due to morbidity
Morbidity costs comprised costs associated with individuals taking sickness leave for a defined period-of-time (temporary absence), or due to individuals being declared incapacitated/disabled due to CVD (permanent absence). See ‘Morbidity losses’ in Supplementary data online (p23–24) for details of methods and data sources used. Briefly, temporary absence from work due to CVD was evaluated by obtaining country-specific overall annual days of sickness leave due to all conditions (irrespective of duration, whether these were reimbursed, or covered by statutory sick pay), and then applying the proportion of sickness leave that was attributable to CVD. For permanent absence from work due to CVD-related incapacity/disability, country-specific information on the numbers of working-age individuals receiving incapacity or disability benefits and not being able to work due to all conditions was obtained, to which we applied the proportion that was attributable to CVD.
The total number of working days lost due to CVD was then multiplied by average daily earnings. However, as absent workers are likely to be replaced after some time, we used the ‘friction period’ approach, where costs are only counted during the time it takes to replace a worker, and estimated that after 90 days an employee absent from work would be replaced.20 Therefore, for all permanent cases of disability/incapacity, or when the average spell of temporary sickness leave was more than 90 days, only the first 90 days of work absence were valued.
Statistical analysis
To explore variations in CVD-related health and social care costs between countries, we undertook a series of ordinary least squares (OLS) univariate regression analyses using national income, overall healthcare expenditure, CVD incidence (crude), CVD mortality (crude), and CVD-specific disability-adjusted life-years (DALYs) as explanatory variables. Diagnostic tests were performed for omitted variables (RESET test and link test) and heteroskedasticity (Breusch–Pagan test). An explanatory variable was considered significant if its P-value was lower than .05. All regression analyses were performed using StataMP version 15.0.
We also performed a sensitivity analysis to test some structural assumptions, including the effect of discounting productivity costs using rates of 0% and 5%, and of using the human capital approach, instead of the friction-period method, to estimate morbidity losses.
Results
Costs of cardiovascular diseases
Health and social care costs
Cardiovascular disease accounted for approximately 10 million hospital admissions in the EU, representing 22 admissions per 1000 population (Table 2). The number of hospital admissions varied considerably between countries, from 10 per 1000 population in Cyprus to 36 in Bulgaria. Per 1000 in the population, there were 656 visits to general practitioners and 356 with outpatient consultants. Of the total 5 million EU citizens living in long-term care nursing and residential care settings, 403 000 (8%) were institutionalized due to CVD. Per 1000 population, a total of 1229 h of formal home care was provided to people with CVD.
Table 2.
Resource units per 1000 population in the European Union, by country, 2021
| Country | Mortality losses | Morbidity losses | Informal care | Healthcare units | Social care units | ||||
|---|---|---|---|---|---|---|---|---|---|
| Working years lost | Working days lost | Hours of informal care | GP visits | Outpatient visits | A&E visits | Hospital admissions | Number institutionalized | Hours of home care | |
| Austria | 2.0 | 192 | 18 203 | 417 | 350 | 33 | 29 | 1.1 | 2756 |
| Belgium | 1.3 | 360 | 8946 | 394 | 228 | 21 | 21 | 1.0 | 1487 |
| Bulgaria | 11.6 | 287 | 23 005 | 829 | 236 | 26 | 36 | 0.2 | 1504 |
| Croatia | 3.0 | 170 | 24 869 | 459 | 216 | 26 | 25 | 0.6 | 403 |
| Cyprus | 2.8 | 103 | 8467 | 441 | 474 | 64 | 10 | 0.7 | 5211 |
| Czech Republic | 4.4 | 262 | 26 866 | 842 | 1132 | 15 | 22 | 1.1 | 389 |
| Denmark | 2.0 | 539 | 6776 | 1055 | 124 | 27 | 20 | 0.8 | 608 |
| Estonia | 6.4 | 132 | 23 365 | 1503 | 412 | 66 | 30 | 1.0 | 297 |
| Finland | 3.2 | 258 | 10 216 | 1124 | 345 | 98 | 24 | 0.9 | 457 |
| France | 1.2 | 390 | 7557 | 312 | 172 | 31 | 22 | 1.1 | 1110 |
| Germany | 2.9 | 277 | 19 683 | 869 | 582 | 31 | 34 | 1.0 | 1460 |
| Greece | 3.0 | 296 | 16 293 | 154 | 100 | 39 | 22 | 0.0 | 1335 |
| Hungary | 6.5 | 169 | 19 368 | 1124 | 828 | 14 | 23 | 3.1 | 737 |
| Ireland | 2.7 | 254 | 6476 | 324 | 48 | 21 | 17 | 0.6 | 1011 |
| Italy | 1.7 | 184 | 20 649 | 608 | 322 | 26 | 15 | 0.8 | 1360 |
| Latvia | 11.6 | 233 | 23 173 | 593 | 324 | 29 | 35 | 0.7 | 849 |
| Lithuania | 10.2 | 302 | 22 159 | 771 | 360 | 41 | 30 | 4.4 | 398 |
| Luxembourg | 1.5 | 103 | 6420 | 278 | 508 | 42 | 15 | 0.7 | 829 |
| Malta | 2.7 | 376 | 8700 | 63 | 65 | 17 | 15 | 0.3 | 398 |
| Netherlands | 1.9 | 315 | 8387 | 464 | 348 | 20 | 17 | 1.4 | 995 |
| Poland | 4.3 | 200 | 19 393 | 660 | 444 | 9 | 20 | 0.2 | 844 |
| Portugal | 2.8 | 278 | 17 687 | 236 | 174 | 54 | 13 | 0.4 | 2440 |
| Romania | 5.5 | 195 | 31 004 | 799 | 207 | 15 | 26 | 1.4 | 548 |
| Slovakia | 4.6 | 243 | 17 599 | 709 | 950 | 14 | 23 | 0.4 | 623 |
| Slovenia | 1.6 | 202 | 16 110 | 562 | 303 | 33 | 19 | 1.5 | 306 |
| Spain | 1.7 | 299 | 16 151 | 1024 | 184 | 44 | 14 | 0.4 | 1627 |
| Sweden | 2.4 | 369 | 8882 | 226 | 177 | 25 | 17 | 1.1 | 707 |
| Average EU | 2.8 | 276 | 16 712 | 656 | 356 | 29 | 22 | 0.9 | 1229 |
Cardiovascular disease cost the EU-health and social care systems approximately €155 billion in 2021 (Table 3), accounting for 11% of total healthcare expenditure in the EU (Table 4). The percentage of CVD-related care expenditure varied significantly between countries, from 6% in Denmark to 19% in Hungary. The major component of CVD-related care costs was hospital care, which accounted for €79 billion, of which €30 billion (38%) was accounted for the costs of 12 CVD-related procedures derived from the ESC Atlas of Cardiology (see Supplementary data online, Table A12, p35). Overall, hospital care represented 51% of care costs. Costs of CVD medications accounted for €31 billion (20%) of care costs, followed by nursing care home institutionalization at €15 billion (9%).
Table 3.
Costs of cardiovascular disease (€ million) in the European Union, by country, 2021
| Country | Health care | Social care | Total health and social care | Informal care | Productivity losses | Total costs | ||||||
|---|---|---|---|---|---|---|---|---|---|---|---|---|
| Primary care | Outpatient care | A&E | Hospital carea | Medications | Institutionalization | Home care | Morbidity | Mortality | ||||
| Austria | 119 | 117 | 95 | 2609 | 570 | 656 | 976 | 5142 | 2246 | 231 | 847 | 8466 |
| Belgium | 123 | 107 | 22 | 2417 | 568 | 300 | 404 | 3940 | 1547 | 671 | 639 | 6797 |
| Bulgaria | 57 | 38 | 6 | 279 | 363 | 9 | 88 | 839 | 493 | 68 | 583 | 1983 |
| Croatia | 32 | 47 | 9 | 157 | 117 | 25 | 19 | 406 | 507 | 36 | 159 | 1108 |
| Cyprus | 6 | 14 | 3 | 88 | 32 | 6 | 37 | 186 | 54 | 8 | 61 | 309 |
| Czech Republic | 133 | 332 | 8 | 1369 | 384 | 220 | 41 | 2487 | 1813 | 195 | 734 | 5228 |
| Denmark | 172 | 70 | 18 | 1109 | 141 | 315 | 175 | 2001 | 979 | 757 | 656 | 4392 |
| Estonia | 43 | 45 | 8 | 105 | 35 | 11 | 4 | 250 | 188 | 12 | 117 | 568 |
| Finland | 505 | 243 | 116 | 820 | 143 | 560 | 92 | 2479 | 937 | 233 | 737 | 4386 |
| France | 528 | 779 | 317 | 14 626 | 4823 | 1813 | 1404 | 24 290 | 7157 | 3678 | 3019 | 38 144 |
| Germany | 2251 | 3565 | 234 | 22 323 | 8481 | 5044 | 2967 | 44 865 | 25 352 | 3510 | 9674 | 83 400 |
| Greece | 33 | 54 | 22 | 1079 | 829 | 6 | 214 | 2237 | 1003 | 234 | 841 | 4315 |
| Hungary | 75 | 97 | 6 | 800 | 567 | 217 | 86 | 1848 | 852 | 94 | 827 | 3621 |
| Ireland | 78 | 40 | 31 | 1312 | 257 | 201 | 122 | 2041 | 546 | 245 | 610 | 3442 |
| Italy | 766 | 2508 | 386 | 12 480 | 5194 | 1405 | 1008 | 23 747 | 13 734 | 1212 | 3285 | 41 978 |
| Latvia | 9 | 11 | 2 | 147 | 57 | 10 | 16 | 252 | 205 | 27 | 266 | 750 |
| Lithuania | 13 | 38 | 4 | 268 | 49 | 177 | 11 | 559 | 406 | 59 | 414 | 1439 |
| Luxembourg | 9 | 23 | 3 | 144 | 43 | 20 | 26 | 267 | 75 | 13 | 57 | 413 |
| Malta | 0 | 2 | 1 | 44 | 44 | 3 | 2 | 95 | 37 | 20 | 31 | 183 |
| Netherlands | 437 | 614 | 98 | 3921 | 907 | 1691 | 1001 | 8670 | 2100 | 835 | 1454 | 13 059 |
| Poland | 175 | 371 | 14 | 3381 | 1727 | 110 | 350 | 6127 | 4466 | 451 | 2135 | 13 179 |
| Portugal | 75 | 125 | 63 | 758 | 557 | 42 | 183 | 1803 | 1245 | 183 | 540 | 3772 |
| Romania | 140 | 83 | 11 | 1027 | 724 | 154 | 80 | 2220 | 2806 | 180 | 1216 | 6421 |
| Slovakia | 75 | 140 | 3 | 446 | 215 | 25 | 38 | 942 | 562 | 91 | 368 | 1964 |
| Slovenia | 22 | 77 | 9 | 363 | 112 | 37 | 12 | 632 | 292 | 37 | 87 | 1048 |
| Spain | 1978 | 745 | 364 | 4768 | 3630 | 453 | 1126 | 13 063 | 7434 | 1315 | 2147 | 23 960 |
| Sweden | 116 | 418 | 72 | 1818 | 294 | 1072 | 209 | 3998 | 1608 | 658 | 948 | 7211 |
| TOTAL | 7971 | 10 702 | 1924 | 78 657 | 30 862 | 14 582 | 10 691 | 155 388 | 78 644 | 15 054 | 32 451 | 281 537 |
aDay cases and hospital admissions with overnight stay.
Table 4.
Health and social care costs of cardiovascular disease-related diseases in the European Union, by country, 2021 (€)
| Country | CVDs | CHD | Cerebrovascular diseases | ||||||
|---|---|---|---|---|---|---|---|---|---|
| Cost per capita | Cost per capita PPP | % of total expenditure | Cost per capita | Cost per capita PPP | % of total expenditure | Cost per capita | Cost per capita PPP | % of total expenditure | |
| Austria | 576 | 505 | 11.8% | 109 | 96 | 2.2% | 212 | 186 | 4.3% |
| Belgium | 341 | 307 | 7.8% | 69 | 62 | 1.6% | 104 | 94 | 2.4% |
| Bulgaria | 121 | 219 | 16.1% | 21 | 38 | 2.8% | 26 | 48 | 3.5% |
| Croatia | 101 | 154 | 10.4% | 28 | 43 | 2.9% | 20 | 30 | 2.0% |
| Cyprus | 207 | 229 | 10.6% | 55 | 60 | 2.8% | 63 | 69 | 3.2% |
| Czech Republic | 232 | 310 | 12.5% | 50 | 67 | 2.7% | 47 | 63 | 2.5% |
| Denmark | 343 | 256 | 6.1% | 53 | 40 | 0.9% | 128 | 96 | 2.3% |
| Estonia | 188 | 229 | 12.0% | 68 | 83 | 4.3% | 29 | 35 | 1.8% |
| Finland | 448 | 359 | 10.8% | 71 | 57 | 1.7% | 165 | 133 | 4.0% |
| France | 359 | 331 | 8.6% | 64 | 59 | 1.5% | 84 | 77 | 2.0% |
| Germany | 540 | 486 | 10.4% | 93 | 83 | 1.8% | 152 | 137 | 2.9% |
| Greece | 210 | 255 | 14.2% | 50 | 61 | 3.4% | 40 | 48 | 2.7% |
| Hungary | 190 | 292 | 18.5% | 31 | 47 | 3.0% | 49 | 75 | 4.8% |
| Ireland | 408 | 340 | 7.7% | 81 | 68 | 1.5% | 156 | 130 | 2.9% |
| Italy | 401 | 410 | 14.9% | 94 | 96 | 3.5% | 84 | 86 | 3.1% |
| Latvia | 133 | 173 | 11.5% | 53 | 69 | 4.6% | 23 | 30 | 2.0% |
| Lithuania | 200 | 290 | 15.0% | 59 | 86 | 4.4% | 80 | 116 | 6.0% |
| Luxembourg | 421 | 325 | 7.2% | 61 | 47 | 1.0% | 108 | 84 | 1.9% |
| Malta | 185 | 212 | 6.7% | 37 | 42 | 1.3% | 26 | 30 | 0.9% |
| Netherlands | 496 | 427 | 9.7% | 83 | 72 | 1.6% | 204 | 176 | 4.0% |
| Poland | 162 | 269 | 17.9% | 44 | 73 | 4.9% | 23 | 39 | 2.6% |
| Portugal | 175 | 205 | 8.5% | 35 | 41 | 1.7% | 47 | 55 | 2.3% |
| Romania | 116 | 220 | 16.2% | 25 | 48 | 3.5% | 24 | 46 | 3.3% |
| Slovakia | 173 | 215 | 14.2% | 36 | 45 | 2.9% | 29 | 36 | 2.4% |
| Slovenia | 300 | 353 | 14.2% | 78 | 92 | 3.7% | 51 | 60 | 2.4% |
| Spain | 276 | 292 | 10.9% | 55 | 58 | 2.2% | 59 | 62 | 2.3% |
| Sweden | 385 | 297 | 7.3% | 51 | 40 | 1.0% | 172 | 133 | 3.3% |
| TOTAL | 347 | 10.6% | 67 | 2.1% | 92 | 2.8% | |||
Overall, CVD represented an annual health and social care cost of €347 per EU citizen (Table 4, Figure 1). The amount spent on health and social care for people with CVD varied widely across the 27 countries. After adjusting for price differentials using PPP, costs per person varied over three-fold between the country with the lowest costs (Croatia €154) and the one with the highest costs (Austria €505). The results of the ordinary least-squares regression showed a strong positive relation between CVD-related health/social care costs and national income (P < .001) and health expenditure (P < .001) (see Supplementary data online, Figures A1 and A2, p36). A negative association was identified with mortality (P = .001) and DALYs (P < .001) (see Supplementary data online, Figures A3 and A4, p37). No significant association was identified between CVD-related health and social care costs and CVD incidence (P = .09).
Figure 1.

Cardiovascular disease-related health and social care costs per capita, adjusted for price differentials
Informal care
A total of 7.5 billion hours of unpaid care by relatives/friends were provided to people whose care could be directly attributable to CVD, representing a cost of €79 billion across the EU (Table 3). Per 1000 population, a total of 16 700 h were provided in the care of patients with CVD, ranging from 6420 in Luxembourg to 31 004 in Romania (Table 2).
Productivity losses
In 2021, there were a total of 1.7 million deaths due to CVD across the EU, representing 1.3 million working-years lost. Per 1000 population, this accounted for 2.8 years of productive life lost (Table 2), with the lowest number of years lost being in France (1.2) and the highest in Bulgaria and Latvia (11.6). Overall, discounting future losses at an annual 3.5% discount rate, premature mortality due to CVD generated productivity losses of €32 billion. If left undiscounted, these increased to €42 billion, and discounted at a rate of 5% these decreased to €30 billion.
There were 256 million working-days lost because of CVD morbidity (i.e. 571 days per 1000 population when unadjusted), representing a cost of €30 billion. However, when adjusted using the friction period, this estimate fell to €15 billion (Table 3).
Total societal costs
Overall, CVD is estimated to have cost the EU economy €282 billion in 2021 (Table 3). Of the total cost of CVD, 46% of total costs was due to healthcare, 9% was due to social care, 28% due to informal care, and 17% due to productivity losses (Figure 2). On a per capita basis, this represented a cost of €630 per EU citizen. The economic cost of CVD varied considerably across the 27 countries in the EU after adjustment for price differentials, ranging from €381 in Cyprus to €903 in Germany (Figure 3).
Figure 2.

Distribution of cardiovascular disease-related total costs across cost categories
Figure 3.

Cardiovascular disease-related total costs per capita, adjusted for price differentials
Costs of coronary heart disease and cerebrovascular disease
Coronary heart disease
Coronary heart disease cost the health and social care systems of the EU €30 billion in 2021 (Table 5). Per capita, this represented a cost of €67 (Table 4). The major component of health and social care costs was hospital care (€19 billion, 64%), followed by pharmaceutical expenditure (€4 billion, 13%). Using data from SHARE we did not find that CHD increased significantly the probability of institutionalization (see ‘Social care costs’, Supplementary data online), therefore, the only social care costs included were those of home care (€1.4 billion, 5%).
Table 5.
Costs of coronary heart disease (€ million) in the European Union, by country, 2021
| Country | Health care | Social care | Total health & social care | Informal care | Productivity losses | Total costs | ||||||
|---|---|---|---|---|---|---|---|---|---|---|---|---|
| Primary care | Outpatient care | A&E | Hospital carea | Medications | Institutionalization | Home care | Morbidity | Mortality | ||||
| Austria | 29 | 28 | 32 | 609 | 76 | 0 | 203 | 977 | 852 | 104 | 451 | 2385 |
| Belgium | 40 | 35 | 7 | 640 | 76 | 0 | 0 | 798 | 502 | 176 | 241 | 1717 |
| Bulgaria | 18 | 12 | 2 | 41 | 48 | 0 | 26 | 147 | 153 | 18 | 157 | 474 |
| Croatia | 13 | 19 | 4 | 58 | 16 | 0 | 3 | 114 | 205 | 9 | 71 | 399 |
| Cyprus | 2 | 4 | 1 | 29 | 4 | 0 | 10 | 49 | 18 | 3 | 36 | 107 |
| Czech Republic | 44 | 109 | 3 | 320 | 51 | 0 | 7 | 535 | 935 | 28 | 299 | 1797 |
| Denmark | 42 | 17 | 6 | 227 | 19 | 0 | 0 | 310 | 317 | 117 | 256 | 1000 |
| Estonia | 20 | 20 | 3 | 41 | 5 | 0 | 1 | 90 | 90 | 0 | 35 | 215 |
| Finland | 125 | 60 | 29 | 155 | 19 | 0 | 5 | 392 | 393 | 36 | 305 | 1127 |
| France | 153 | 225 | 27 | 3248 | 643 | 0 | 21 | 4316 | 2298 | 1682 | 1075 | 9370 |
| Germany | 566 | 895 | 59 | 4943 | 899 | 0 | 348 | 7709 | 9583 | 873 | 4349 | 22 514 |
| Greece | 12 | 19 | 8 | 342 | 111 | 0 | 41 | 533 | 313 | 88 | 491 | 1425 |
| Hungary | 25 | 32 | 2 | 154 | 76 | 0 | 10 | 299 | 414 | 23 | 362 | 1098 |
| Ireland | 28 | 14 | 11 | 288 | 34 | 0 | 32 | 407 | 238 | 65 | 352 | 1062 |
| Italy | 188 | 610 | 92 | 3738 | 693 | 0 | 229 | 5551 | 5025 | 331 | 1334 | 12 241 |
| Latvia | 4 | 5 | 1 | 77 | 8 | 0 | 6 | 100 | 92 | 8 | 105 | 306 |
| Lithuania | 4 | 13 | 1 | 137 | 6 | 0 | 4 | 166 | 236 | 16 | 208 | 627 |
| Luxembourg | 2 | 4 | 1 | 24 | 6 | 0 | 2 | 39 | 23 | 3 | 18 | 82 |
| Malta | 0 | 0 | 0 | 12 | 6 | 0 | 0 | 19 | 18 | 5 | 20 | 63 |
| Netherlands | 132 | 185 | 30 | 967 | 146 | 0 | 0 | 1459 | 688 | 262 | 515 | 2924 |
| Poland | 44 | 94 | 4 | 1194 | 230 | 0 | 104 | 1670 | 1804 | 94 | 841 | 4409 |
| Portugal | 20 | 33 | 17 | 181 | 74 | 0 | 33 | 357 | 297 | 45 | 245 | 944 |
| Romania | 48 | 28 | 4 | 283 | 97 | 0 | 25 | 485 | 1087 | 25 | 509 | 2106 |
| Slovakia | 20 | 38 | 1 | 97 | 29 | 0 | 11 | 196 | 312 | 13 | 175 | 696 |
| Slovenia | 7 | 24 | 3 | 112 | 15 | 0 | 3 | 165 | 108 | 8 | 49 | 330 |
| Spain | 606 | 224 | 109 | 934 | 484 | 0 | 250 | 2608 | 2419 | 305 | 861 | 6192 |
| Sweden | 25 | 91 | 16 | 347 | 39 | 0 | 15 | 533 | 547 | 142 | 433 | 1656 |
| TOTAL | 2217 | 2840 | 469 | 19 197 | 3908 | 0 | 1391 | 30 022 | 28 968 | 4480 | 13 796 | 77 266 |
aDay cases and hospital admissions with overnight stay.
Over 2.7 billion hours of informal care were provided to CHD at a cost of €29 billion (Table 5). Approximately half a million working years were lost because of CHD mortality, accounting for 40% of all working years lost because of CVD-related deaths, and a cost of €14 billion (Table 5). Additionally, after adjustment for the friction-period, 36 million working days were lost because of CHD, representing a cost of €4 billion.
Overall, CHD was estimated to have cost the EU €77 billion in 2021: over one-quarter of the overall cost of CVD. This represented a cost of €173 per EU citizen, which after adjusting for price differentials ranged from €100 in Luxembourg to €325 in Lithuania (Table 4). Of the total cost of CHD, 37% of costs were due to healthcare, 2% to social care, 24% to productivity losses, and 37% to informal care.
Cerebrovascular disease
Cerebrovascular disease cost the health and social care systems of the EU €41 billion in 2021 (Table 6), representing a cost of €92 per citizen (Table 4). The major component of health and social care costs was long-term institutionalization (€15 billion, 36%), followed by hospital care (€13 billion, 32%) and home care (€9 billion, 23%).
Table 6.
Costs of cerebrovascular disease (€ million) in the European Union, by country, 2021
| Country | Health care | Social care | Total health & social care | Informal care | Productivity losses | Total costs | ||||||
|---|---|---|---|---|---|---|---|---|---|---|---|---|
| Primary care | Outpatient care | A&E | Hospital carea | Medications | Institutionalization | Home care | Morbidity | Mortality | ||||
| Austria | 10 | 10 | 11 | 391 | 39 | 656 | 772 | 1891 | 647 | 70 | 112 | 2720 |
| Belgium | 11 | 10 | 2 | 441 | 39 | 300 | 404 | 1206 | 540 | 122 | 126 | 1994 |
| Bulgaria | 7 | 5 | 1 | 74 | 25 | 9 | 62 | 182 | 209 | 13 | 106 | 510 |
| Croatia | 4 | 5 | 1 | 21 | 8 | 25 | 16 | 80 | 159 | 8 | 30 | 277 |
| Cyprus | 1 | 1 | 0 | 18 | 2 | 6 | 28 | 56 | 17 | 1 | 8 | 83 |
| Czech Republic | 10 | 25 | 1 | 188 | 26 | 220 | 34 | 504 | 508 | 12 | 99 | 1123 |
| Denmark | 13 | 5 | 2 | 230 | 10 | 315 | 175 | 750 | 342 | 39 | 139 | 1270 |
| Estonia | 3 | 3 | 0 | 16 | 2 | 11 | 3 | 38 | 36 | 4 | 22 | 99 |
| Finland | 45 | 22 | 10 | 180 | 10 | 560 | 88 | 915 | 330 | 94 | 136 | 1476 |
| France | 44 | 65 | 27 | 1997 | 330 | 1813 | 1383 | 5659 | 2566 | 849 | 638 | 9712 |
| Germany | 176 | 280 | 18 | 3820 | 706 | 5044 | 2620 | 12 664 | 7430 | 454 | 1443 | 21 991 |
| Greece | 4 | 7 | 3 | 174 | 57 | 6 | 172 | 423 | 435 | 31 | 136 | 1025 |
| Hungary | 7 | 9 | 1 | 128 | 39 | 217 | 75 | 477 | 264 | 20 | 136 | 897 |
| Ireland | 7 | 4 | 3 | 457 | 18 | 201 | 90 | 779 | 192 | 45 | 81 | 1097 |
| Italy | 45 | 150 | 24 | 2231 | 355 | 1405 | 779 | 4988 | 4776 | 238 | 636 | 10 639 |
| Latvia | 1 | 1 | 0 | 18 | 4 | 10 | 10 | 43 | 79 | 6 | 51 | 179 |
| Lithuania | 1 | 3 | 0 | 32 | 3 | 177 | 7 | 224 | 118 | 12 | 73 | 427 |
| Luxembourg | 1 | 1 | 0 | 20 | 3 | 20 | 24 | 69 | 24 | 2 | 11 | 106 |
| Malta | 0 | 0 | 0 | 5 | 3 | 3 | 2 | 13 | 11 | 3 | 3 | 30 |
| Netherlands | 34 | 48 | 8 | 738 | 48 | 1691 | 1001 | 3568 | 759 | 142 | 309 | 4777 |
| Poland | 15 | 33 | 1 | 360 | 118 | 110 | 246 | 883 | 1402 | 106 | 462 | 2854 |
| Portugal | 9 | 15 | 8 | 219 | 38 | 42 | 150 | 482 | 522 | 35 | 131 | 1170 |
| Romania | 17 | 10 | 1 | 174 | 49 | 154 | 55 | 460 | 996 | 34 | 233 | 1723 |
| Slovakia | 7 | 13 | 0 | 71 | 15 | 25 | 27 | 158 | 168 | 6 | 64 | 396 |
| Slovenia | 1 | 5 | 1 | 48 | 8 | 37 | 8 | 108 | 88 | 9 | 15 | 220 |
| Spain | 180 | 68 | 33 | 936 | 248 | 453 | 875 | 2793 | 2730 | 201 | 357 | 6081 |
| Sweden | 10 | 36 | 6 | 448 | 20 | 1072 | 194 | 1785 | 562 | 164 | 162 | 2674 |
| TOTAL | 663 | 834 | 162 | 13 436 | 2222 | 14 582 | 9300 | 41 198 | 25 911 | 2720 | 5720 | 75 549 |
aDay cases and hospital admissions with overnight stay.
Over 2.5 billion hours of care were provided to cerebrovascular disease patients, which was estimated to cost the EU €26 billion (Table 6). Approximately 232 000 working years were lost due to cerebrovascular disease, accounting for 18% of all working years lost because of CVD-related deaths, and representing a cost of €6 billion (Table 6). Additionally, after adjustment for the friction-period, 23 million working days were lost because of cerebrovascular disease morbidity, representing a cost of €3 billion.
Overall, cerebrovascular disease was estimated to cost the EU €76 billion in 2021, which like CHD, accounted for over a quarter of the overall cost of CVD. Per capita, this equated to €169 per citizen in the EU, ranging from €66 in Malta to €267 in Austria, after adjusting for price differentials (Table 4). As a proportion of CVD costs, the contribution of cerebrovascular disease was lowest in Malta (16%) and highest in Sweden (37%). Of the total cost of cerebrovascular disease, informal care accounted for the biggest component (34%), followed by social care (32%), with health care accounting for 23% and productivity losses for the remaining 11%.
Discussion
While previous studies have assessed the overall costs of CVD in the EU,4,5 our study is the first to use ESC Atlas data and patient-level data from all EU countries to generate more precise cost estimates for CVD in the EU. We estimated the total cost of CVD in the EU at €282 billion in 2021, of which €155 billion (or €347 per citizen) were incurred by EU-health- and social-care systems. However, 45% of the economic burden of CVD was incurred in non-health-care areas, with unpaid care by relatives/friends accounting for almost €79 billion and lost productivity attributable to early death or work absence through illness or disability accounting for another €48 billion. Although the economic cost of CHD and cerebrovascular disease varied between EU countries, costs for both these diseases had a similar overall burden (€77 billion and €76 billion, respectively) (Structured Graphical Abstract). Unfortunately, given that SHARE and many national sources did not provide for other important and common CVD conditions, such as peripheral vascular disease, arrhythmias, and heart failure, we were not able to provide reliable cost estimates of these conditions.
Hospital care accounted for 60% of CVD-related healthcare costs, followed by drug expenditure, outpatient care, primary care, and emergency care. Although a cost of €2 billion for CVD-specific emergency visits across Europe might seem high in absolute terms, these costs represented <2% of total CVD-related healthcare costs. The components of social care included in this study, i.e. long-term care institutionalization in nursing care homes or care at home, which are now included in national accounts as healthcare expenditure,18 also represented a significant cost across the EU at €25 billion. Our results appear to suggest that countries with the highest per capita CVD health and social care costs also had the lowest levels of CVD-related morbidity (as measured using DALYs). However, any associations should be treated with caution as they might be biased by a country’s wealth, levels of education, healthcare organization, and social characteristics, such as diet or city planning.21
In the USA, the cost of CVD, excluding long-term and informal care as well as morbidity losses, was estimated at US$407 (€344) billion in 2019,22 of which $251 (€212) billion were direct medical costs and $156 (€132) billion were mortality costs. The USA devoted $766 per person (€520 [adjusted for price differentials]) to CVD-related health-care in 2019—a comparable level to Germany (€486) in 2021 and about €173 more per citizen than the EU as a whole after adjustment for price differentials. Results from the USA, also show that as a proportion of total healthcare costs, the proportion accounted by CVD was similar, 12% in the USA compared to 11% in the EU. This would, therefore, suggest that the higher absolute healthcare costs of CVD in the USA simply reflect the fact that considerably higher spending is afforded to healthcare (17.8% of gross domestic product spent on healthcare as opposed to 10% in the EU2 rather than differences in priorities or health needs of the population).
The costs of CVD have also been evaluated, using the same methodological framework, in the past.4,5 In 2006, we published the costs of CVD for the 25 countries in the EU.4 Since then, the composition of the EU has changed, with three countries joining (Bulgaria, Croatia, and Romania) and the UK leaving, all of which are reflected in this study. In addition, the data availability both at the national and European level has improved greatly. For example, all countries in the EU are now represented in SHARE15 allowing us to apportion, for every country, the proportion of total health, social, and informal care resources use to CVD, CHD, and cerebrovascular disease. In addition, through collaboration with the ESC, we were able to use ESC Atlas data and expert knowledge in each country to obtain CVD-specific unit costs with which to value resource use, and in particular, inpatient stays.
Despite the limitations of previous exercises,2–8,4–10 meaningful comparisons can still be made. For example, it appears that the proportion of health care accounted by CVD, which since 2013 also includes long-term institutionalized care and home care,19 has remained relatively constant (12% in 2003% and 11% in 2021). In addition, the considerable differences between countries identified in the per capita costs of CVD healthcare costs in 2003 have narrowed substantially in 2021. Unadjusted for price differentials, the difference between the country with the lowest direct care cost for CVD and the highest per capita cost has decreased from 19-fold (€22 in Malta vs. €423 in Germany) in 2003, to <six-fold (€101 in Croatia vs. €576 in Austria) in 2021.4
Our analysis shows that cost differences between European countries can be partly explained by differences in gross domestic product and health and social care system configuration (e.g. the proportion of the total institutionalised population aged ≥65 years varied between 0.2% in Greece to 15.9% in Lithuania).19 Given that European countries were still in the midst of the COVID-19 pandemic in 2021, the pandemic undoubtedly had an impact on CVD care, outcomes and therefore costs. However, the size and direction of this impact on the overall costs of CVD might be difficult to judge. Evidence showed that elective admissions for CVD, such as ablations and pacemaker and defibrillator implantations were reduced by up to 70% compared to pre-pandemic levels.23 At the same time there was evidence of increased emergency admissions for acute CVD events.24 In addition, the big falls in CVD-related elective admissions during 2020, would have resulted in increases in long-term complications and subsequent death, resulting in higher productivity losses, with a high probability that these would have started manifesting by 2021.25
Our understanding of variations in expenditures needs to improve. Presentation of data showing differences in costs across countries should provide a solid foundation for further research and discussion, but we cannot explain all the patterns identified. Our estimates, if repeated for other conditions, are important and useful to decision makers and health-policy planners, because they can inform decisions about the allocation of resources to service provision, prevention strategies, and research funding.26 For example, in 2012, using the same methodological framework, we found the healthcare costs of cancer to account for 5% of total EU-healthcare expenditure,7 which is considerably lower than the impact of CVD. However, these estimates for cancer are now outdated and might not reflect recent major advances in cancer therapy.27 For example, in 2015 cancer care accounted for 7% of German total health care costs, which over a period of just 5 years, increased to over 10% by 2020.16 Therefore, determining the relative costs of diseases across the EU could help inform the health priorities as well as the research priorities of EU governmental research programmes such as Horizon Europe.28,29
Individual EU-member countries have also provided estimates of the costs of CVD in recent years16,17 In the Netherlands,17 the total healthcare costs of CVD in the Netherlands were estimated at €7 billion in 2019, representing 7% of healthcare costs. For 2021, we found that the comparable total costs of healthcare were €9 billion, or 10% of healthcare costs. In a similar study in Germany, the healthcare costs (including social care costs of long-term institutionalization and home care) of CVD were found to be €55 billion in 2020, €10 billion more than in our study.16 Differences in this estimate include our omission of: €3 billion in health administration costs; €2 billion in household costs; €2 billion in prevention and rehabilitative care; and a further €2 billion in healthcare retailing. As a proportion of healthcare expenditure, German official data estimated that 13% of total health costs were due to CVD compared to 10% in this study.
Differences between studies could not only be due to different categories of cost being included, but also the use of different methodologies. For example, for productivity costs we found the results varied considerably according to the methodology used. For mortality costs, costs ranged from €30 billion to €42 billion depending on the discount rate used, whereas morbidity costs doubled to €30 billion (up from €15 billion) if costs were not adjusted for the friction period. It is therefore paramount that studies evaluating the costs of disease across time or conditions use the same methodology throughout.
Despite much better access to healthcare data, and the inclusion of social care data our study had some limitations. Although great care was taken to price hospital admissions using country- and CVD-specific unit costs, we were hampered by the quality and availability of unit cost data. For many countries, hospitalization unit costs were based on diagnosis related groups (DRG) tariffs, reflecting policy incentives or provider reimbursement, rather than the actual costs of performing a particular CVD procedure or treating a CVD condition.30 Therefore, to allow comparability across countries and to better reflect the actual costs of providing CVD-specific care, adjustments, as detailed in the Supplementary data online, had to be made. For social care, country-specific unit costs were derived from a range of differing sources, depending on country, from national compendiums of costs, costs borne by local government, private care home pricing and published studies.
Although we were able to apportion non-hospital health, social and informal care overall resource use to CVD, CHD and cerebrovascular disease using individual-patient-level data including patients from all 27 EU countries, this was only possible for those above the age of 45 years. For resource use for younger patients, we had to apportion total care usage using diagnoses of hospital discharges. However, given that CVD is a disease most common in older age, we do not believe these assumptions will significantly alter the overall results.
We aimed to standardize data collection and use the same international sources to obtain estimates of aggregate and country-specific resource use, namely EUROSTAT, SHARE, and OECD. Different country-specific terminologies and data collection methods are likely to play a role in the observed differences in costs. For example, CVD-related pharmaceutical expenditures were derived from OECD estimates for the majority of countries. However, estimates differed with regards to whether drugs dispensed in hospital, non-reimbursed drugs, over-the counter medicines, and value added tax (VAT) were included. Although we were able to adjust for some estimates, such as the proportion reimbursed by compulsory health insurance companies or State-run healthcare systems,2 it was not possible to adjust for others.
Finally, as described above, our estimates are likely to be underestimates as we were not able to apportion all health and social care costs encompassed in the National Systems of Health Accounts. These include: health administration; household costs; prevention and rehabilitative care; and healthcare retailing. For Germany, for example, these costs accounted for €9 billion, or 14% of the total healthcare costs of CVD.16
Conclusions
Our study sheds light on the significant consequences of CVD on various sectors of the European economy. The data we present not only emphasize the magnitude of the economic burden caused by CVD but also provide valuable insights for public health decision makers. By identifying the specific areas that require targeted interventions, our findings can guide policymakers in implementing strategic measures to alleviate the economic burden of CVD. Furthermore, our study underscores the need to address variations in healthcare provision and improve accessibility to care across EU countries. Equipped with this knowledge, policymakers can devise effective strategies to ensure equitable access to high-quality care across the EU. Lastly, our research findings can aid in directing governmental research expenditure across the EU towards areas that hold the greatest potential for advancing the prevention, diagnosis, and treatment of CVD, further reducing its economic impact on the European Union.
Supplementary Material
Acknowledgements
This work was supported by an unrestricted grant from the European Society of Cardiology (ESC). The opinions and conclusions in this study are not necessarily those of the European Society of Cardiology. We are grateful to the three anonymous reviewers who provided feedback and substantially strengthened the quality of this manuscript.
Contributor Information
Ramon Luengo-Fernandez, Health Economics Research Centre, Nuffield Department of Population Health, University of Oxford, Old Road Campus, Oxford OX3 7LF, UK.
Marjan Walli-Attaei, Health Economics Research Centre, Nuffield Department of Population Health, University of Oxford, Old Road Campus, Oxford OX3 7LF, UK.
Alastair Gray, Health Economics Research Centre, Nuffield Department of Population Health, University of Oxford, Old Road Campus, Oxford OX3 7LF, UK.
Aleksandra Torbica, Centre for Research on Health and Social Care Management (CERGAS), Bocconi University, Milan, Italy.
Aldo P Maggioni, ANMCO Research Center-Heart Care Foundation, Firenze, Italy.
Radu Huculeci, European Society of Cardiology, European Heart Agency, Brussels, Belgium.
Firoozeh Bairami, European Society of Cardiology, European Heart Agency, Brussels, Belgium.
Victor Aboyans, Department of Cardiology, Dupuytren University Hospital, and EpiMaCT, Inserm1098/IRD270, Limoges University, Limoges, France.
Adam D Timmis, William Harvey Research Institute, Queen Mary University London, London, UK.
Panos Vardas, European Society of Cardiology, European Heart Agency, Brussels, Belgium; Biomedical Research Foundation Academy of Athens and Hygeia Hospitals Group, HHG, Athens, Greece.
Jose Leal, Health Economics Research Centre, Nuffield Department of Population Health, University of Oxford, Old Road Campus, Oxford OX3 7LF, UK.
Supplementary data
Supplementary data are available at European Heart Journal online.
Declarations
Disclosure of Interest
J.L., A.G., and R.L.-F. report research grants from the ESC. A.D.T. has stock in two start-up companies, receiving no income from these investments. A.T. has a consultancy agreement with ESC. A.P.M. reports payments from Astra Zeneca and Bayer for participation in study committees in areas outside the present work. P.V. reports consulting fees from Servier International, Hygeia Hosptial Group and ESC. R.H. and M.L. report no disclosures.
Data Availability
The data underlying this article will be shared on reasonable request to the corresponding author.
Funding
This work was supported by an unrestricted grant from the European Society of Cardiology (ESC).
Ethical Approval
Ethical approval was not required.
Pre-registered Clinical Trial Number
Not applicable.
References
- 1. Luengo-Fernandez R, Little M, Gray A, Torbica A, Maggioni AP, Huculeci R, et al. Cardiovascular disease burden due to productivity losses in European society of cardiology countries. Eur Heart J Qual Care Clin Outcomes 2023:qcad031. 10.1093/ehjqcco/qcad031, preprint: not peer reviewed. [DOI] [PMC free article] [PubMed] [Google Scholar]
- 2. EUROSTAT. Database. Available from: https://ec.europa.eu/eurostat/web/main/data/database (accessed 7 Jul 2023).
- 3. Kouwenhoven-Pasmooij TA, Burdorf A, Roos-Hesselink JW, Hunink MG, Robroek SJ. Cardiovascular disease, diabetes and early exit from paid employment in Europe; the impact of work-related factors. Int J Cardiol 2016;215:332–7. 10.1016/j.ijcard.2016.04.090 [DOI] [PubMed] [Google Scholar]
- 4. Leal J, Luengo-Fernández R, Gray A, Petersen S, Rayner M. Economic burden of cardiovascular diseases in the enlarged European union. Eur Heart J 2006;27:1610–9. 10.1093/eurheartj/ehi733 [DOI] [PubMed] [Google Scholar]
- 5. Wilkins E, Wilson L, Wickramasinghe K, Bhatnagar P, Leal J, Luengo-Fernandez R, et al. European Cardiovascular Disease Statistics 2017. European Heart Network, 2017. [Google Scholar]
- 6. Burns R, Leal J, Sullivan R, Luengo-Fernandez R. Economic burden of malignant blood disorders across Europe: a population-based cost analysis. Lancet Haematol 2016;3:e362–370. 10.1016/s2352-3026(16)30062-x [DOI] [PubMed] [Google Scholar]
- 7. Leal J, Luengo-Fernandez R, Sullivan R, Witjes JA. Economic burden of bladder cancer across the European Union. Eur Urol 2016;69:438–47. 10.1016/j.eururo.2015.10.024 [DOI] [PubMed] [Google Scholar]
- 8. Luengo-Fernandez R, Burns R, Leal J. Economic burden of non-malignant blood disorders across Europe: a population-based cost study. Lancet Haematol 2016;3:e371–378. 10.1016/s2352-3026(16)30061-8 [DOI] [PubMed] [Google Scholar]
- 9. Luengo-Fernandez R, Leal J, Gray A, Sullivan R. Economic burden of cancer across the European union: a population-based cost analysis. Lancet Oncol 2013;14:1165–74. 10.1016/s1470-2045(13)70442-x [DOI] [PubMed] [Google Scholar]
- 10. Luengo-Fernandez R, Leal J, Gray AM. Cost of dementia in the pre-enlargement countries of the European union. J Alzheimers Dis 2011;27:187–96. 10.3233/jad-2011-102019 [DOI] [PubMed] [Google Scholar]
- 11. Luengo-Fernandez R, Paul NL, Gray AM, Pendlebury ST, Bull LM, Welch SJV, et al. Population-based study of disability and institutionalization after transient ischemic attack and stroke: 10-year results of the Oxford vascular study. Stroke 2013;44:2854–61. 10.1161/strokeaha.113.001584 [DOI] [PMC free article] [PubMed] [Google Scholar]
- 12. OECD . OECD Health Data. Available from: https://stats.oecd.org/ (7 July 2023, date last accessed).
- 13. Timmis A, Vardas P, Townsend N, Torbica A, Katus H, De Smedt D, et al. European Society of cardiology: cardiovascular disease statistics 2021. Eur Heart J 2022;43:716–99. 10.1093/eurheartj/ehab892 [DOI] [PubMed] [Google Scholar]
- 14. Institute for Health Metrics and Evaluation . Global Health Data Exchange. Available from: https://ghdx.healthdata.org/ (7 July 2023, date last accessed).
- 15. Börsch-Supan A, Brandt M, Hunkler C, Kneip T, Korbmacher J, Malter F, et al. Data resource profile: the survey of health, ageing and retirement in Europe (SHARE). Int J Epidemiol 2013;42:992–1001. 10.1093/ije/dyt088 [DOI] [PMC free article] [PubMed] [Google Scholar]
- 16. Statistisches Bundesamt . Cost of illness: Germany, years, disease diagnoses (ICD-10), sex, facilities. Available from: https://www-genesis.destatis.de/genesis//online? operation=table&code=23631-0004 (7 July 2023, last date accessed).
- 17. Rijksinstituut voor Volksgezondheid en Milieu . Kosten van ziekten 2019. Available from: https://statline.rivm.nl/#/RIVM/nl/dataset/50091NED/table? ts=1660223783679 (7 July 2023, last date accessed).
- 18. OECD, Eurostat, World Health Organization . A System of Health Accounts 2011, 2017.
- 19. Directorate-General for Economic and Financial Affairs . Joint Report on Health Care and Long-Term Care Systems and Fiscal Sustainability—Country Documents 2019 Update. Available from: https://economy-finance.ec.europa.eu/publications/joint-report-health-care-and-long-term-care-systems-and-fiscal-sustainability-country-documents-2019_en (7 July 2023, last date accessed).
- 20. Koopmanschap M, van Ineveld B. Towards a new approach for estimating indirect costs of disease. Soc Sci Med 1992;34:1005–10. 10.1016/0277-9536(92)90131-9 [DOI] [PubMed] [Google Scholar]
- 21. Nixon J, Ulmann P. The relationship between health care expenditure and health outcomes: evidence and caveats for a causal link. Eur J Health Econ 2006;7:7–18. 10.1007/s10198-005-0336-8 [DOI] [PubMed] [Google Scholar]
- 22. Tsao CW, Aday AW, Almarzooq ZI, Anderson CAM, Arora P, Avery CL, et al. Heart disease and stroke statistics-2023 update: a report from the American heart association. Circulation 2023;147:e93–e621. 10.1161/cir.0000000000001123 [DOI] [PMC free article] [PubMed] [Google Scholar]
- 23. Boriani G, Guerra F, De Ponti R, D’Onofrio A, Accogli M, Bertini M, et al. Five waves of COVID-19 pandemic in Italy: results of a national survey evaluating the impact on activities related to arrhythmias, pacing and electrophysilogy promoted by AIAC (Italian association of arrhythmology and cardiac pacing). Intern Emerg Med 2023;18:137–49. 10.1007/s11739-022-03140-4 [DOI] [PMC free article] [PubMed] [Google Scholar]
- 24. Wright FL, Cheema K, Goldacre R, Hall N, Herz N, Islam N, et al. Effects of the COVID-19 pandemic on secondary care for cardiovascular disease in the UK: an electronic health record analysis across three countries. Eur Heart J Qual Care Clin Outcomes 2023;9:377–88. 10.1093/ehjqcco/qcac077 [DOI] [PMC free article] [PubMed] [Google Scholar]
- 25. Mafham MM, Spata E, Goldacre R, Gair D, Curnow P, Bray M. COVID-19 pandemic and admission rates for and management of acute coronary syndromes in England. Lancet 2020;396:381–9. 10.1016/S0140-6736(20)31356-8 [DOI] [PMC free article] [PubMed] [Google Scholar]
- 26. Gross CP, Anderson GF, Powe NR. The relation between funding by the national institutes of health and the burden of disease. N Engl J Med 1999;340:1881–7. 10.1056/nejm199906173402406 [DOI] [PubMed] [Google Scholar]
- 27. Advancing cancer therapy. Nat Cancer 2021;2:245–6. 10.1038/s43018-021-00192-x [DOI] [PubMed] [Google Scholar]
- 28. Luengo-Fernandez R, Leal J, Gray A. UK Research spend in 2008 and 2012: comparing stroke, cancer, coronary heart disease and dementia. BMJ Open 2015;5:e006648. 10.1136/bmjopen-2014-006648 [DOI] [PMC free article] [PubMed] [Google Scholar]
- 29. Luengo-Fernandez R, Leal J, Gray AM. UK Research expenditure on dementia, heart disease, stroke and cancer: are levels of spending related to disease burden? Eur J Neurol 2012;19:149–54. 10.1111/j.1468-1331.2011.03500.x [DOI] [PubMed] [Google Scholar]
- 30. Tan SS, Geissler A, Serden L, Heurgren M, van Ineveld BM, Hakkart-van Roijen L. DRG Systems in Europe: variations in cost accounting systems among 12 countries. Eur J Public Health 2014;24:1023–8. 10.1093/eurpub/cku025 [DOI] [PubMed] [Google Scholar]
Associated Data
This section collects any data citations, data availability statements, or supplementary materials included in this article.
Supplementary Materials
Data Availability Statement
The data underlying this article will be shared on reasonable request to the corresponding author.