

In PNAS, Hoang et al. (1) present a new approach to measure the risk of agricultural production on biodiversity by defining conservation risk hotspots that are “estimated and classified by comparing the percentage of land use for each agricultural commodity within a pixel and its CP [conservation priority] index.” This approach assumes that "increasing land-use proportions in a high-CP value pixel causes more risk hotspots between agricultural production and biodiversity conservation.” This insightful approach does not reflect other types of production impacts on biodiversity such as water and carbon footprints (2–4). Furthermore, to better inform consumers, it is important to assess impacts per unit of consumption because the typical consumers generally do not link distant land use and conservation risk hotspots with consumption. Here, we compare the production and consumption of coffee and tea, the most common beverages after water, and the two commodities analyzed in Hoang et al.
Both coffee and tea are grown in humid tropical and subtropical regions on lands that once supported the most diverse natural ecosystems in the world. Expanding consumption of both commodities and climate change will continue to exert pressure on land and the nature it supports. Previous comparisons (4) of environmental effects lack comprehensive analysis of land, carbon, and water impacts on a per unit of production or consumption for coffee, tea, or other crops.
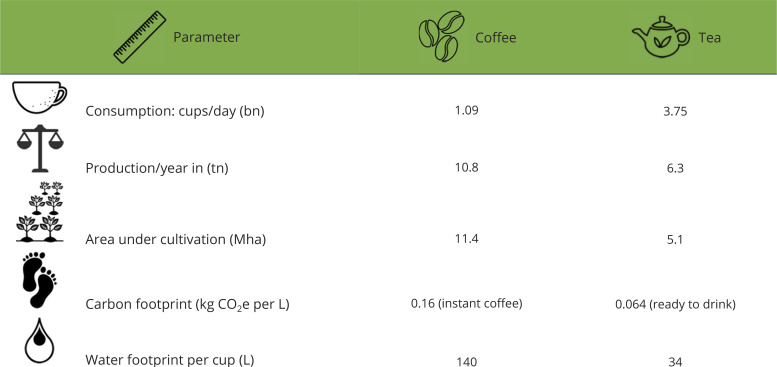
Worldwide, 1.09 billion cups of coffee (5) and 3.75 billion cups of tea (6) are consumed per day (Table 1). For this usage, 10.8 million tons of coffee and 6.3 million tons of processed tea leaves were produced in 2020 from 11.4 million ha of land under coffee and 5.1 million ha under tea (7). Thus, on a per-cup basis, coffee requires almost 7.5 times the area required by tea.
Table 1.
Environmental footprint of coffee and tea (References in text)
|
The processing of coffee and tea also has significant carbon and water footprints. On a per-liter basis, the carbon emissions of instant coffee are 2.5 times more than for tea ready to drink. The carbon footprint of brewed coffee and latte is much higher due to the increased amount of green coffee required for brewing and the use of milk, respectively (3). Although both coffee and tea grow in areas with high rainfall, subsurface and groundwater are still utilized by both crops through irrigation during dry periods in certain areas and through processing for production. The total water used on a per-cup basis is more than four times as much for coffee as for tea (4). Altogether, the environmental impact of a cup of coffee is much larger than that of tea.
Switching from coffee to tea can result not only in rewilding and restoration of millions of hectares of land but also in additional carbon sequestration. Interestingly, in many parts of the world, within the same cultures, the use of coffee and tea are almost interchangeable, which should help facilitate the shift to more tea and less coffee. Such analyses are also needed for the production and consumption of other comparable pairs of food crops, for example, wheat and rice.
Acknowledgments
Author contributions
K.S.B. and J.L. designed research; performed research; analyzed data; and wrote the paper.
Competing interests
The authors declare no competing interest.
References
- 1.Hoang N. T., et al. , Mapping potential conflicts between global agriculture and terrestrial conservation. Proc. Natl. Acad. Sci. U.S.A. 120, e2208376120 (2023). [DOI] [PMC free article] [PubMed] [Google Scholar]
- 2.Karwacka M., et al. , Sustainable development in the agri-food sector in terms of the carbon footprint: A review. Sustainability 12, 6463 (2020). [Google Scholar]
- 3.Eneroth H., et al., Environmental impact of coffee, tea and cocoa—Data collection for a consumer guide for plant-based foods (Report No. 122, Swedish University of Agricultural Sciences, Department of Energy and Technology, 2022).
- 4.Chapagain A. K., Hoekstra A. Y., The water footprint of coffee and tea consumption in the Netherlands. Ecol. Econ. 64, 109–118 (2007). [Google Scholar]
- 5.Sachs J. D., et al. , Ensuring economic viability and sustainability of coffee production (Columbia Center on Sustainable Investment, 2019). [Google Scholar]
- 6.Craymer L., The Wall Street Journal (2020), https://www.livemint.com/news/world/you-re-stuck-at-home-drinking-a-ton-of-tea-and-prices-are-rising-11600924691692.html. Accessed 17 August 2023.
- 7.Food and Agriculture Organization of the United Nations, FAOSTATS (FAO, 2020). [Google Scholar]