

Significance
Many animal and plant species synthesize toxic compounds as deterrent, often recognized by bitter taste receptors (T2Rs). Here, we have identified a singular T2R in cartilaginous fishes and determined its ligand repertoire in two shark species. Some of its ligands are shared with basal bony fish T2Rs indicating functional conservation over nearly 500 mya of separate evolution. The shark T2R reacts to both endogenous steroids and xenobiotic compounds, whereas these functions are segregated already in the “living fossil” coelacanth, consistent with the shark T2R reflecting the ancestral ligand repertoire at the evolutionary origin of T2Rs. Thus, the dual role of T2Rs as gustatory and nongustatory receptors observed in mammalian species appears to be as ancient as T2Rs themselves.
Keywords: chemical senses, evolution of function, bitter taste, cartilaginous fish, bile acid
Abstract
Many animal and plant species synthesize toxic compounds as deterrent; thus, detection of these compounds is of vital importance to avoid their ingestion. Often, such compounds are recognized by taste 2 receptors that mediate bitter taste in humans. Until now, bitter taste receptors have only been found in bony vertebrates, where they occur as a large family already in coelacanth, a “living fossil” and the earliest-diverging extant lobe-finned fish. Here, we have revisited the evolutionary origin of taste 2 receptors (T2Rs) making use of a multitude of recently available cartilaginous fish genomes. We have identified a singular T2R in 12 cartilaginous fish species (9 sharks, 1 sawfish, and 2 skates), which represents a sister clade to all bony fish T2Rs. We have examined its ligands for two shark species, a catshark and a bamboo shark. The ligand repertoire of bamboo shark represents a subset of that of the catshark, with roughly similar thresholds. Amarogentin, one of the most bitter natural substances for humans, also elicited the highest signal amplitudes with both shark receptors. Other subsets of ligands are shared with basal bony fish T2Rs indicating an astonishing degree of functional conservation over nearly 500 mya of separate evolution. Both shark receptors respond to endogenous steroids as well as xenobiotic compounds, whereas separate receptors exist for xenobiotics both in early- and late-derived bony vertebrates (coelacanth, zebrafish, and human), consistent with the shark T2R reflecting the original ligand repertoire of the ancestral bitter taste receptor at the evolutionary origin of this family.
Potentially harmful food items recognized by specialized taste receptors elicit avoidance behavior in a wide range of Bilateria, ranging from nematodes and fruit flies to fishes and mammals (1). The responsible taste receptors in the different phyla do not share any obvious common evolutionary origin. In vertebrates, recognition of the chemically diverse and numerous bitter substances present in nature is facilitated by taste 2 receptors (T2R, TAS2R, and Tas2r) that belong to the large superfamily of G protein–coupled receptors (GPCRs) (2–4). For quite some years, the characterization of vertebrate bitter taste receptors has been strongly biased toward research on the ~25 human TAS2Rs (5). In recent years, however, the bitter taste receptor repertoires of a number of additional vertebrate species were analyzed on the genomic scale, and, for a much smaller fraction of bitter taste receptors, functional characterizations have been provided (for a review, see ref. (6)). An unexpected revelation was the identical ligand repertoire of orthologous fish T2R receptors separated by over 400 million years of divergent evolution (7). This is in stark contrast to the drastically different ligand spectra of human and mouse ortholog Tas2rs (8) [less than 100 million years since divergence (9)]. Currently, it is unknown which of these characteristics might prevail at the evolutionary origin of vertebrate bitter taste receptors. Surprisingly, the T2R family has been believed to originate with bony fish as it had not been found in cartilaginous or jawless fish (10), which would leave a considerable gap in the bitter recognition capabilities within the chordate branch. Besides their oral function as bitter taste receptors, T2Rs also may serve as endogenous metabolite sensors (11). Within the T2R repertoire of the earliest-derived lobe-finned fish, receptors for both bitter tastants and endogenous metabolites have been identified (7). It is unclear whether the oral or the extraoral role of T2Rs is the evolutionary most ancient function. To hone in on this question, it would be important to identify the earliest-diverging T2Rs, preferably before major gene duplications have happened, and subject them to functional analyses. Here, we have searched genomes of 17 cartilaginous fish and identified a singular T2R receptor, which represents a sister clade to all bony fish T2Rs, i.e., bitter taste receptors originated already in the ancestor of jawed vertebrates. For the receptor from two sharks, we have determined the agonist profile, which is consistent with the shark T2R reflecting the original ligand repertoire of the ancestral bitter taste receptor at the evolutionary origin of this family.
Results
Sharks and Rays, but not Chimaeras, Possess a Singular Bitter Taste Receptor.
Bitter taste receptors had been assumed to originate in bony vertebrates since they had not been found in their sister group (cartilaginous fish, comprising sharks, rays, and chimaeras) nor in the more basal (earlier-derived) jawless fish (lampreys) (10). However, their immediate sister family are olfactory receptors that do occur also in cartilaginous and jawless fish (vomeronasal receptors type 1/olfactory receptors related to class A, V1Rs/ORAs) (12–14). This phylogenetic relationship suggests an earlier origin for T2Rs. We have taken advantage of the recent increase in cartilaginous fish genomic databases to reassess the question of the evolutionary origin of T2Rs. We report a singular T2R in 12 of 17 cartilaginous fish genomes (Fig. 1 and SI Appendix, Table S1), which we named T2R1. These 12 T2R1 receptors form with maximal statistical support (Fig. 1) a sister clade to all bony fish T2Rs, i.e., no direct orthologs (that would locate with the cartilaginous fish T2R1 clade) were found in any bony fish genomes examined, including lobe-finned fish (coelacanth, and lungfish, the closest relatives of tetrapods) and early-derived ray-finned fish (bichir, sterlet, and bowfin) (SI Appendix, Table S1). Together, cartilaginous fish T2R1 and all bony fish T2R constitute the sister clade to the V1R/ORA group of receptors (Fig. 1 and SI Appendix, Supporting Text). This node also has maximal statistical support (Fig. 1), confirming the cartilaginous fish T2R1 as bona fide ancestral bitter taste receptor.
Fig. 1.
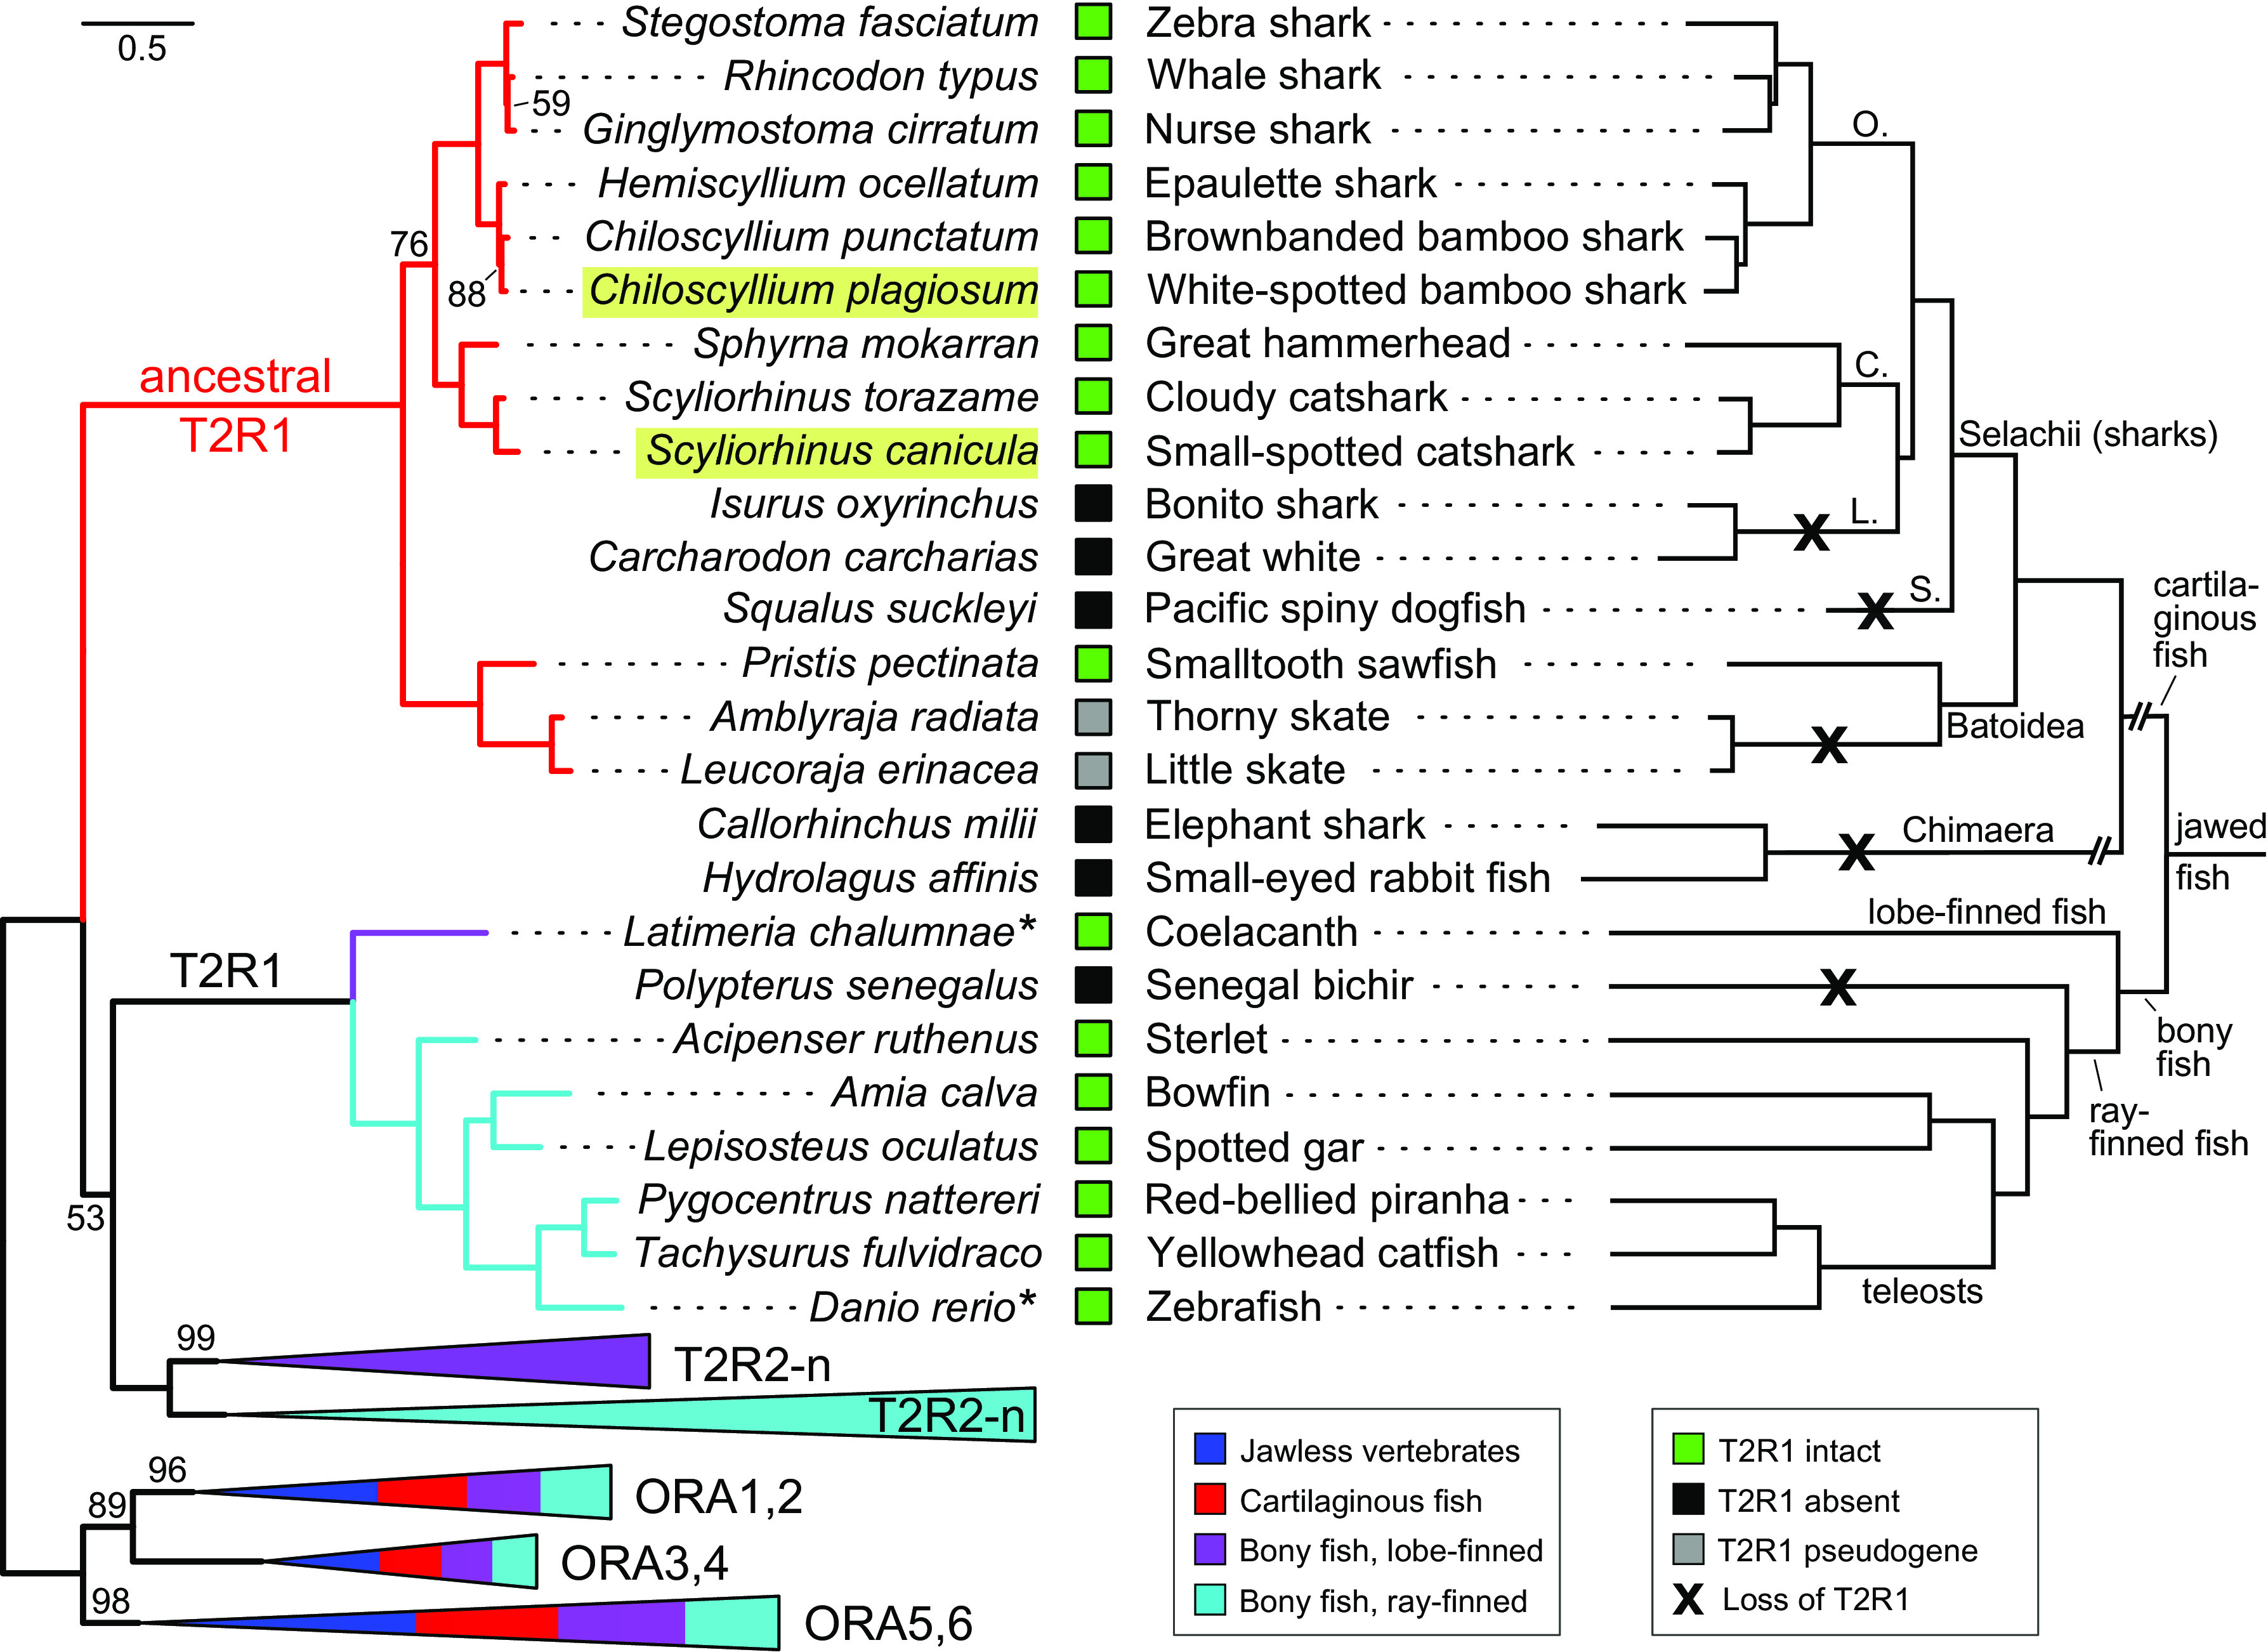
Maximum likelihood phylogenetic tree for bitter taste receptors faithfully reflects species taxonomic relationships. Left side, phylogenetic tree for the singular chondrichthyan T2R and bony fish T2Rs. Species groups are visualized by color code as indicated, triangles represent collapsed nodes, with the length of the triangle corresponding to the longest branch in that node and the colors in the triangle reflecting the species groups whose T2Rs are present in that node. Gene names given are valid for all subsequent branches, the respective species are listed at the branch tips. For the corresponding treefile, see SI Appendix, Supporting Text. For bony fish T2Rs and the outgroup genes (V1R-related ORA1-6), representative subsets were chosen; for complete species and gene lists, see SI Appendix, Table S1. Branch support is given in percent and only branch supports below 100% are shown. The scale bar indicates substitutions/site (amino acids). Light green overlay, agonist activation was determined in this study; asterisk, agonist activation examined in ref. 7. Right side, taxonomic species tree. The subtree for 17 cartilaginous fishes was drawn according to a mitochondrial genome tree of 73 chondrichthyan species (15); for species not included in ref. 15, the tree position of the nearest related species (same genus or family) was chosen. The subtree for bony fish T2R1 was drawn according to ref. 16. Some larger taxonomic groups are given, orders are indicated by the first letter as follows: C., Carcharhiniformes; L., Lamniformes; O., Orectolobiformes; S., Squaliformes. Green squares, full-length T2R1 is present; gray squares, pseudogene; black squares, T2R1 is absent. Black crosses, several independent gene loss events are inferred. Note that the topology of the phylogenetic tree is identical to that of the taxonomic tree, even for the pseudogenized genes of the two skate species.
Phylogenetic relationship within the cartilaginous fish T2R clade precisely follows species relationships (Fig. 1). Chimaeras have lost this gene (2 of 2 species), in rays, it appears to be in the process of pseudogenization (2 of 2 species), and two orders of true sharks also have lost it (Lamniformes including the Great White and Squaliformes (Fig. 1 and SI Appendix, Table S1). Mapping the presence and absence of cartilaginous fish T2R1 on the species tree allows to infer a minimum of four independent gene losses (Fig. 1). Intact T2R1 are present in one sawfish (Batoidea), and nine shark species in two different orders, Carcharhiniformes and Orectolobiformes (Fig. 1 and SI Appendix, Table S1), and show a high degree of sequence conservation (SI Appendix, Fig. S1 and Table S2).
It is remarkable that the cartilaginous fish bitter taste receptor has not undergone a single duplication in any of the species analyzed (Fig. 1). This is in stark contrast to the evolutionary dynamics of the sister clade in bony vertebrates, which is characterized by frequent gene gains and losses resulting in family sizes between 1 and over one hundred t2r genes (17–19). Already the earliest-derived bony fish, coelacanth, possesses close to 80 T2Rs (20). Thus, the T2R1 of cartilaginous fishes may be as close to the ancestral receptor function as is possible when examining extant bitter taste receptors. We therefore selected two shark T2R1 receptors, S. canicula T2R1 (scT2R1) and C. plagiosum T2R1 (cpT2R1) to perform functional studies. These two species are segregated by 200 million years of separate evolution (9), and any commonalities found would be suggestive of being part of the ancestral function of the first T2R molecules.
The Agonist Repertoires of S. canicula T2R1 (scT2R1) and C. plagiosum T2R1 (cpT2R1) Are Highly Similar Albeit Distinctly Different.
To identify bitter substances activating S. canicula T2R1 (scT2R1) and C. plagiosum T2R1 (cpT2R1), an array of 94 synthetic and natural bitter substances was screened (SI Appendix, Table S3). Expression constructs coding for scT2R1 and cpT2R1 were transiently transfected into HEK 293T-Gα16gust44 cells, and calcium-mobilization experiments were performed.
The screening experiment identified 11 substances activating scT2R1 and 7 substances activating cpT2R1 (Fig. 2), among them endogenous steroids as well as xenobiotic compounds. Interestingly, the 7 substances activating cpT2R1 represent a subset of the scT2R1 agonists, i.e., no compounds were found that selectively activated cpT2R1. On the other hand, 4 compounds—arbutin, chloroquine, progesterone, and resveratrol—elicited responses exclusively in scT2R1-expressing cells. Seven of 11 substances activating scT2R1 represent natural bitter substances and 4 are of synthetic origin. For cpT2R1, it is 4 natural substances and 3 synthetic compounds. To determine the potencies and efficacies of the identified shark T2R1 agonists, dose–response relationships were monitored (Fig. 3A).
Fig. 2.

Functional screening of shark bitter taste receptors. Expression constructs coding for S. canicula (Upper) and C. plagiosum (Lower) T2R1 were transiently transfected into HEK 293T-Gα16gust44 cells and subjected to calcium-mobilization experiments. Automated application of indicated concentrations of bitter substances and the following measurements of fluorescence changes were done using a fluorometric imaging plate reader (FLIPRtetra). The resulting changes in fluorescence in cells responding to agonist application are shown as black traces. Responses of cells transfected with empty vector controls (=mock) are shown as gray traces. A scale bar is shown at the bottom right.
Fig. 3.

(A) Determination of dose–response relationships obtained for shark T2R1 receptors. The expression constructs for S. canicula (red) and C. plagiosum (blue) T2R1 as well as empty vector controls (gray) were transiently transfected into HEK 293T-Gα16gust44 cells and subjected to calcium-mobilization assays. The application of increasing amounts of the indicated bitter compounds was done using a fluorometric imaging plate reader (FLIPRtetra). The lowest concentrations (threshold concentrations) of agonists leading to statistically significant (Student’s t test, P < 0.05) relative changes in fluorescence (ΔF/F, y axis) are labeled by asterisks in the corresponding colors. The applied concentrations are labeled on the logarithmically scaled x axis and given in log mM. (B) Sensitivity of detection for all 11 agonists identified for the singular shark bitter taste receptor. Blue bars, C. plagiosum T2R1; red bars, S. canicula T2R1; crosses, no agonist activity at any concentration. Sensitivity was defined as the reciprocal of the threshold concentration (mM) and is shown in the logarithmic scale (e.g., +1 equals 0.1 mM threshold).
The dose–response relationships confirmed the responses obtained in the initial screening experiment. Whereas all eleven substances elicited responses in scT2R1 expressing cells, only a subset of seven bitter compounds showed responses in cpT2R1-transfected cells (Fig. 3B). Thresholds for these commonly detected compounds were roughly similar for the two shark species: a bit lower in cpT2R1 for amarogentin, colchicine, and erythromycin, a bit higher in cpT2R1 for denatonium benzoate, and identical for denatonium saccharide, famotidine, and the bile acid taurolithocholic acid (Fig. 3 A and B). The four compounds selectively activating scT2R1 (arbutin, chloroquine, progesterone, and resveratrol) did not activate cpT2R1 at any concentration examined (Fig. 3 A and B).
Amarogentin is one of the most bitter natural substances for humans, and also elicited the highest signal amplitudes with both shark T2R1 receptors, an interesting parallel to human bitter perception across 460 million years of divergent evolution (cf. ref. 9). With 0.3 µM threshold for scT2R1, the stilbenoid resveratrol exhibited the highest potency for activation. Both denatonium benzoate and denatonium saccharide activated the two shark T2R1 receptors, suggesting that the shared cationic moiety of the two compounds, the denatonium, acted as activator. This is different from an ancestral bony fish T2R1, which reacts to denatonium benzoate and sodium benzoate, but not to denatonium saccharide (7).
The Shark T2R1 Is Expressed in Taste Tissue.
Sharks possess well-developed taste buds, which are enriched in the oral epithelium bordering the dental regions producing teeth (21). A recent transcriptome analysis focusing on tooth development in hatchling S. canicula has analyzed taste and dental regions in the oral epithelium (GEO series GSE198580). We have mined this dataset for T2R1 and for comparison also for TAS1Rs (13) and find strongly enriched expression of T2R1 in the taste tissues compared to three different dental regions (Fig. 4 and SI Appendix, Table S4). Moreover, T2R1 is expressed with very similar specificity and frequency compared to the known taste receptors TAS1Rs (Fig. 4 and SI Appendix, Table S4). These data are consistent with a bona fide function of cartilaginous fish T2R1 as taste receptor.
Fig. 4.

Expression levels of S. canicula T2R1 and TAS1Rs in taste and nontaste tissues. Expression levels (mean + SEM of three biological replicates) were determined as transcripts per million (TPM) and are normalized to the expression level in the taste bud (TB)-containing oral epithelium (basihyal oral epithelium, green bars). Yellow-green bars, tooth-taste junction between the superficial oral and dental epithelium at the jaw margin that separates the taste territory and the dental lamina propria. Gray bars, three different oral tissues not containing taste buds, tissue specifications as indicated. T2R1 is expressed very similar to the known taste receptors TAS1R (13) and is enriched in the taste-bud-containing oral epithelium compared to adjacent dental-specific areas. The data and tissue descriptions used in this figure have been extracted from GEO Series GSE198580 deposited by James K, Fraser G, and Johanson Z in NCBI's Gene Expression Omnibus (22) accessible here: https://www.ncbi.nlm.nih.gov/geo/query/acc.cgi?acc=GSE198580.
Discussion
Here, we have shown the presence of a singular bitter taste receptor in 12 of 17 cartilaginous fish species examined. This result pushes back the evolutionary origin of bitter taste receptors to at least the most recent common ancestor of cartilaginous and bony fish, about 460 mya (9). In phylogenetic analysis, all T2Rs represent a monophyletic sister clade to the V1R-related ORAs, which do have orthologs already in jawless vertebrates (12). Thus one might expect T2Rs also to be present in, e.g., lampreys, which do possess a well-developed taste system (23). However, despite extensive searches, no T2R ortholog was found in jawless fish (lampreys Petromyzon marinus and Lethenteron camtschaticum, hagfish Eptatretus burgeri). Thus, it is currently an open question whether jawless fish had a bitter taste receptor orthologous to the cartilaginous fish T2R1 and lost it at some later time. We did show at least 4 independent losses of cartilaginous fish T2R1 (in chimaeras, rays, and two orders of true sharks) and did not detect the otherwise highly conserved bony fish T2R1 (18)—not orthologous to shark T2R1—in Polypteriformes, which are the earliest-derived ray-finned fish (16), see Fig. 1. Thus, a loss of a postulated ancestral T2R1 in jawless fish can be considered a plausible scenario.
The number of bitter taste receptors varies enormously between different species, ranging from zero (e.g., toothed whales) to over one hundred in some toads (24). It is generally assumed that the repertoire size reflects the particular ecological needs of the respective species, if not the physiological relevance of bitter detection. In small bitter taste receptor families, the individual receptors appear to be broadly tuned, whereas many of the members of large T2R families seem to be narrowly tuned (25). Thus, the family size may reflect the need for fine-grained distinction more than the relevance of bitter taste per se. Even a family size of one as in cartilaginous fish may constitute a significant novel sense. The absence of any gene duplication suggests the shark T2R ligand repertoire to be close to the ancestral ligands for bitter taste at the evolutionary origin of the family. This is in stark contrast to bony fish, where already the earliest-diverging lobe-finned fish, coelacanth, possesses a very large T2R repertoire with specialized functions for individual T2Rs (7, 20).
It is noteworthy that one of the bony fish taste receptors, T2R1, appears to have retained the ancestral evolutionary dynamic of cartilaginous fish T2R1 [high degree of conservation, no gene duplications (7, 18), see also Fig. 1], whereas other bony fish T2R (T2R2-n) and all tetrapod T2R show less conservation and many, often species-specific gene duplications (18, 20, 24, 25). The ligand repertoire of bony fish T2R1 is unusually conserved, with orthologs in coelacanth and zebrafish exhibiting the identical ligand spectrum, across over 400 mya of divergent evolution (7). However, this receptor is only one of 76 intact T2Rs for coelacanth. Thus, it is difficult to infer from those binding spectra the ancestral ligand repertoire at the inception of the T2R family. Our finding of a singular T2R receptor in cartilaginous fish allows us a more direct approach toward the question of the ancestral ligands for bitter taste.
The ligand repertoire of bamboo shark is a subset of that for the catshark T2R1. This does not appear to be a problem of accessibility for the ligand since those ligands activating catshark, but not bamboo shark T2R1, are at the lower end of molecular size distribution, whereas very large molecules like amarogentin and erythromycin are recognized by both receptors.
One of the main questions is whether the ligands of the T2R founder gene were endogenously detected metabolites [e.g., bile acids (5, 7, 8, 26)] or xenobiotic bitter compounds. And the answer to this question seems to be both. The ligand subset common to bamboo shark and catshark T2R1 (C. plagiosum and S. canicula, 200 mya divergence) might be considered as possible ligands of the T2R founder gene itself. This common subset includes a bile acid with the second lowest threshold of all activating compounds found, but also substances such as amarogentin, which are likely of external origin for fish. While shark are not expected to come into contact with gentian—the eponymous source of amarogentin—potential prey might contain toxic compounds mimicking amarogentin’s action at the shark T2R1. Such toxins may be directly synthesized by the prey, e.g., by invertebrates (27), or secondarily accumulated in the prey from toxic algal blooms or marine bacteria (28). Indeed, erythromycin, one of the ligands for both shark receptors, is naturally produced by terrestrial Streptomyces bacteria, and cytotoxic compounds of marine bacteria in the same genus have been identified (29, 30).
Besides the evaluation of ligands, the expression pattern of the receptors is expected to provide clues for their function. A bitter taste receptor detecting xenobiotics is expected to be expressed in taste tissue, whereas detection of endogenous compounds may occur in several internal tissues, e.g., refs. 26 and 31. Here, we show expression of catshark T2R1 in oral epithelium taste tissue, but not in adjacent dental tissue. The specificity and frequency of expression are very similar to those of the known taste receptors TAS1Rs (Fig. 4 and SI Appendix, Table S4). These data are consistent with a bona fide function as taste receptor already at the origin of the T2R family.
We would like to emphasize that the bifunctional nature of the shark T2R1 receptors (reacting to endogenous steroids and xenobiotic compounds) has given way to segregated function already in the earliest-diverging bony vertebrate, coelacanth. In mammals (mouse and human) detection of bile acids is restricted to a small subset of all receptors (26). In bony fish, the most basal receptor (coelacanth T2R01 and its direct ortholog zebrafish T2R1) recognizes exogenous compounds, whereas zebrafish T2R2 and coelacanth T2R02 recognize steroids (7). It is conceivable that the very first gene duplication of the ancestral T2R gene already resulted in this bifurcation of function. Since zebrafish T2R2 is not a direct ortholog of coelacanth T2R02, this might have happened independently in the lobe-finned (coelacanth) and the ray-finned (zebrafish) lineages.
Remarkably, shark T2R1 even shares particular ligands with those same bony fish T2Rs: with zebrafish T2R1 and coelacanth T2R01 chloroquine; with zebrafish T2R2 and coelacanth T2R02 two steroids, taurolithocholic acid und progesterone. This is across 462 mya of segregated evolution (9). Together with the initial observation that a ligand set heavily biased for human perception of bitter contains a considerable proportion of ligands for shark T2R1 (11 of 94), this suggests far-ranging conservation of the ligand spectrum of bitter taste receptors throughout vertebrate evolution.
Materials and Methods
Phylogenetic Analysis.
Phylogenetic analysis was performed essentially as described (32). Databases searched comprised Whole Genome Shotgun (WGS) and genome assemblies (some genes were only found in the WGS, not in the genome of the respective species). All jawless and cartilaginous fish species currently available at NCBI were searched; for the complete list, see SI Appendix, Table S1. Initial queries consisted of zebrafish and representative coelacanth T2R amino acid sequences. The cutoff value was set at 10−5. Searches were performed recursively using more closely related genes as query as they became available. Candidate genes were validated by their placement in phylogenetic trees obtained with maximum likelihood algorithm (33). Reference genes were chosen from several species, including zebrafish, sterlet, coelacanth, and lungfish; for the complete list, see SI Appendix, Table S1. The outgroup for T2Rs consisted of a diverse selection from all class A GPCR subgroups (alpha to delta) together with ORAs/V1Rs, which are most closely related to T2Rs (20).
Materials.
Chemicals.
Stock solutions of the test substances were prepared in dimethyl sulfoxide (DMSO) or C1 buffer (130 mM NaCl, 5 mM KCl, 2 mM CaCl2, 10 mM glucose, and 10 mM HEPES; pH 7.4) depending on their solubility. For experiments, stock solutions were diluted in C1 buffer to the highest concentration applicable without cellular artifacts and a 1 to 10 dilution thereof. The final DMSO concentrations remained below 1% in the experiments.
Plasmid generation.
The full-length coding sequences of S. canicula (small-spotted catshark) and C. plagiosum (white-spotted bamboo shark) T2R1 were obtained by gene syntheses (eurofins, Ebersberg, Germany). Cloning into the cassette vector pcDNA5FRT-sst3-hsv using EcoRI and NotI restriction endonucleases resulted in fusion constructs consisting of the sequence coding for the first 45 amino acids of rat somatostatin receptor 3 at the 5′ end and the T2R1 open reading frames followed by the herpes simplex glycoprotein D tag at the 3′ end.
Assessing Function in Heterologous Expression Experiments.
Screening of bitter compounds.
The screening of bitter compounds was mainly done as published previously (7). The HEK 293T-Gα16gust44 cells used for the functional expression of shark T2Rs were seeded onto poly-D-lysine-coated 96-well plates using DMEM and supplements (10% FBS, 1% penicillin/streptomycin, and 1% glutamine) at 37 °C, 5% CO2, saturated air humidity. When cells reached a confluence of 40 to 60%, they were transiently transfected with cDNA constructs coding for shark T2Rs using lipofectamine 2000 (Thermo Fisher Scientific, Darmstadt, Germany). Empty pcDNA5FRT vector (mock) was transfected as a negative control. Twenty-four hours after transfection, cells were loaded with Fluo4-AM (Thermo Fisher Scientific, Darmstadt, Germany) in the presence of probenecid (2.5 mM, Sigma-Aldrich, Steinheim, Germany) for 1 h and then washed twice with C1 buffer and placed in a fluorometric imaging plate reader (FLIPRTetra, Molecular Devices). Upon application of the bitter substances to the cells, changes in fluorescence were monitored. Cell viability was checked by application of somatostatin 14 (100 nM, Bachem, Bubendorf, Switzerland).
Calculation of dose–response relationships.
HEK 293T-Gα16gust44 cells were transfected with either of the shark T2R1 or an empty vector control similar to the screening experiments described above. The identified bitter activators of the shark T2Rs were diluted with C1 buffer and subjected to calcium-mobilization assays as described above. Three independent experiments were performed, each with duplicates. The compound-specific fluorescence changes (ΔF/F) were calculated after mock control subtraction and normalization to background fluorescence. Plots were generated with SigmaPlot 14.0.
Supplementary Material
Appendix 01 (PDF)
Acknowledgments
We thank Eva Boden for excellent technical assistance. This work was supported by the German Science Foundation (grant KO1046/12-1 to S.I.K.).
Author contributions
M.B. and S.I.K. designed research; M.B., T.L., and S.I.K. performed research; M.B., T.L., and S.I.K. analyzed data; and M.B. and S.I.K. wrote the paper.
Competing interests
The authors declare no competing interest.
Footnotes
This article is a PNAS Direct Submission.
Contributor Information
Maik Behrens, Email: m.behrens.leibniz-lsb@tum.de.
Sigrun I. Korsching, Email: sigrun.korsching@uni-koeln.de.
Data, Materials, and Software Availability
All study data are included in the article and/or SI Appendix.
Supporting Information
References
- 1.Yarmolinsky D. A., Zuker C. S., Ryba N. J., Common sense about taste: From mammals to insects. Cell 139, 234–244 (2009). [DOI] [PMC free article] [PubMed] [Google Scholar]
- 2.Adler E., et al. , A novel family of mammalian taste receptors. Cell 100, 693–702 (2000). [DOI] [PubMed] [Google Scholar]
- 3.Chandrashekar J., et al. , T2Rs function as bitter taste receptors. Cell 100, 703–711 (2000). [DOI] [PubMed] [Google Scholar]
- 4.Matsunami H., Montmayeur J. P., Buck L. B., A family of candidate taste receptors in human and mouse. Nature 404, 601–604 (2000). [DOI] [PubMed] [Google Scholar]
- 5.Meyerhof W., et al. , The molecular receptive ranges of human TAS2R bitter taste receptors. Chem. Senses 35, 157–170 (2010). [DOI] [PubMed] [Google Scholar]
- 6.Behrens M., “3.11–Bitter taste” in The Senses: A Comprehensive Reference, Fritzsch B., Ed. (Elsevier, Oxford, ed. 2, 2020), pp. 231–246, 10.1016/B978-0-12-809324-5.23882-0. [DOI] [Google Scholar]
- 7.Behrens M., Di Pizio A., Redel U., Meyerhof W., Korsching S. I., At the root of T2R gene evolution: Recognition profiles of coelacanth and zebrafish bitter receptors. Genome Biol. Evol. 13, evaa264 (2021). [DOI] [PMC free article] [PubMed] [Google Scholar]
- 8.Lossow K., et al. , Comprehensive analysis of mouse bitter taste receptors reveals different molecular receptive ranges for orthologous receptors in mice and humans. J. Biol. Chem. 291, 15358–15377 (2016). [DOI] [PMC free article] [PubMed] [Google Scholar]
- 9.Kumar S., Stecher G., Suleski M., Hedges S. B., TimeTree: A resource for timelines, timetrees, and divergence times. Mol. Biol. Evol. 34, 1812–1819 (2017). [DOI] [PubMed] [Google Scholar]
- 10.Grus W. E., Zhang J., Origin of the genetic components of the vomeronasal system in the common ancestor of all extant vertebrates. Mol. Biol. Evol. 26, 407–419 (2009). [DOI] [PMC free article] [PubMed] [Google Scholar]
- 11.Behrens M., Meyerhof W., Vertebrate bitter taste receptors: Keys for survival in changing environments. J. Agric. Food Chem. 66, 2204–2213 (2018). [DOI] [PubMed] [Google Scholar]
- 12.Kowatschew D., Korsching S. I., Lamprey possess both V1R and V2R olfactory receptors, but only V1Rs are expressed in olfactory sensory neurons. Chem. Senses 47, bjac007 (2022). [DOI] [PubMed] [Google Scholar]
- 13.Sharma K., Syed A. S., Ferrando S., Mazan S., Korsching S. I., The chemosensory receptor repertoire of a true shark is dominated by a single olfactory receptor family. Genome Biol. Evol. 11, 398–405 (2019). [DOI] [PMC free article] [PubMed] [Google Scholar]
- 14.Syed A. S., et al. , Ancient and nonuniform loss of olfactory receptor expression renders the shark nose a de facto vomeronasal organ. Mol. Biol. Evol. 40, msad076 (2023). [DOI] [PMC free article] [PubMed] [Google Scholar]
- 15.da Cunha D. B., da Silva Rodrigues-Filho L. F., de Luna Sales J. B., “A review of the mitogenomic phylogeny of the chondrichthyes” in Chondrichthyes, da Silva Rodrigues Filho L. F., de Luna Sales J. B., Eds. (IntechOpen, Rijeka, 2017), Ch. 6, 10.5772/intechopen.70028. [DOI] [Google Scholar]
- 16.Betancur R. R., et al. , The tree of life and a new classification of bony fishes. PLoS Curr. 5, ecurrents.tol.53ba26640df0ccaee75bb165c8c26288 (2013). [DOI] [PMC free article] [PubMed] [Google Scholar]
- 17.Antinucci M., Risso D., A matter of taste: Lineage-specific loss of function of taste receptor genes in vertebrates. Front Mol. Biosci. 4, 81 (2017). [DOI] [PMC free article] [PubMed] [Google Scholar]
- 18.Shiriagin V., Korsching S. I., Massive expansion of bitter taste receptors in Blind Cavefish, Astyanax mexicanus. Chem Senses 44, 23–32 (2019). [DOI] [PubMed] [Google Scholar]
- 19.Zhong H., Huang J., Shang S., Yuan B., Evolutionary insights into umami, sweet, and bitter taste receptors in amphibians. Ecol. Evol. 11, 18011–18025 (2021). [DOI] [PMC free article] [PubMed] [Google Scholar]
- 20.Syed A. S., Korsching S. I., Positive Darwinian selection in the singularly large taste receptor gene family of an “ancient” fish, Latimeria chalumnae. BMC Genomics 15, 650 (2014). [DOI] [PMC free article] [PubMed] [Google Scholar]
- 21.Atkinson C. J., Martin K. J., Fraser G. J., Collin S. P., Morphology and distribution of taste papillae and oral denticles in the developing oropharyngeal cavity of the bamboo shark, Chiloscyllium punctatum. Biol. Open 5, 1759–1769 (2016). [DOI] [PMC free article] [PubMed] [Google Scholar]
- 22.Edgar R., Domrachev M., Lash A. E., Gene Expression Omnibus: NCBI gene expression and hybridization array data repository. Nucleic Acids Res. 30, 207–210 (2002). [DOI] [PMC free article] [PubMed] [Google Scholar]
- 23.Barreiro-Iglesias A., Anadón R., Rodicio M. C., The gustatory system of lampreys. Brain Behav. Evol. 75, 241–250 (2010). [DOI] [PubMed] [Google Scholar]
- 24.Lu B., et al. , A large genome with chromosome-scale assembly sheds light on the evolutionary success of a true toad (Bufo gargarizans). Mol. Ecol. Res. 21, 1256–1273 (2021). [DOI] [PubMed] [Google Scholar]
- 25.Behrens M., Korsching S. I., Meyerhof W., Tuning properties of avian and frog bitter taste receptors dynamically fit gene repertoire sizes. Mol. Biol. Evol. 31, 3216–3227 (2014). [DOI] [PubMed] [Google Scholar]
- 26.Ziegler F., Steuer A., Di Pizio A., Behrens M., Physiological activation of human and mouse bitter taste receptors by bile acids. Commun. Biol. 6, 612 (2023). [DOI] [PMC free article] [PubMed] [Google Scholar]
- 27.Stonik V. A., Kicha A. A., Malyarenko T. V., Ivanchina N. V., Asterosaponins: Structures, taxonomic distribution, biogenesis and biological activities. Mar. Drugs 18, 584 (2020). [DOI] [PMC free article] [PubMed] [Google Scholar]
- 28.Whitelaw B. L., Cooke I. R., Finn J., Zenger K., Strugnell J. M., The evolution and origin of tetrodotoxin acquisition in the blue-ringed octopus (genus Hapalochlaena). Aquat Toxicol. 206, 114–122 (2019). [DOI] [PubMed] [Google Scholar]
- 29.Furtado L. C., et al. , Marine streptomyces sp. isolated from the brazilian endemic tunicate euherdmania sp. produces dihydroeponemycin and analogs with potent antiglioma activity. Front. Marine Sci. 8, 644730 (2021). [Google Scholar]
- 30.Li Q., Xu Z., Pinnau I., Fouling of reverse osmosis membranes by biopolymers in wastewater secondary effluent: Role of membrane surface properties and initial permeate flux. J. Membrane Sci. 290, 173–181 (2007). [Google Scholar]
- 31.Shah A. S., Ben-Shahar Y., Moninger T. O., Kline J. N., Welsh M. J., Motile cilia of human airway epithelia are chemosensory. Science 325, 1131–1134 (2009). [DOI] [PMC free article] [PubMed] [Google Scholar]
- 32.Kowatschew D., Korsching S. I., An ancient adenosine receptor gains olfactory function in bony vertebrates. Genome Biol. Evol. 13, evab211 (2021). [DOI] [PMC free article] [PubMed] [Google Scholar]
- 33.Guindon S., et al. , New algorithms and methods to estimate maximum-likelihood phylogenies: Assessing the performance of PhyML 3.0. Syst. Biol. 59, 307–321 (2010). [DOI] [PubMed] [Google Scholar]
Associated Data
This section collects any data citations, data availability statements, or supplementary materials included in this article.
Supplementary Materials
Appendix 01 (PDF)
Data Availability Statement
All study data are included in the article and/or SI Appendix.