

Significance
Amyloid aggregation of the microtubule-associated protein tau is central to the pathology of Alzheimer’s disease and other tauopathies, but the molecular details underlying tau fibrillization are poorly understood. The PHF6 hexapeptide forms a crucial part of the cross- spines found in all pathological tau structures. Here, we show that an entirely predictive, bottom-up coarse-grained model of PHF6 illuminates the hierarchy of structures and driving forces underlying its aggregation. Large-scale simulations quantify the phase behavior, fibrillization thermodynamics, and oligomer conformational landscape of PHF6, essential factors underlying fibril nucleation and growth, and further offer mechanisms of cofactor-induced aggregation. These insights suggest the potential for modern multiscale methods to predictively inform experimental efforts to studytau fragments with detailed molecular pictures of aggregation.
Keywords: tau protein, amyloid aggregation, multiscale modeling
Abstract
The PHF6 (Val-Gln-Ile-Val-Tyr-Lys) motif, found in all isoforms of the microtubule-associated protein tau, forms an integral part of ordered cores of amyloid fibrils formed in tauopathies and is thought to play a fundamental role in tau aggregation. Because PHF6 as an isolated hexapeptide assembles into ordered fibrils on its own, it is investigated as a minimal model for insight into the initial stages of aggregation of larger tau fragments. Even for this small peptide, however, the large length and time scales associated with fibrillization pose challenges for simulation studies of its dynamic assembly, equilibrium configurational landscape, and phase behavior. Here, we develop an accurate, bottom-up coarse-grained model of PHF6 for large-scale simulations of its aggregation, which we use to uncover molecular interactions and thermodynamic driving forces governing its assembly. The model, not trained on any explicit information about fibrillar structure, predicts coexistence of formed fibrils with monomers in solution, and we calculate a putative equilibrium phase diagram in concentration-temperature space. We also characterize the configurational and free energetic landscape of PHF6 oligomers. Importantly, we demonstrate with a model of heparin that this widely studied cofactor enhances the aggregation propensity of PHF6 by ordering monomers during nucleation and remaining associated with growing fibrils, consistent with experimentally characterized heparin–tau interactions. Overall, this effort provides detailed molecular insight into PHF6 aggregation thermodynamics and pathways and, furthermore, demonstrates the potential of modern multiscale modeling techniques to produce predictive models of amyloidogenic peptides simultaneously capturing sequence-specific effects and emergent aggregate structures.
Insight into amyloid aggregation of the microtubule-associated protein tau is critical for establishing a molecular understanding of the progression of Alzheimer’s disease and other tauopathies (1, 2), and more practically, for the development of faithful benchtop aggregation models for therapeutic screening. Although neurodegenerative diseases in this class all share the common feature of tau fibril formation, remarkable advances in the field suggest that each tauopathy is distinguished by a unique fold or set of folds of tau within its fibrils’ cores (3, 4). Landmark cryo-electron microscopy (cryo-EM) studies (5–9) have revealed that, despite a great diversity in fibrillar folds across diseases, all presently known pathological tau fibril structures incorporate the (PHF6, Val-Gln-Ile-Val-Tyr-Lys) motif into their cores. In these structures, PHF6, found in the R3 C-terminal repeat region present in all tau isoforms (10), participates in cross- hydrogen bonding, characteristic of amyloid aggregation, that structures successive layers of fibrils (11–13). Interactions of the hydrophobic sidechains of PHF6 between nearby monomers within fibrils contribute a significant stabilizing effect (14, 15).
PHF6 and the related (PHF6*, Val-Gln-Ile-Ile-Asn-Lys) motif in the R2 C-terminal repeat region found in 4R tau isoforms (16) are known to play key roles in pathological tau aggregation (11, 17). PHF6 in particular, however, is known to be essential as a motif for fibril formation (18), and PHF6 as the isolated VQIVYK hexapeptide self-assembles on its own into ordered -sheet-containing fibrils (12, 19). Compared to full-length tau (352-441 residues depending on isoform) (16), or known tau fibril cores, typically consisting of 100 residues, the 6-residue PHF6 fragment has a much smaller conformational landscape. Although the processes of formation of larger ordered cores of tau fibrils necessarily entail more complex conformational changes than those involving PHF6 alone, experimental evidence continues to reveal the importance of this fragment in tau aggregation. In particular, a small region of tau including PHF6 and nine surrounding residues was recently proposed to form paired cross- structures in the initial stages of Alzheimer’s amyloid aggregation, based on findings from time-resolved cryo-EM (20). Thus, PHF6 fibrillization, which serves as a useful model in its own right, is of major interest for understanding the critical early stages of tau aggregation. Yet, despite its small size, illuminating atomistic simulations of PHF6 fibrillization remain intractable, due to the number of chains needed to overcome the aggregation free energy barrier and the long time scales of fibril nucleation and elongation (21, 22). To gain insight into fibril phase behavior, the configurational landscape of oligomers, and the effects that seeding or aggregation cofactors might have on fibril growth, a multiscale modeling approach that addresses the complex balance between local (e.g., secondary structure) and global (collective assembly) interactions is essential.
Here, we present de novo large-scale simulations of PHF6 aggregation, using a bottom-up coarse-grained (CG) modeling approach. The model developed here predicts assembly of PHF6 from monomers in solution into paired hydrophobically and cross--stabilized fibrils, even though no information about fibrillar states is included during model training—such that the preference for fibrillization emerges from the effective interactions determined by underlying physical, atomic-scale interactions. We use the model to map out the detailed hierarchical configurational landscape of oligomers, revealing unexpected cylindrin-like structures intermediate in the aggregation pathway distinct from both single and paired -sheet oligomeric fibril precursors. We then use large-scale simulations to construct the equilibrium phase diagram of coexisting PHF6 fibrils and solution monomers, which we show is consistent with a statistical-mechanical model of fibrillization. We finally show that heparin as a model polyelectrolyte enhances the propensity of PHF6 to fibrillize, playing an active role in the arrangement of monomers during nucleation and remaining associated with the growing fibrils via electrostatic interactions.
While CG protein and peptide simulation models have been used to study fibrillization, the present work demonstrates a multiscale approach free of experimental input, training on known fibril structures, and hand-tuning, and thus provides a systematic way to investigate the conformationally dynamic aggregation pathways. Phenomenological top-down CG models (23–26) have revealed fundamental qualitative insights into aggregation thermodynamics and kinetics but often ignore sequence-dependent behaviors. Alternatively, sequence-specific CG models have studied amyloid aggregation (27–32), and two CG models (33, 34) examined PHF6 aggregation in particular (22, 35). But many existing models are parameterized using conformational and contact information from experimental native structures of globular proteins, or alternately, by ad hoc methods to match CG system properties to higher resolution simulations. In contrast, modern systematic bottom-up coarse-graining approaches (36–40) posit “universal” variational principles to optimize CG models. Notably, the relative entropy approach has been used to model polyalanine (41, 42) and to build a Gō-like model able to reproduce folded protein structures given native contact information, with high structural accuracy (43). However, predictive bottom-up models for biologically relevant aggregating systems that take advantage of advances in systematic coarse-graining, avoiding a priori input of native contacts, secondary structures, or ad hoc parameterization strategies, have yet to be realized. Such models for aggregating peptides have the potential to inform the effects of mutations or posttranslational modifications or the presence of particular cofactors that have not been previously experimentally characterized.
The relative-entropy-based multiscale strategy presented here suggests a predictive route to quantitatively understanding peptide aggregation, using only information from small-scale atomistic (or all-atom, AA) simulations of interacting PHF6 chains, without requiring any experimental structure input. This approach enables large length- and time-scale molecular dynamics (MD) simulations of PHF6 aggregation and fibril coexistence with solution, as well as extensive configurational sampling to explore the conformational landscape of oligomers. These insights create a detailed molecular picture of PHF6 aggregation, including conformational states, mechanisms, and thermodynamic driving forces, and provide fundamental insight into the dynamic pathways of assembly into fibrils, from monomers to oligomers to large-scale aggregates.
Results and Discussion
PHF6 Fibrillization from Solution.
We use relative entropy coarse-graining to generate a CG model of PHF6 from implicit-solvent (IS) AA reference systems of 3 interacting capped PHF6 chains. We employ a CG mapping of four sites per residue (Fig. 1A), in order to capture secondary and tertiary assembled structures as shown earlier (41, 43). We use the resulting model to simulate solutions of 512 PHF6 at a concentration . Fig. 1B–E shows the systems at four temperatures after of CG MD; an animation at is available as Movie S1. Except at where the solution phase alone persists for the duration of the simulation (Fig. 1E), we observe nucleation and growth of fibrillar aggregates of PHF6, each consisting of two helically intertwined protofilament-like cross--sheet structures (Fig. 1F).
Fig. 1.
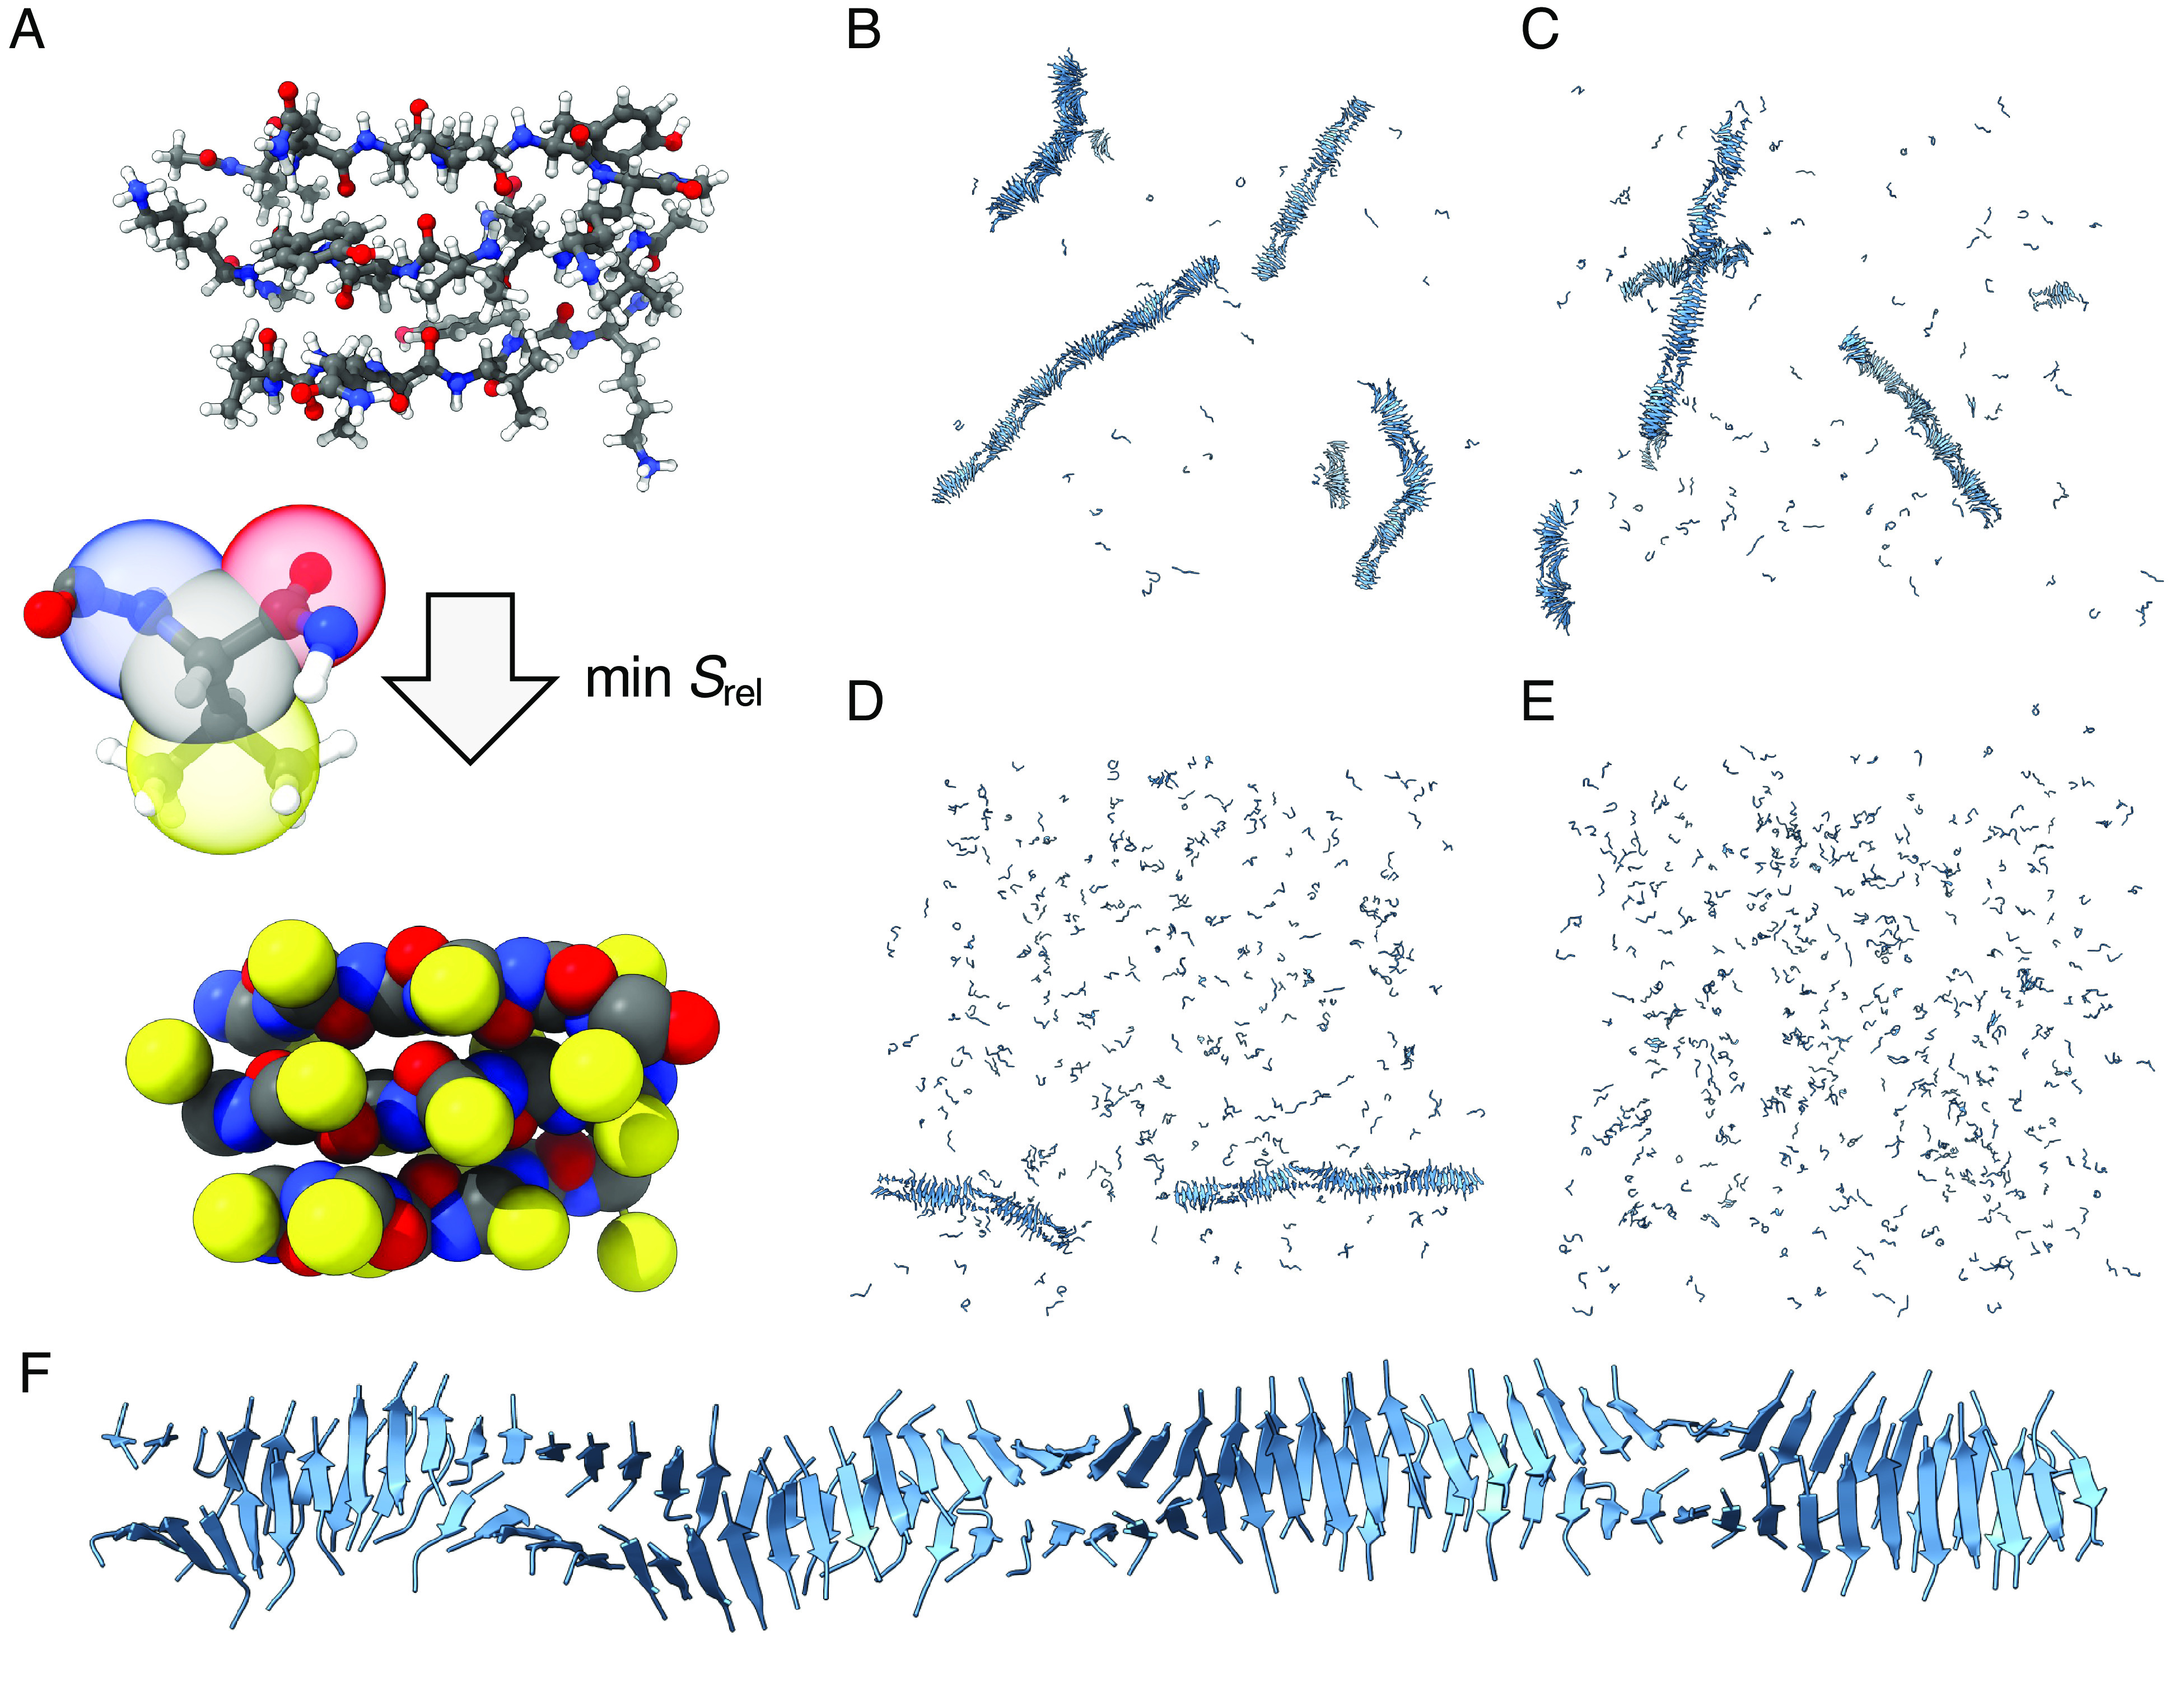
Illustration of the CG model and representative snapshots of simulated aggregates. (A) Representative configuration of the reference system containing 3 PHF6, with an illustration of the mapping operation to the corresponding CG configuration. (B–E) Systems of 512 PHF6 with and , , , , respectively, after of MD simulation. (F) A representative fibril containing 106 PHF6 from a simulation at .
The CG model captures the fibrillization process, despite no training on fibril states, and is essential to enabling equilibration of these large-scale aggregation simulations to obtain thermodynamic properties. As measured by autocorrelation times for backbone dihedral transitions (SI Appendix, Fig. S1A), the CG model shows a reduction in time vs. an explicit-solvent (ES) model and a reduction vs. an IS model. The chain end-to-end distance, with a longer relaxation timescale, shows that the CG model accelerates by the ES and the IS model (SI Appendix, Fig. S1B). Beyond these timescale accelerations, the CG model shows additional practical computational speedups, especially for larger systems (SI Appendix, Fig. S1C). For 32 PHF6, the performance is for ES AA, for IS AA, and 2,340 for CG simulations (6 faster than IS and 100 faster than ES). CG performance is greatly enhanced for larger systems necessary to equilibrate fibrils: IS AA MD of 8 PHF6 gives while nearly the same simulation speed () is possible for CG simulations of 1,024 PHF6. The combination of dynamic acceleration within, and reduced GPU time to advance by, a given interval of simulated time, points to the great utility of coarse-graining in exploring conformational landscapes and carrying out large-scale aggregation simulations.
The structural properties of the simulated aggregates provide a detailed picture of PHF6 fibrils. SI Appendix, Fig. S2A calculates the sphericities of the aggregates showing that oligomers of size 10 chains are more compact, while larger clusters have more extended geometries characteristic of fibrils. The spacing between consecutive layers of pairs of chains in fibrils is Å, and the pitch of the helical twist of the paired layers is Å; these are relatively independent of temperature (SI Appendix, Fig. S2B). This corresponds to layers in a full rotation, or of rotation per layer. Compared to typical tau fibril geometries, e.g., Å spacing and 1 rotation in Alzheimer’s disease paired helical filaments (PHFs) (5), the simulated PHF6 fibrils show slightly closer spacing and much tighter helical twisting. However, the angles observed here are in very good agreement with the theoretical investigation of PHF6 fibril geometries by Yang et al. (15) giving 11 to . The small cross-sectional areas of these fibrils compared to tau fibrils are also likely more permissive of a larger twist angle, consistent with experimental observations of decreasing rotation in -lactoglobulin amyloid fibrils of increasing numbers of protofilaments (44). Finally, the reduced layer spacing could be explained by a rotation of the chains in a fibril to accommodate twisting about its axis—such a rotation is evident in Fig. 1F.
The temperature dependence of the equilibrium PHF6 clusters reveals underlying thermodynamic and kinetic effects governing aggregation (Fig. 2A). At , most chains remain dissociated () or otherwise form small clusters (), but not larger aggregates (). At lower temperatures, fewer chains are found dissociated or in small oligomers, with most in large aggregates, as is also evident from Fig. 1B–D. The time dependence of these fractions (SI Appendix, Fig. S3 A–C) reveals that fibrillization spanning to begins nearly immediately and that the distributions of cluster sizes reach equilibrium within a few . At , the fibril growth rate is much lower, and longer simulations are likely necessary to equilibrate the system. It is unclear from these results alone whether or not the absence of aggregation at is due to thermodynamic instability of the fibrils, or that the timescale of fibril nucleation is simply significantly longer than the simulation; we address this issue further in Aggregation Phase Behavior.
Fig. 2.

Temperature dependence of properties of aggregating systems. (A) Fractions of isolated chains () and chains in clusters of sizes and , from the last of MD simulations of 512 PHF6 with . (B) Likewise, fractions of non-hydrogen-bonded contacting chains for which the closest pair of sidechains consisted of residues from the hydrophobic and hydrophilic sides of PHF6. (C) Fractions of -bridge-participating residues with parallel (vs. antiparallel) orientations, and total numbers of -bridges per chain. Error bars show SDs of the measured properties.
The model predicts appropriate structural ordering of the PHF6 chains within their fibrils, as illustrated in Fig. 2B showing the fractions of closest, non-hydrogen-bonded contacts (in opposing protofilaments) as a function of temperature. We classify contacts by the participating residues: , , and make up the “hydrophobic side” of PHF6, and , , and comprise the “hydrophilic side,” a division based on the steric zipper crystal structure of PHF6 (12, 45). When fibrils form, the majority of closest contacts are between sidechains on the hydrophobic sides of PHF6 (Fig. 2B), confirming that the model favors assembly into fibrils enclosing these sidechains in their interiors. On the other hand, at where no fibrils form, the distribution of contacts approaches what would be expected for random, transient, and unbiased association of monomers in solution (roughly 50% for hydrophobic–hydrophilic contacts and 25% each for same-side contacts). A slight enhancement in contacts involving the hydrophobic side suggests that hydrophobic interactions are still slightly favored at high temperatures, even though significant enrichment in hydrophobic contacts only occurs in fibrils. SI Appendix, Fig. S3 D–F illustrates that these contact fractions evolve from initial solution to final fibril values on similar timescales as fibril assembly itself. It is possible that the slight decrease in hydrophobic–hydrophobic contact fractions at the lowest temperatures is due to kinetic arrest in the quickly growing fibrils: At , most chains are depleted from the solution by , and the fibril structure remains effectively “frozen in” from this point on. At, e.g., , however, this occurs more slowly, likely allowing for more annealing during fibril growth.
Under the conditions here, the overall fibrillization process occurs predominantly through primary nucleation from solution followed by fibril growth from attachment of monomers to fibril ends. To probe the growth process, we characterize chains that irreversibly attach to fibrils (SI Appendix, Fig. S4) before and after the moment that contact is made and not subsequently broken. The probability of a chain-fibril contact rises steadily 300 prior to this, suggesting reversible attachment and detachment; interestingly, an increase in contacts involving residues on the hydrophilic sides of PHF6 chains occurs during this period. However, formation of -sheet secondary structure and intermolecular hydrogen bonding, along with the hydrophobic contacts characteristic of the formed fibrils, takes another 300 to be established. That reversible association is seen leading up to integration of a chain into a fibril, and that attaching chains do not immediately adopt their final conformations, suggests either a “dock-and-lock” mechanism (46) for attachment, or that it is necessary for additional monomers to attach on top of an associated chain before it is stabilized within a fibril.
The model also suggests that a delicate balance of interactions governs the orientations (parallel and antiparallel) of -bridges within fibrils. Fig. 2C indicates a bias toward antiparallel alignment, but with a significant amount of orientational disorder, slightly increasing at lower temperatures as the parallel fraction increases toward . In contrast, experiments suggest that PHF6 forms fibrils with parallel -sheets (12, 19). Interestingly, however, the CG model does reproduce the parallel–antiparallel balance present in the reference AA system, which forms 20 to 30 parallel -bridges (SI Appendix, Fig. S5). Several factors are known to influence PHF6 fibril stability, such as electrostatic, -, and CH- interactions (47, 48), and these can vary between atomistic force fields (49), which predict different chain alignments within -sheets (50). Our model suggests a free energetic bias toward antiparallel structures of 1.0 to , so only a small change in force field interaction strengths is necessary to shift it. N-terminal capping, known to control PHF6 fibrillization (51) as well as affect morphologies of fibrils formed from fragments of islet amyloid polypeptide (52, 53), may also influence experimental findings for PHF6 structures. Sawaya et al. (12) provide a structure of uncapped, zwitterionic PHF6 with parallel -sheet alignment, although notably this structure is for microcrystalline rather than fibrillar PHF6, and it involves positively charged lysine sidechains forming favorable electrostatic contacts with negatively charged C-termini of chains in adjacent -sheets in the crystal. However, although Goux et al. (19) do not attempt to obtain atomistic structures of fibrillar PHF6 with neutral terminal caps, they report FTIR spectra consistent with the absence of antiparallel -sheets.
In the end, experimental evidence points toward predominantly parallel orientation of the chains in PHF6 fibrils, although the amount of orientational disorder in real fibrils is unknown. That fibrils grow robustly in our simulations despite significant mixing of parallel and antiparallel -bridges throughout suggests that this kind of order may not be of great importance for PHF6 fibrillization specifically. This contrasts with aggregation of longer tau, which by necessity must form parallel cross- structures in order to stack into regular fibrils of complex folds; if the PHF6 region is involved in initial aggregation stages as a recent study (20) suggests, this raises the interesting possibility of a further aggregation barrier involving strand alignment ordering. The lack of strong specificity, echoed by the variety of behaviors observed in force field predictions, has been observed in AA simulation studies of PHF6 aggregation (54, 55). Moreover, a PHF6 fibrillization study (22) using the CG model of Bereau and Deserno (33) found parallel orientation of chains within -sheets and antiparallel orientation across sheets, consistent with experiments. On the other hand, Cheon et al. (35) showed that the PRIME20 CG model (34) favors antiparallel PHF6 -sheet formation. Notably, however, adjustment of the PRIME20 hydrogen bonding interaction distance constants by just causes PHF6 fibrils with nearly perfect parallel chain orientation to grow. This again highlights the delicate balance of interactions affecting cross- orientation in PHF6 aggregation, compared to the much more robust preference for hydrophobic sidechain contacts inside fibrillar cores that our model captures accurately.
Configurational Landscape for Oligomerization.
Although direct MD simulations of aggregation can reveal general information about fibril structure, they do not distinguish clearly between the roles of thermodynamics and kinetics in governing fibril formation. For instance, simulations in which no fibrils nucleate cannot prove that fibrils are thermodynamically unstable at the simulated conditions as opposed to kinetically inaccessible due to a large nucleation barrier. To more rigorously probe the initial stages of PHF6 aggregation, we use advanced sampling replica exchange MD (REMD) simulations of , , , and total chains to map out the equilibrium configurational landscape of small oligomers. Fig. 3A–C shows representative structures from these simulations for oligomer sizes , , and at .
Fig. 3.

Oligomer structures and thermodynamic properties. (A–C) A representative tetramer, octamer, and 16-mer, respectively, from replica exchange simulations of PHF6 at and . (D) Fractions of non-hydrogen-bonded contacting chains for which the closest pair of sidechains consists of residues from the hydrophobic and hydrophilic sides of PHF6, for a system with , , and . (E) Free energies of oligomers of size in a solution. (F) Critical oligomer sizes estimated from free energies (Upper Panel) and corresponding free energy barrier heights (Lower Panel: Curves are truncated when the most probable value of reaches the largest system size ). Error bars and bands show 95% CIs of mean values, or in the case of , median values.
At low temperature (), the systems spend most of their time in single aggregates that reveal a hierarchy of stable states. For the system, these are simply dimers of two -strands. At , the predominant oligomeric structure consists of a single -sheet (Fig. 3A). The largest system () forms paired sheets (Fig. 3C) similar to small sections of fibrils, while the system forms cylindrical structures (Fig. 3B) distinct from either single or paired -sheets. At , these aggregates break into multiple oligomers of smaller sizes. We use simulation reweighting techniques incorporating data from all temperatures to reveal the probability of oligomeric structures of all sizes and types at . SI Appendix, Fig. S6 shows representative images of the most probable oligomeric structures for all sizes , , , along with the fractions of all possible structures of these sizes that they comprise. Importantly, these results show that single -sheets predominate for , the unique cylindrical structure appears at , and paired -sheets are present for .
The most probable oligomers of all sizes at (SI Appendix, Fig. S7), where the systems sample a wide variety of configurations, reveal more diverse behavior. At this temperature, oligomers of size show -sheets of size with single chains associated with their surfaces. For , the same behavior is seen with or associated chains, until paired sheets appear for . Overall, the results suggest that backbone hydrogen bonding and -sheet formation are crucial for the initial creation of small oligomers from individual chains. As the oligomers grow, hydrophobic interactions between sidechains draw in additional chains to the forming -sheet surfaces, until eventually paired cross- structures characteristic of fibrils are able to form. This is supported by the sidechain contact types observed in oligomers of each size at (Fig. 3D). For small oligomers (), the distribution of contact types is similar to that in solutions without aggregates (see, e.g., in Fig. 2B) but evolves toward that of extended fibrils as increases. A slightly greater preference for antiparallel alignment is seen in smaller oligomers (SI Appendix, Fig. S8), suggesting that sidechain interactions may bias larger oligomers toward increased parallel alignment where they are of greater importance compared to hydrogen bonding alone.
The cylindrical -barrel-like oligomers in the simulations are particularly striking in several ways beyond their unique hydrogen bonding topology. Almost all of these oligomers show antiparallel alignment for all of their -bridges; all of the adjacent pairs of -strands are out of register; moreover, the hydrophobic , , and residues point to the outside of, rather than toward the interior of, the oligomer (SI Appendix, Fig. S9). Notably, the octamers seen here are structurally similar to trimeric and hexameric “cylindrins” first observed in oligomers of the K11V fragment of B-crystallin (56) and to tetramers of an A-containing construct (57). Specifically, Liu et al. (57) demonstrate the formation of cylindrin-like tetramers using model constructs designed to aggregate out-of-register and posit a mechanism for toxicity involving membrane disruption from insertion of the cylindrins aided by their exposed hydrophobic residues, structurally similar to the PHF6 oligomers predicted here. Whether or not the PHF6 cylindrin octamer has any bearing on the potential toxicity of longer PHF6-containing tau fragments is unclear; however, the unique octamer structure nonetheless provides an interesting hypothesis about potentially functional oligomeric structures of PHF6. In any case, an in-register fibril cannot grow from a cylindrin containing out-of-register hydrogen bonds without it first unrolling, then breaking and re-forming these bonds, suggesting that such oligomers could contribute to a nucleation barrier or off-pathway state in PHF6 fibrillization.
To directly assess nucleation barriers, we calculate oligomer free energies for a solution (Fig. 3E). At higher temperatures where aggregation is unfavorable, barriers increase with , presumably due to the entropic penalty for association of free chains into oligomers, while at lower temperatures, they level out and begin to decrease for sufficiently large . This is evident for , in agreement with the large-scale assembly simulations. As the temperature further decreases, the critical oligomer sizes and free energy barrier heights, corresponding to the locations of the maxima in these free energy curves, also decrease. The dependence of these sizes and heights on temperature is shown in Fig. 3F for different solution concentrations. As expected, with increased supersaturation (increasing concentration at constant temperature, or decreasing temperature at a given concentration), fewer monomers must oligomerize to form a critical aggregate, and the free energy penalty is decreased.
Aggregation Phase Behavior.
Beyond small PHF6 oligomers representative of the start of fibril growth, we investigate how larger fibrillar aggregates interact with chains in solution. Here, we first initialize MD simulations with seeds (Fig. 4A) based on a known, parallel -sheet crystal structure of PHF6 (12) (PDB: 2ON9) containing the hydrophobic interface characteristic of the paired PHF6 fibrils observed to grow in our simulations. Similar seeding approaches have been used with other CG models to understand fibril elongation and protofilament assembly (58, 59). Here, the PHF6 seeds are placed in solutions of additional monomers, and we monitor the dynamic equilibrium of chains exchanging between the fibrillar and solution phases. To begin, we choose a fixed temperature of and perform five independent replicate runs each at overall concentrations of , , and , i.e., the solution concentrations that would be present were the seeds to dissolve completely.
Fig. 4.

Fibril seeding and fibril–solution coexistence. (A) Initial state and (B) state after , of a fibrillar seed of size 32 (orange) in a solution of 32 PHF6 (blue) in a volume corresponding to a total concentration , and . (C) Fibril size (solid) and chains never having detached from the fibril (dashed) from 5 replicates each, . Means and SDs over 200 intervals are shown. (D) Theoretical coexistence curve (red – –) of fibrillar PHF6 with solution, fit to observed solution concentrations (green ) in equilibrium with fibrils. Blue and orange symbols indicate the presence or absence, respectively, of persistent aggregates in simulations of 64 PHF6. Error bars show 95% CIs.
The simulations reveal a significant dynamic exchange of monomers with the fibrils. Fig. 4B shows an example of the state of a fibril in one such simulation after (Movie S2). Many of the seed chains initially present (orange) remain, while additional chains (blue) join both ends, mixing with the originals. Overall, seeds grow in the and simulations, while those in the simulations remain roughly around the same size (Fig. 4C, solid lines), illustrating the stability of the seed structures, and the ability of the model to reach an equilibrium coexistence between solution and fibril phases. The number of chains starting in the seeds that never detach into the solution phase (Fig. 4C, dashed lines) decreases with time, showing that chains quickly detach from the ends of fibrils and move about in solution, even if they might later rejoin the fibrils. Similarly, the fraction of parallel -bridges (SI Appendix, Fig. S10A) decreases over time from the initially purely parallel state of the seeds toward the expected value for fibrils grown directly from solution with the CG model. This occurs progressively through series of attachment and detachment events rather than complete loss and recovery of fibril structure, shown by retention of hydrophobic–hydrophobic side contacts (SI Appendix, Fig. S10 B–D) throughout the equilibration process. However, it is clear that at higher concentrations, fibrils equilibrate at a notably slower rate, reflecting the stability of larger fibrils whose interior monomers are far less kinetically accessible than those at the ends.
Based on these findings, the model supports a picture of PHF6 aggregation involving a dynamic equilibrium between fibrils and solution. To map its phase diagram, we find the concentrations of PHF6 solutions at given temperatures that are in equilibrium with fibrils, i.e., the concentrations at which fibrils will neither grow nor shrink on average over time. The blue and orange symbols in Fig. 4D show the temperatures and concentrations at which fibrils do or do not, respectively, both grow over the first of 25- MD simulations of 64 PHF6, starting from solutions, and persist for the duration of the simulations. Once a fibril grows from a solution of initial concentration , the chains not incorporated into the fibril remain in solution, at a concentration .
Fig. 4D shows the simulation-measured coexistence concentrations for each , alongside a fit to a thermodynamic phase boundary scaling law for aggregation discussed in Materials and Methods. The latter predicts , where is the latent heat of fibrillization. This simple van’t Hoff form, which assumes that the heat capacity of a chain in solution is identical to that of one in a fibril, agrees with prior studies of the phase behavior of amyloid systems (60–62). We find here . Although we are not aware of a previously measured value of this quantity for PHF6, it is of a reasonable magnitude, considering, e.g., the value of 22 reported by Wang et al. (62) for paired -sheet aggregates of the A (KLVFFAE) peptide, although unlike these aggregates, we do not observe PHF6 fibrils with more than two -sheets in cross-section.
We find evidence of significant metastability in fibril equilibrium. Many of the state points falling just to the right of the coexistence curve in Fig. 4D do not produce fibrils in the simulations. This behavior is consistent with the finite size and length of the simulations and the anticipated barrier to fibril nucleation observed in oligomer free energies (Fig. 3F), since a sufficiently weakly supersaturated solution may fail to nucleate fibrils on any timescale if the concentration of chains remaining in the solution after formation of a critical nucleus falls below the coexistence concentration. Alternatively, timescales associated with fibril formation and dissolution may simply be very long, illustrated by the , case (SI Appendix, Fig. S11A), contrasted with at the same temperature where no aggregation occurs, and the case where it occurs immediately. At each of these concentrations, we take configurations containing the largest fibrils grown in simulations at and simulate 5 independent replicates at . SI Appendix, Fig. S11 B–D shows that at , 4 out of 5 seeds dissolve by , at , 1 seed dissolves, and at , all remain stable despite shrinking on average. Thus, at conditions close to the saturation line, fibrils in these systems of finite size may be unstable or metastable. Nonetheless, we are still able to extract the temperature-dependent equilibrium concentrations from simulations that do eventually produce fibrils reaching coexistence with a solution phase.
As a final check to demonstrate that these simulations indeed reach equilibrium, we extract rate constants for association and dissociation of monomers from the seeded growth simulations in Fig. 4C as well as simulations of isolated seeds partially dissolving. We solve a master equation describing the time evolution of the seed length probability distribution, similar to approaches previously applied to amyloid systems, often in the context of investigating primary and secondary nucleation mechanisms and fragmentation (63, 64). For this system, we always observe primary nucleation followed by growth via attachment, so our main interest is to consider the growth kinetics. Demonstrations of correspondence between seeded simulations and solutions to the master equation are provided in SI Appendix, Fig. S12 (see Materials and Methods for details). From the rate constants, we then estimate at that , consistent with from the fitted model shown in Fig. 4D.
Influence of Heparin as a Model Polyelectrolyte.
Experimentally, tau fibrillization is often induced by an anionic polyelectrolyte such as heparin or RNA (65). Heparin in particular has been shown not only to act as an initiator for tau aggregation, but also to remain associated with the grown fibrils, reacting stoichiometrically to form stabilizing complexes with tau rather than simply catalyzing fibril nucleation (66, 67). Heparin has furthermore been shown experimentally to enhance PHF6 aggregation and affect fibril morphology in a capping group-dependent manner (51). To quantify the molecular mechanisms behind the influence of polyanions like heparin on aggregation, we develop a CG model for heparin based on known experimentally determined solution conformational ensembles (see Materials and Methods for details). In this model, each saccharide unit in a heparin chain is represented as a single negatively charged CG site, with a screened electrostatic attractive interaction with the positively charged lysine sidechain sites of PHF6. We do not attempt to capture here the chemical details of PHF6-heparin interactions, but instead probe the influence of heparin as an idealized, model anionic polyelectrolyte on PHF6 aggregation.
Simulations of 64 PHF6 at and a range of concentrations, along with single heparin chains of 60 saccharide units (17 ), show that heparin is capable of initiating PHF6 aggregation under conditions where it would not occur spontaneously. Heparin serves as a nucleation site for aggregation (Fig. 5A) but also remains associated with elongated fibrils (see Fig. 5B and Movie S3). At the lowest PHF6 concentration tested, , we do not observe fibril formation in any of independent replicate simulations after : Fig. 5C shows that most chains are found as isolated monomers in solution in this case. At , of replicates form fibrils within ; at , all replicates formed fibrils within the first , and at higher concentrations, fibrillization begins almost immediately (SI Appendix, Fig. S13). In contrast, in identical conditions in the absence of heparin, no fibrillization occurs within for and , while fibrils only form spontaneously without heparin within this timespan once the PHF6 concentration is increased to (SI Appendix, Fig. S14 A–C). Replacing the single heparin 60-mer at (where SI Appendix, Fig. S13B shows fibrillization in all replicates) instead with 15 heparin tetramers, also leads to no aggregation (SI Appendix, Fig. S14D); the same is true when the heparin-PHF6 electrostatic attraction is explicitly excluded from the force field (SI Appendix, Fig. S14E).
Fig. 5.

Heparin-induced aggregation of PHF6. (A) Initial stages of heparin-induced aggregation at and from a system of 64 PHF6 containing a heparin chain of 60 saccharide units. (B) Fully grown fibril under these conditions. (C) Fractions of chains in clusters of different sizes from the last of 5 replicates each of simulations of 64 PHF6 with a heparin chain of 60 saccharide units at . (D) Likewise, fractions of -bridge-participating residues with parallel (vs. antiparallel) orientations, and total numbers of -bridges per chain. (E) Radius of gyration of heparin chains and total electrostatic interaction energy between heparin and lysine sidechain CG sites. Error bars show SDs of the measured properties.
As these electrostatic interactions between heparin and the lysine sidechain sites are the only attractive interactions between the modeled heparin and PHF6 chains, they appear to play a crucial role in enhancing the ability of fibrils to nucleate. The loss of heparin’s cofactor effect upon its fragmentation highlights the importance of its polyanionic nature: Localization of charges in heparin is important for attracting PHF6 chains to form a sufficiently large oligomer. A natural question is whether heparin chains only serve to increase the local concentration of PHF6 or whether heparin also orders assembling chains in some way that affects fibril structure. We do not observe any significant differences in the layer spacing or pitch of heparin-induced vs. spontaneously aggregating fibrils. However, an increased fraction of parallel cross- structures might be expected if the negatively charged polyelectrolyte were to cause the positively charged lysine sidechains to align along it. We do observe some such alignment (Fig. 5D): For transient association of monomers in solution in the absence of aggregation, the parallel fraction is similar to what is observed without any heparin present but concentrations yielding heparin-induced aggregates show an enrichment in parallel -sheets. The time-dependence of the alignment of chains in heparin-associated fibrils (SI Appendix, Fig. S15) shows that some nucleation events produce fibrils initially more enriched in parallel -sheets, but this effect is not universal. Others form initial aggregates with similar parallel alignment fractions to those not induced by heparin and either remain predominantly antiparallel or increase in parallel cross- content over time. It is likely that the particular bias observed in a given fibril is dependent on the conformations of heparin at the time of nucleation and while associated with the extended fibril.
In general, the interplay between the structures of the fibrils and heparin may be complex. In fact, the fibrils themselves affect the conformations explored by heparin, illustrated by a decrease in the radius of gyration of fibril-associated heparin compared to heparin in systems where fibrils are absent (Fig. 5E, Left Axis). This collapse, likely due to the favorable electrostatic interactions between heparin and the lysine sidechains (Fig. 5E, Right Axis), is also captured by a decrease in the average persistence length of heparin: At , it decreases from Å before fibril formation (comparable with Å for the reference conformations and 21 Å (68, 69) and 45 Å (70) from other experiments) to Å after fibril formation. Notably, heparin’s interaction with PHF6 fibrils is consistent with the observed behavior of heparin in other amyloid systems, such as full-length tau as discussed above, as well as with an atomistic simulation study by Khurshid et al. (71) of heparin-assisted aggregation of the A (KLVFFA) hexapeptide. The latter study observed significant flexing of aggregate-associated heparin chains compared to their normal, more extended solution conformations, and furthermore showed that artificially constraining heparin to remain extended decreases its ability to induce aggregation. We note, given that we do not use reference systems including both heparin and PHF6 interacting, that the magnitude of the changes in heparin chain properties upon PHF6 aggregation may not be quantitative; however, the results nonetheless provide insight into the influence of an anionic polyelectrolyte on PHF6 aggregation and suggest future work to probe the specific role of chain stiffness. Specifically, these results highlight the active role of such a polyelectrolyte in the aggregation process, not only as a catalyst but also as a reactant in the structure of formed fibrils.
Conclusions
In this study, we have shown that a purely bottom-up CG model of PHF6 developed using relative entropy minimization is able to accurately capture the interactions necessary to model the fibrillar aggregation of PHF6. Notably, no manual tuning of interaction parameters, or input of experimental or simulated fibril geometry data, is needed; realistic fibrillization behavior arises from interactions determined solely from small-scale reference atomistic simulations not including fibril formation. The resulting simulated fibrils show important hallmarks of amyloid aggregation, namely, structures with long-range fibrillar order maintained through cross- hydrogen bonding along their lengths, and in this case, helically wound paired protofilaments held together by hydrophobic interactions. Importantly, the model enables simulations of systems with sizes larger and timescales longer than are generally accessible through atomistic simulations alone. Significant acceleration of what would otherwise be intractably slow timescales for PHF6 chains exploring configurational space permits the mapping out of the conformational and free energetic landscape of oligomers and the determination of equilibrium fibril phase behavior.
The CG simulations here reveal important features of PHF6 aggregation that may be informative in understanding the wider issue of fibril formation of longer tau fragments. While the model does not reproduce a strong bias of PHF6 toward parallel -sheets as suggested by experiments, it demonstrates that, unlike in amyloid aggregation of much longer peptides where parallel alignment is necessary for any kind of fibrillar order, this is not of critical importance for PHF6. We observe significant disorder within fibrils with respect to parallel vs. antiparallel alignment, see that purely parallel alignment of chains in an initial fibrillar seed readily becomes more disordered upon exchange with chains in solution and show that it can even be influenced by association of heparin with the fibrils. All of these processes can occur without loss of the properties actually crucial for fibril formation, namely, the formation of cross- hydrogen bonds along protofilaments and of hydrophobic contacts in the interface between protofilaments.
Results highlighting the structural properties of oligomers point to the importance of these hydrophobic contacts for sufficiently large aggregates once paired -sheets begin to form. The transition from a mixture of various kinds of sidechain contacts to the almost exclusive presence of contacts between sidechains on the hydrophobic sides of PHF6 chains as oligomer size increases suggests a cooperative effect governing oligomer structures: Sufficiently many hydrogen bonds are needed to stabilize small oligomers that paired sheets do not form, but as the number of chains grows, more such contacts can form within these paired structures. Such a mechanism could be relevant in explaining the high kinetic barrier to primary nucleation of fibrils from larger tau fragments, where the pairing of protofilaments is partially replaced by peptides folding in particular ways so as to optimize the sidechain contacts formed. That heparin-induced PHF6 fibrils are stabilized by electrostatic attraction of heparin to lysine sidechains is also consistent with the known behavior of heparin complexation with larger tau fragments. Further studies with this coarse-graining methodology applied to larger fragments could shed more light on the structures of oligomers in these aggregates, the effects of seeding by multiple distinct fibrillar folds, and the role of heparin and other polyelectrolytes in structuring larger aggregates. In particular, extension to longer constructs may be particularly informative for understanding the interplay between the PHF6 region and other parts of the chain in organizing the initial stages of tau aggregation, as suggested by very recent experimental work (20).
Materials and Methods
Relative Entropy Coarse-Graining of PHF6.
We used relative entropy minimization to parameterize a CG model of PHF6. The relative entropy of a CG system with respect to an AA reference system is:
| [1] |
where is the probability of CG configurations given CG model parameters , and is the corresponding distribution of AA configurations mapped to CG coordinates by the mapping . For a given AA reference system, model parameters are found by minimizing . The theory and implementation of this approach are detailed elsewhere (38–40). The relative entropy is extensible to multiple AA reference ensembles as:
| [2] |
where is the relative entropy for a given AA system and the corresponding CG ensemble. Such an extended-ensemble approach was proposed by Mullinax and Noid (72) in the context of force matching, and the form of Eq. 2 for was justified by Sanyal et al. (43).
Here, we used an AA reference system of 3 interacting PHF6 peptides. Each PHF6 chain is capped with neutral acetyl and N-methylamine groups on its N- and C-termini (i.e., Ac–VQIVYK–NHCH). N- and C-terminal capping has been shown to affect PHF6 fibril formation in vitro, with uncapped, zwitterionic PHF6 exhibiting lower aggregation propensity (51), motivating our choice of charge-neutral capping groups. We used the Amber ff14SBonlysc force field (73) with the GB-Neck2 generalized Born implicit solvation model (74) and the pwSASA method (75) for solvent-accessible surface area estimation in all reference AA simulations. The use of an implicit-solvent AA 3-chain reference system is motivated by the need to achieve extensive sampling of conformational space using REMD, including associated and dissociated states, which becomes significantly more challenging with explicit-solvent models and particularly for larger chains. A 4-chain reference system yields a CG model with nearly identical behavior, and properties of grown fibrils, to that created from the 3-chain reference system (SI Appendix, Fig. S16). Further simulation details are given in SI Appendix, section A.
We used a formulation (76) of the multistate Bennett acceptance ratio (MBAR) method (77) for analysis and reweighting of REMD trajectories. The DSSP algorithm and its criterion for backbone hydrogen bonding (78, 79) identified hydrogen bonds and secondary structures. The REMD simulation of the reference system was reweighted to two temperatures and for use as two reference ensembles in Eq. 2. We chose as a representative lower temperature to include configurations with significant cross- hydrogen bonding, and we set the higher temperature at the inflection point of the -strand secondary structure fraction to include partially associated states (SI Appendix, Fig. S17A). also corresponds closely with the maximum of the trace of the Fisher information matrix of the relative entropy with respect to the model parameters (SI Appendix, Fig. S17B), which was shown by Shen et al. (80) to yield improved predictions from CG models.
We chose a mapping from centers of mass of atoms to CG site coordinates (Fig. 1A) including only heavy (non-H) atoms. The CG force field consists of bond, angle, and proper dihedral interactions, as well as pairwise interactions between sites, excluding 1–2, 1–3, and 1–4 bond connections. SI Appendix, section B gives details of the CG mapping and force field terms, and SI Appendix, section C describes the CG simulations used during model optimization. SI Appendix, Figs. S18–S22 show plots of the CG potentials, along with AA and CG probability distributions for associated degrees of freedom, and a Python script to tabulate potentials from their parameters is provided as supporting information.
Coarse-Grained Model Simulations and Analysis.
We performed 5 to 25 MD simulations with the optimized CG model at temperatures ranging between 320 to 370 and concentrations between 1 and 10 , with 64 to 512 peptides in the systems; we chose other simulation parameters identically to the CG simulations used for model optimization. Initial configurations distributed peptides at random in the periodic simulation boxes and were equilibrated at for , or used fibrillar seeds generated from the crystal structure of PHF6 due to Sawaya et al. (12) (PDB: 2ON9). Seeds containing 32 or 64 PHF6 (16 or 32 fibril layers) were relaxed for using CG MD simulations with temperatures increasing from to in equal-length steps of (SI Appendix, Fig. S23). In addition to simulations at single temperatures, we performed CG REMD simulations of 2, 4, 8, and 16 peptides over a range of temperatures between 290 to 370 , at concentrations of (see SI Appendix, section D for details). Finally, we performed CG simulations to compare performance with implicit- and explicit-solvent AA systems (SI Appendix, section E).
CG trajectories were analyzed by first mapping CG N, C, and O sites back to N, H, C, C, and O atoms. Motivated by other simple protein backmapping schemes (81, 82), we devised a geometric approach to identify coordinates of H, C, and O atoms from those of CG sites (SI Appendix, section F). We then performed backbone hydrogen bond and secondary structure analysis as with the AA trajectories. Fibrils, oligomers, and other aggregates were identified via cluster analysis, with two PHF6 chains considered to be in contact if any of their sidechain sites were within 7 Å. This cutoff was chosen based on sidechain–sidechain radial distribution functions (SI Appendix, Fig. S24) of the trajectories of Fig. 1. Oligomers isolated with this clustering criterion were characterized by the eigenvalue spectra of the adjacency matrices of their backbone hydrogen bond graphs; such spectra provide an efficient approximate method to distinguish graph topologies (83). Helix geometries and aggregate sphericities were found using principal moments and axes from C sites of individual peptides and C site centroids of peptides in clusters (SI Appendix, section G). All renderings of CG trajectories were made with the UCSF ChimeraX (84, 85) molecular visualization software.
We used conformational ensembles of heparin chains containing 18, 24, 30, and 36 saccharide units (PDB: 4J8H, 4J8I, 4J8J, 4J8K) derived from solution scattering data (86, 87) as reference systems for relative entropy optimization of the CG polyelectrolyte model. We mapped all heavy atoms of a saccharide unit to a single site. We chose a screened Coulomb potential for heparin-heparin and heparin–lysine sidechain interactions, assigning charges to heparin sites, and to lysine sidechains. To avoid overlaps, an repulsive potential was applied between all heparin and PHF6 sites. Interaction functional forms used and their optimized or selected parameters are given in SI Appendix, section H.
Thermodynamics of Oligomerization and Aggregation and Growth Kinetics.
To relate oligomer size distributions to free energies, we suppose that a canonical system of molecules in a volume is arranged such that there are unassociated monomers, dimers, etc., and in general, oligomers of size , and that it behaves as an ideal mixture of oligomers. Its partition function can be written as
| [3] |
where is the partition function for a single molecule, denotes the set of all oligomer size distributions {N} such that , and , where is the free energy of an oligomer of size in the volume . The average number of oligomers of size in the system is
| [4] |
a system of these equations can be solved for the given values of from simulations. Unlike the , which depend on the finite size of the system, these free energies can be used to predict the behavior of systems of any size (88). More details are given in SI Appendix, section I.
For large , it is impractical to evaluate these expressions due to the magnitude of . Working instead from the grand canonical ensemble, it is possible to estimate the free energy for forming an oligomer of size from a solution of monomers of concentration in the limit as
| [5] |
where is the volume to which corresponds. Alternatively, to analyze fibril–solution coexistence, we can assume constant and equivalent heat capacities of PHF6 in both phases, giving
| [6] |
where , is a fibrillization-associated energy, and is a constant. Details are provided in SI Appendix, section I.
To find rate constants for monomer-wise growth and dissolution of fibrils from the seeded simulations, we first assume that a system with a fixed number of chains has a single fibril of size along with monomers. We consider the reactions , with the rates and . For a given simulation, the constants are fit to fibril length data taken at periodic intervals using a maximum likelihood approach on the probabilities with . We find and . Since relative entropy coarse-graining establishes a rigorous AA-to-CG correspondence only with equilibrium configurations, not dynamics (89), unless a modified theoretical approach is used to explicitly account for them (90, 91), such rate constants should only be considered qualitatively. However, at equilibrium, we can meaningfully interpret the ratio . More details on this and the master equation model are given in SI Appendix, section J.
Supplementary Material
Appendix 01 (PDF)
Dataset S01 (TXT)
Animated rendering of nucleation and growth of PHF6 fibrils from solution at T = 350 K and ρ = 10 mM.
Animated rendering of equilibration of a fibrillar seed of PHF6 with a solution at T = 350 K and ρ = 9 mM. Molecular positions are translated such that the rendering remains centered on the seed.
Animated rendering of heparin-induced nucleation and growth of PHF6 fibrils from solution at T = 350 K, ρ = 2.5 mM. Molecular positions are translated such that the rendering remains centered on the heparin chain.
Acknowledgments
We gratefully acknowledge funding support from the NSF through Award No. CHEM-1800344. We acknowledge the W. M. Keck Foundation for a Medical Research Grant. This material is based upon work supported by the NSF Graduate Research Fellowship under Grant No. 1650114. Use was made of computational facilities purchased with funds from the NSF (OAC-1925717) and administered by the Center for Scientific Computing (CSC). The CSC is supported by the California NanoSystems Institute and the Materials Research Science and Engineering Center (MRSEC; NSF DMR 1720256) at University of California, Santa Barbara. We are grateful to Pritam Ganguly, Songi Han, Kenneth Kosik, Samuel Lobo, Andrew Longhini, Saeed Najafi, Joan-Emma Shea, and Michael Vigers for helpful discussions during the preparation of this work.
Author contributions
E.P. and M.S.S. designed research; E.P. performed research; E.P. analyzed data; and E.P. and M.S.S. wrote the paper.
Competing interests
The authors declare no competing interest.
Footnotes
This article is a PNAS Direct Submission. G.A.V. is a guest editor invited by the Editorial Board.
Data, Materials, and Software Availability
All study data are included in the article and/or supporting information.
Supporting Information
References
- 1.Ballatore C., Lee V. M. Y., Trojanowski J. Q., Tau-mediated neurodegeneration in Alzheimer’s disease and related disorders. Nat. Rev. Neurosci. 8, 663–672 (2007). [DOI] [PubMed] [Google Scholar]
- 2.Goedert M., Eisenberg D. S., Crowther R. A., Propagation of tau aggregates and neurodegeneration. Annu. Rev. Neurosci. 40, 189–210 (2017). [DOI] [PubMed] [Google Scholar]
- 3.Sanders D., et al. , Distinct tau prion strains propagate in cells and mice and define different tauopathies. Neuron 82, 1271–1288 (2014). [DOI] [PMC free article] [PubMed] [Google Scholar]
- 4.Vaquer-Alicea J., Diamond M. I., Joachimiak L. A., Tau strains shape disease. Acta Neuropathol. 142, 57–71 (2021). [DOI] [PMC free article] [PubMed] [Google Scholar]
- 5.Fitzpatrick A. W. P., et al. , Cryo-EM structures of tau filaments from Alzheimer’s disease. Nature 547, 185–190 (2017). [DOI] [PMC free article] [PubMed] [Google Scholar]
- 6.Falcon B., et al. , Structures of filaments from Pick’s disease reveal a novel tau protein fold. Nature 561, 137–140 (2018). [DOI] [PMC free article] [PubMed] [Google Scholar]
- 7.Falcon B., et al. , Novel tau filament fold in chronic traumatic encephalopathy encloses hydrophobic molecules. Nature 568, 420–423 (2019). [DOI] [PMC free article] [PubMed] [Google Scholar]
- 8.Zhang W., et al. , Novel tau filament fold in corticobasal degeneration. Nature 580, 283–287 (2020). [DOI] [PMC free article] [PubMed] [Google Scholar]
- 9.Shi Y., et al. , Structure-based classification of tauopathies. Nature 598, 359–363 (2021). [DOI] [PMC free article] [PubMed] [Google Scholar]
- 10.Ganguly P., et al. , Tau assembly: The dominant role of PHF6 (VQIVYK) in microtubule binding region repeat R3. J. Phys. Chem. B 119, 4582–4593 (2015). [DOI] [PMC free article] [PubMed] [Google Scholar]
- 11.von Bergen M., et al. , Assembly of protein into Alzheimer paired helical filaments depends on a local sequence motif () forming structure. Proc. Natl. Acad. Sci. U.S.A. 97, 5129–5134 (2000). [DOI] [PMC free article] [PubMed] [Google Scholar]
- 12.Sawaya M. R., et al. , Atomic structures of amyloid cross- spines reveal varied steric zippers. Nature 447, 453–457 (2007). [DOI] [PubMed] [Google Scholar]
- 13.Daebel V., et al. , -Sheet core of tau paired helical filaments revealed by solid-state NMR. J. Am. Chem. Soc. 134, 13982–13989 (2012). [DOI] [PubMed] [Google Scholar]
- 14.Liu H., et al. , Disclosing the mechanism of spontaneous aggregation and template-induced misfolding of the key hexapeptide (PHF6) of tau protein based on molecular dynamics simulation. ACS Chem. Neurosci. 10, 4810–4823 (2019). [DOI] [PubMed] [Google Scholar]
- 15.Yang J., Agnihotri M. V., Huseby C. J., Kuret J., Singer S. J., A theoretical study of polymorphism in VQIVYK fibrils. Biophys. J. 120, 1396–1416 (2021). [DOI] [PMC free article] [PubMed] [Google Scholar]
- 16.Goedert M., Spillantini M. C., Rutherford D., Crowther R. A., Multiple isoforms of human microtubule-associated protein tau: Sequences and localization in neurofibrillar tangles of Alzheimer’s disease. Neuron 3, 519–526 (1989). [DOI] [PubMed] [Google Scholar]
- 17.Giannetti A. M., et al. , Fibers of tau fragments, but not full length tau, exhibit a cross -structure: Implications for the formation of paired helical filaments. Protein Sci. 9, 2427–2435 (2000). [DOI] [PMC free article] [PubMed] [Google Scholar]
- 18.Li W., Lee V. M. Y., Characterization of two VQIXXK motifs for tau fibrillization in vitro. Biochemistry 45, 15692–15701 (2006). [DOI] [PubMed] [Google Scholar]
- 19.Goux W. J., et al. , The formation of straight and twisted filaments from short tau peptides. J. Biol. Chem. 279, 26868–26875 (2004). [DOI] [PubMed] [Google Scholar]
- 20.S. Lövestam et al., Disease-specific tau filaments assemble via polymorphic intermediates. bioRxiv [Preprint] (2023). https://www.biorxiv.org/content/10.1101/2023.07.24.550295v1 (Accessed 8 September 2023). [DOI] [PMC free article] [PubMed]
- 21.Wu C., Shea J. E., Coarse-grained models for protein aggregation. Curr. Opin. Struct. Biol. 21, 209–220 (2011). [DOI] [PubMed] [Google Scholar]
- 22.Smit F. X., Luiken J. A., Bolhuis P. G., Primary fibril nucleation of aggregation prone tau fragments PHF6 and PHF6*. J. Phys. Chem. B 121, 3250–3261 (2017). [DOI] [PubMed] [Google Scholar]
- 23.Li M. S., Klimov D. K., Straub J. E., Thirumalai D., Probing the mechanisms of fibril formation using lattice models. J. Chem. Phys. 129, 175101 (2008). [DOI] [PMC free article] [PubMed] [Google Scholar]
- 24.Abeln S., Vendruscolo M., Dobson C. M., Frenkel D., A simple lattice model that captures protein folding, aggregation and amyloid formation. PLoS One 9, e85185 (2014). [DOI] [PMC free article] [PubMed] [Google Scholar]
- 25.Bieler N. S., Knowles T. P. J., Frenkel D., Vácha R., Connecting macroscopic observables and microscopic assembly events in amyloid formation using coarse grained simulations. PLoS Comput. Biol. 8, e1002692 (2012). [DOI] [PMC free article] [PubMed] [Google Scholar]
- 26.Šarić A., Chebaro Y. C., Knowles T. P. J., Frenkel D., Crucial role of nonspecific interactions in amyloid nucleation. Proc. Natl. Acad. Sci. U.S.A. 111, 17869–17874 (2014). [DOI] [PMC free article] [PubMed] [Google Scholar]
- 27.Davtyan A., et al. , AWSEM-MD: Protein structure prediction using coarse-grained physical potentials and bioinformatically based local structure biasing. J. Phys. Chem. B 116, 8494–8503 (2012). [DOI] [PMC free article] [PubMed] [Google Scholar]
- 28.Chen M., Schafer N. P., Zheng W., Wolynes P. G., The associative memory, water mediated, structure and energy model (AWSEM)-amylometer: Predicting amyloid propensity and fibril topology using an optimized folding landscape model. ACS Chem. Neurosci. 9, 1027–1039 (2018). [DOI] [PubMed] [Google Scholar]
- 29.Sterpone F., et al. , The OPEP protein model: From single molecules, amyloid formation, crowding and hydrodynamics to DNA/RNA systems. Chem. Soc. Rev. 43, 4871–4893 (2014). [DOI] [PMC free article] [PubMed] [Google Scholar]
- 30.Nasica-Labouze J., Meli M., Derreumaux P., Colombo G., Mousseau N., A multiscale approach to characterize the early aggregation steps of the amyloid-forming peptide GNNQQNY from the yeast prion Sup-35. PLoS Comput. Biol. 7, e1002051 (2011). [DOI] [PMC free article] [PubMed] [Google Scholar]
- 31.Maisuradze G. G., Senet P., Czaplewski C., Liwo A., Scheraga H. A., Investigation of protein folding by coarse-grained molecular dynamics with the UNRES force field. J. Phys. Chem. A 114, 4471–4485 (2010). [DOI] [PMC free article] [PubMed] [Google Scholar]
- 32.Rojas A., Liwo A., Browne D., Scheraga H. A., Mechanism of fiber assembly: Treatment of A peptide aggregation with a coarse-grained united-residue force field. J. Mol. Biol. 404, 537–552 (2010). [DOI] [PMC free article] [PubMed] [Google Scholar]
- 33.Bereau T., Deserno M., Generic coarse-grained model for protein folding and aggregation. J. Chem. Phys. 130, 235106 (2009). [DOI] [PMC free article] [PubMed] [Google Scholar]
- 34.Cheon M., Chang I., Hall C. K., Extending the PRIME model for protein aggregation to all 20 amino acids. Proteins 78, 2950–2960 (2010). [DOI] [PMC free article] [PubMed] [Google Scholar]
- 35.Cheon M., Chang I., Hall C. K., Influence of temperature on formation of perfect tau fragment fibrils using PRIME20/DMD simulations. Protein Sci. 21, 1514–1527 (2012). [DOI] [PMC free article] [PubMed] [Google Scholar]
- 36.Izvekov S., Voth G. A., A multiscale coarse-graining method for biomolecular systems. J. Phys. Chem. B 109, 2469–2473 (2005). [DOI] [PubMed] [Google Scholar]
- 37.Izvekov S., Voth G. A., Multiscale coarse graining of liquid-state systems. J. Chem. Phys. 123, 134105 (2005). [DOI] [PubMed] [Google Scholar]
- 38.Shell M. S., The relative entropy is fundamental to multiscale and inverse thermodynamic problems. J. Chem. Phys. 129, 144108 (2008). [DOI] [PubMed] [Google Scholar]
- 39.Chaimovich A., Shell M. S., Anomalous waterlike behavior in spherically-symmetric water models optimized with the relative entropy. Phys. Chem. Chem. Phys. 11, 1901 (2009). [DOI] [PubMed] [Google Scholar]
- 40.Chaimovich A., Shell M. S., Coarse-graining errors and numerical optimization using a relative entropy framework. J. Chem. Phys. 134, 094112 (2011). [DOI] [PubMed] [Google Scholar]
- 41.Carmichael S. P., Shell M. S., A new multiscale algorithm and its application to coarse-grained peptide models for self-assembly. J. Phys. Chem. B 116, 8383–8393 (2012). [DOI] [PubMed] [Google Scholar]
- 42.Carmichael S. P., Shell M. S., Entropic (de)stabilization of surface-bound peptides conjugated with polymers. J. Chem. Phys. 143, 243103 (2015). [DOI] [PubMed] [Google Scholar]
- 43.Sanyal T., Mittal J., Shell M. S., A hybrid, bottom-up, structurally accurate, Gō-like coarse-grained protein model. J. Chem. Phys. 151, 044111 (2019). [DOI] [PMC free article] [PubMed] [Google Scholar]
- 44.Adamcik J., Mezzenga R., Adjustable twisting periodic pitch of amyloid fibrils. Soft Matter 7, 5437 (2011). [Google Scholar]
- 45.Wiltzius J. J. W., et al. , Molecular mechanisms for protein-encoded inheritance. Nat. Struct. Mol. Biol. 16, 973–978 (2009). [DOI] [PMC free article] [PubMed] [Google Scholar]
- 46.Nguyen P. H., Li M. S., Stock G., Straub J. E., Thirumalai D., Monomer adds to preformed structured oligomers of A-peptides by a two-stage dock-lock mechanism. Proc. Natl. Acad. Sci. U.S.A. 104, 111–116 (2007). [DOI] [PMC free article] [PubMed] [Google Scholar]
- 47.Zhao J. H., et al. , Molecular dynamics simulations to investigate the stability and aggregation behaviour of the amyloid-forming peptide VQIVYK from tau protein. Mol. Simul. 36, 1013–1024 (2010). [Google Scholar]
- 48.Sogawa K., et al. , CH- interaction in VQIVYK sequence elucidated by NMR spectroscopy is essential for PHF formation of tau. Biopolymers 102, 288–295 (2014). [DOI] [PubMed] [Google Scholar]
- 49.Li Y., Peng X., Comparison of the force fields on monomeric and fibrillar PHF6 of tau protein. Biophys. Chem. 277, 106631 (2021). [DOI] [PubMed] [Google Scholar]
- 50.Man V. H., He X., Gao J., Wang J., Effects of all-atom molecular mechanics force fields on amyloid peptide assembly: The case of PHF6 peptide of tau protein. J. Chem. Theory Comput. 17, 6458–6471 (2021). [DOI] [PMC free article] [PubMed] [Google Scholar]
- 51.Arya S., et al. , Terminal capping of an amyloidogenic tau fragment modulates its fibrillation propensity. J. Phys. Chem. B 124, 8772–8783 (2020). [DOI] [PubMed] [Google Scholar]
- 52.Wang S. T., et al. , Sequence-dependent self-assembly and structural diversity of islet amyloid polypeptide-derived -sheet fibrils. ACS Nano 11, 8579–8589 (2017). [DOI] [PMC free article] [PubMed] [Google Scholar]
- 53.Zottig X., et al. , Guiding the morphology of amyloid assemblies by electrostatic capping: From polymorphic twisted fibrils to uniform nanorods. Small 15, 1901806 (2019). [DOI] [PubMed] [Google Scholar]
- 54.Li D. W., Mohanty S., Irbäck A., Huo S., Formation and growth of oligomers: A Monte Carlo study of an amyloid tau fragment. PLoS Comput. Biol. 4, e1000238 (2008). [DOI] [PMC free article] [PubMed] [Google Scholar]
- 55.C. Fagnen, J. Giovannini, M. Catto, A. S. Voisin-Chiret, J. Sopkova-de Oliveira Santos, On the tracks of the aggregation mechanism of the PHF6 peptide from tau protein: Molecular dynamics, energy, and interaction network investigations. ACS Chem. Neurosci.13, 2874–2887 (2022). [DOI] [PubMed]
- 56.Laganowsky A., et al. , Atomic view of a toxic amyloid small oligomer. Science 335, 1228–1231 (2012). [DOI] [PMC free article] [PubMed] [Google Scholar]
- 57.Liu C., et al. , Out-of-register -sheets suggest a pathway to toxic amyloid aggregates. Proc. Natl. Acad. Sci. U.S.A. 109, 20913–20918 (2012). [DOI] [PMC free article] [PubMed] [Google Scholar]
- 58.Zhang J., Muthukumar M., Simulations of nucleation and elongation of amyloid fibrils. J. Chem. Phys. 130, 035102 (2009). [DOI] [PMC free article] [PubMed] [Google Scholar]
- 59.Sørensen J., Periole X., Skeby K. K., Marrink S. J., Schiøtt B., Protofibrillar assembly toward the formation of amyloid fibrils. J. Phys. Chem. Lett. 2, 2385–2390 (2011). [Google Scholar]
- 60.Auer S., Kashchiev D., Phase diagram of -helical and -sheet forming peptides. Phys. Rev. Lett. 104, 168105 (2010). [DOI] [PubMed] [Google Scholar]
- 61.Rizzi L. G., Auer S., Amyloid fibril solubility. J. Phys. Chem. B 119, 14631–14636 (2015). [DOI] [PubMed] [Google Scholar]
- 62.Wang Y., et al. , Thermodynamic phase diagram of amyloid- (16–22) peptide. Proc. Natl. Acad. Sci. U.S.A. 116, 2091–2096 (2019). [DOI] [PMC free article] [PubMed] [Google Scholar]
- 63.Knowles T. P. J., et al. , An analytical solution to the kinetics of breakable filament assembly. Science 326, 1533–1537 (2009). [DOI] [PubMed] [Google Scholar]
- 64.Michaels T. C. T., Knowles T. P. J., Mean-field master equation formalism for biofilament growth. Am. J. Phys. 82, 476–483 (2014). [Google Scholar]
- 65.Nizynski B., Dzwolak W., Nieznanski K., Amyloidogenesis of Tau protein. Protein Sci. 26, 2126–2150 (2017). [DOI] [PMC free article] [PubMed] [Google Scholar]
- 66.Fichou Y., et al. , Cofactors are essential constituents of stable and seeding-active tau fibrils. Proc. Natl. Acad. Sci. U.S.A. 115, 13234–13239 (2018). [DOI] [PMC free article] [PubMed] [Google Scholar]
- 67.Fichou Y., et al. , Tau-cofactor complexes as building blocks of tau fibrils. Front. Neurosci. 13, 1339 (2019). [DOI] [PMC free article] [PubMed] [Google Scholar]
- 68.Stivala S. S., Physico-chemical studies of fractionated bovine heparin. V. Some low-angle X-ray scattering data. Arch. Biochem. Biophys. 127, 795–802 (1968). [DOI] [PubMed] [Google Scholar]
- 69.Khorramian B., Stivala S., Small-angle X-ray scattering of high- and low-affinity heparin. Arch. Biochem. Biophys. 247, 384–392 (1986). [DOI] [PubMed] [Google Scholar]
- 70.Pavlov G., Finet S., Tatarenko K., Korneeva E., Ebel C., Conformation of heparin studied with macromolecular hydrodynamic methods and X-ray scattering. Eur. Biophys. J. 32, 437–449 (2003). [DOI] [PubMed] [Google Scholar]
- 71.Khurshid B., et al. , Heparin-assisted amyloidogenesis uncovered through molecular dynamics simulations. ACS Omega 7, 15132–15144 (2022). [DOI] [PMC free article] [PubMed] [Google Scholar]
- 72.Mullinax J. W., Noid W. G., Extended ensemble approach for deriving transferable coarse-grained potentials. J. Chem. Phys. 131, 104110 (2009). [Google Scholar]
- 73.Nguyen H., Maier J., Huang H., Perrone V., Simmerling C., Folding simulations for proteins with diverse topologies are accessible in days with a physics-based force field and implicit solvent. J. Am. Chem. Soc. 136, 13959–13962 (2014). [DOI] [PMC free article] [PubMed] [Google Scholar]
- 74.Nguyen H., Roe D. R., Simmerling C., Improved generalized Born solvent model parameters for protein simulations. J. Chem. Theory Comput. 9, 2020–2034 (2013). [DOI] [PMC free article] [PubMed] [Google Scholar]
- 75.Huang H., Simmerling C., Fast pairwise approximation of solvent accessible surface area for implicit solvent simulations of proteins on CPUs and GPUs. J. Chem. Theory Comput. 14, 5797–5814 (2018). [DOI] [PMC free article] [PubMed] [Google Scholar]
- 76.Ding X., Vilseck J. Z., Brooks C. L., Fast solver for large scale multistate Bennett acceptance ratio equations. J. Chem. Theory Comput. 15, 799–802 (2019). [DOI] [PMC free article] [PubMed] [Google Scholar]
- 77.Shirts M. R., Chodera J. D., Statistically optimal analysis of samples from multiple equilibrium states. J. Chem. Phys. 129, 124105 (2008). [DOI] [PMC free article] [PubMed] [Google Scholar]
- 78.Kabsch W., Sander C., Dictionary of protein secondary structure: Pattern recognition of hydrogen-bonded and geometrical features. Biopolymers 22, 2577–2637 (1983). [DOI] [PubMed] [Google Scholar]
- 79.Touw W. G., et al. , A series of PDB-related databanks for everyday needs. Nucleic Acids Res. 43, D364–D368 (2015). [DOI] [PMC free article] [PubMed] [Google Scholar]
- 80.Shen K., et al. , Learning composition-transferable coarse-grained models: Designing external potential ensembles to maximize thermodynamic information. J. Chem. Phys. 153, 154116 (2020). [DOI] [PubMed] [Google Scholar]
- 81.Lombardi L. E., Martí M. A., Capece L., CG2AA: Backmapping protein coarse-grained structures. Bioinformatics 32, 1235–1237 (2016). [DOI] [PubMed] [Google Scholar]
- 82.Machado M. R., Pantano S., SIRAH tools: Mapping, backmapping and visualization of coarse-grained models. Bioinformatics 32, 1568–1570 (2016). [DOI] [PubMed] [Google Scholar]
- 83.Wills P., Meyer F. G., Metrics for graph comparison: A practitioner’s guide. PLoS One 15, e0228728 (2020). [DOI] [PMC free article] [PubMed] [Google Scholar]
- 84.Goddard T. D., et al. , UCSF ChimeraX: Meeting modern challenges in visualization and analysis. Protein Sci. 27, 14–25 (2018). [DOI] [PMC free article] [PubMed] [Google Scholar]
- 85.Pettersen E. F., et al. , UCSF ChimeraX: Structure visualization for researchers, educators, and developers. Protein Sci. 30, 70–82 (2021). [DOI] [PMC free article] [PubMed] [Google Scholar]
- 86.Khan S., Gor J., Mulloy B., Perkins S. J., Semi-rigid solution structures of heparin by constrained X-ray scattering modelling: New insight into heparin-protein complexes. J. Mol. Biol. 395, 504–521 (2010). [DOI] [PubMed] [Google Scholar]
- 87.S. Khan, J. Gor, B. Mulloy, S. J. Perkins, Corrigendum to Semi-rigid solution structures of heparin by constrained X-ray scattering modelling: New insight into heparin–protein complexes. J. Mol. Biol. 395, 504–521 (2010). J. Mol. Biol. 425, 1847 (2013). [DOI] [PubMed]
- 88.Kindt J. T., Accounting for finite-number effects on cluster size distributions in simulations of equilibrium aggregation. J. Chem. Theory Comput. 9, 147–152 (2013). [DOI] [PubMed] [Google Scholar]
- 89.Jin J., Schweizer K. S., Voth G. A., Understanding dynamics in coarse-grained models. I. Universal excess entropy scaling relationship. J. Chem. Phys. 158, 034103 (2023). [DOI] [PubMed] [Google Scholar]
- 90.Español P., Zúñiga I., Obtaining fully dynamic coarse-grained models from MD. Phys. Chem. Chem. Phys. 13, 10538 (2011). [DOI] [PubMed] [Google Scholar]
- 91.Katsoulakis M. A., Plecháč P., Information-theoretic tools for parametrized coarse-graining of non-equilibrium extended systems. J. Chem. Phys. 139, 074115 (2013). [DOI] [PubMed] [Google Scholar]
Associated Data
This section collects any data citations, data availability statements, or supplementary materials included in this article.
Supplementary Materials
Appendix 01 (PDF)
Dataset S01 (TXT)
Animated rendering of nucleation and growth of PHF6 fibrils from solution at T = 350 K and ρ = 10 mM.
Animated rendering of equilibration of a fibrillar seed of PHF6 with a solution at T = 350 K and ρ = 9 mM. Molecular positions are translated such that the rendering remains centered on the seed.
Animated rendering of heparin-induced nucleation and growth of PHF6 fibrils from solution at T = 350 K, ρ = 2.5 mM. Molecular positions are translated such that the rendering remains centered on the heparin chain.
Data Availability Statement
All study data are included in the article and/or supporting information.