Abstract
Sonodynamic therapy (SDT), which uses ultrasound to trigger a sonosensitizer to generate reactive oxygen species (ROS), is a promising form of cancer therapy with outstanding tissue penetration depth. However, the sonosensitizer may inevitably spread to surrounding healthy tissue beyond the tumor, resulting in undesired side effects under an ultrasound stimulus. Herein, as glutathione (GSH) is overexpressed in the tumor microenvironment, a GSH-activatable sonosensitizer prodrug was designed by attaching a quencher to tetraphydroxy porphyrin for tumor therapy. The prodrug exhibited poor fluorescence and low ROS generation capacity under ultrasound irradiation but it can be activated by GSH to simultaneously switch on fluorescence emission and ROS generation in tumor site. Compared with the non-quenched sonosensitizer, the designed prodrug exhibited significantly higher tumor/healthy organ fluorescence ratios, due to the specific fluorescence and ROS activation by overexpressed GSH in the tumor. Finally, the prodrug exhibited efficient tumor growth inhibition under ultrasound irradiation, further demonstrating its promise as a GSH-activated sonosensitizer prodrug for highly effective cancer treatment.
Keywords: Glutathione, sonodynamic therapy, fluorescence image, sonosensitizer, activatable
Graphical Abstract
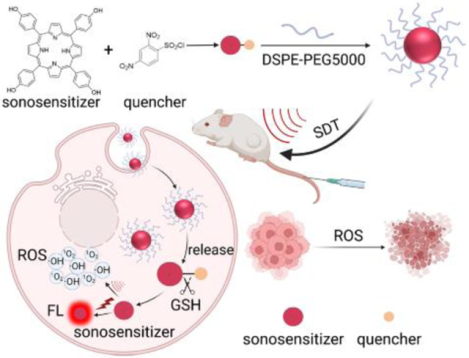
A porphyrin-based sonosensitizer prodrug was synthesized, which can be activated by intracellular GSH to switch on fluorescence emission and reactive oxygen species generation capability simultaneously. Furthermore, the prodrug was used for in vivo fluorescence imaging guided sonodynamic therapy. The prodrug nanoparticles exhibited high tumor/normal tissues fluorescence ratios and efficient tumor growth inhibition effect.
Introduction
To date, various therapies for cancer have been explored, including chemotherapy, radiation therapy, immunotherapy, photothermal therapy, and photodynamic therapy.[1–3] Phototherapy that utilize external light stimuli is especially attractive because of its controllability, resulting in maximum damage to tumor and minimal damage to healthy tissue. However, it has limited penetration depth in biological tissue. On the other hand, sonodynamic therapy (SDT) is an emerging therapy that has an excellent penetration depth of over 10 cm.[4–6] SDT uses ultrasound (US) as an external stimulus to trigger the sonosensitizer applied to tumor, producing cytotoxic reactive oxygen species (ROS).[7–8] The sonosensitizer is nontoxic without US stimuli, making it less side effects to the patient compared with traditional therapies. However, the inevitable distribution of the sonosensitizer to off-tumor surrounding healthy tissue or the spread of US stimulus to the surrounding healthy tissues in vivo will result in non-specific ROS generation and unwanted damage.[9–10] Therefore, a strategy to minimize damage to healthy tissue during SDT is highly desired.
The tumor microenvironment (TME) contains many factors that are significantly different from that of healthy tissue,[11] allowing prodrugs to be designed that are activated at the tumor site only upon stimulation by TME-specific factors, consequently minimizing the damage to healthy tissue.[12–13] Studies have shown the feasibility of developing TME-responsive photosensitizer prodrugs that allow both fluorescence imaging and photodynamic therapy.[14–15] Recently, a study demonstrated the feasibility of constructing an inorganic material-based sonosensitizer that is activated by TME acidity and that exhibited improved specificity of ROS generation in the tumor.[16]
Porphyrins are regarded as a large class of safe photosensitizers and are potentially efficient sonosensitizers.[17–22] Recently, the 5-aminolevulinic acid that can be intracellularly converted into protoporphyrin IX was synthesized into a precursor for tumor SDT.[23] However, a study in five cell lines showed that the conversion rates of ALA to PPIX was far lower than ALA uptake rates, indicating that the ALA precursor delivered to the tumor might be not totally converted in time, thus decreasing the accumulated amount of sonosensitizer in the tumor.[24] Therefore, we hypothesized that a porphyrin-based sonosensitizer can be directly designed as a TME-responsive prodrug for both specific fluorescence imaging and controllable SDT. As glutathione (GSH), which is overproduced in TME, has shown to be an excellent trigger to activate various prodrugs at the tumor site,[25–26] we designed the prodrug by attaching a quencher to tetraphydroxy porphyrin (drug) which greatly restrained both its sonodynamic activity and fluorescence emission, and then, upon accumulation at the tumor site, the prodrug was activated by GSH to switch on fluorescence emission and ROS generation capacities for fluorescence imaging guided SDT under the US stimulus (Figure 1a). The 2,4-dinitrobenzenesulfonyl was used as the quencher group because it can function as an intramolecular electron sink without any spatial interval to the fluorophore, leading to a highly efficient induction of fluorescence quenching through intramolecular electron transfer.[27] The in vitro experiments demonstrated that the fluorescence emission and ROS generation capacities of the prodrug can be simultaneously activated by GSH. Furthermore, DSPE-PEG5000 was utilized to disperse prodrug via constructing nanoparticles (NPs), enabling its use in vivo. Fluorescence imaging studies after drug were intravenously injected into mice showed that the mice that received the prodrug NPs exhibited a much higher tumor-to-background ratio (8.9) than those that received the drug NPs (2.3) and those that received the buthionine sulfoximine (BSO, a GSH generation inhibitor) and prodrug NPs (3.4). The improved tumor/background ratio is beneficial to guide the US stimulus during the SDT. Furthermore, the prodrug exhibited effective tumor growth inhibition under the US irradiation. Thus, this study shows the possibility of developing a sonosensitizer prodrug for accurate cancer theranostics with minimal side effects.
Figure 1.
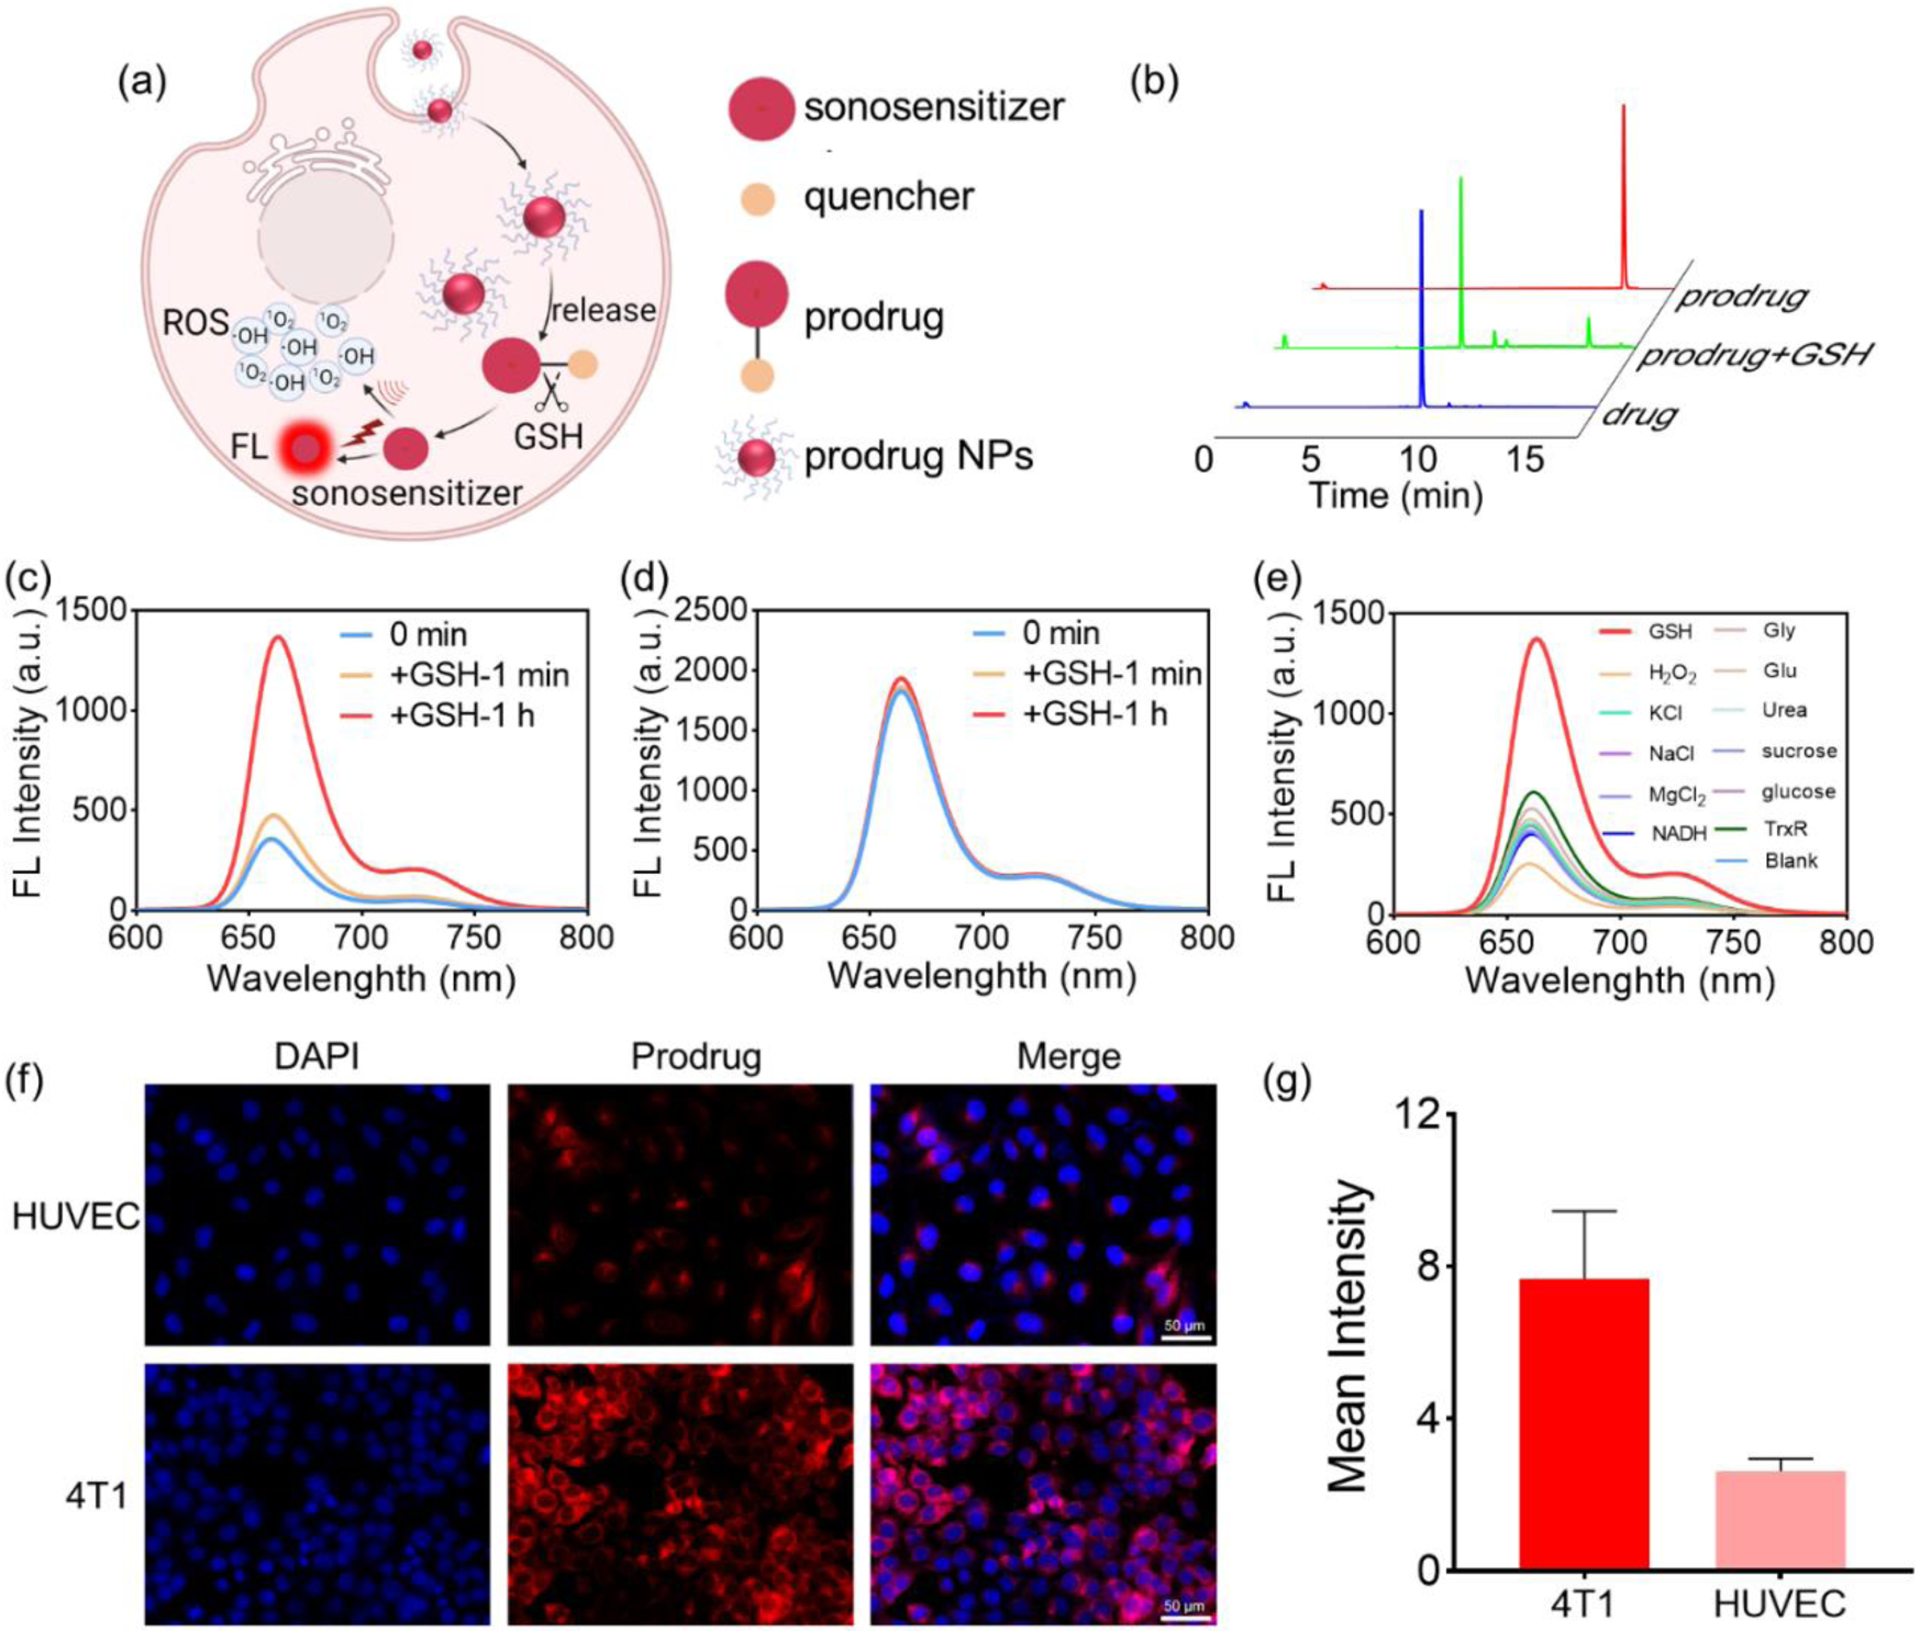
(a) Schematic of GSH activation of prodrug NPs to simultaneously switch on fluorescence emission and ROS generation capacities. (b) HPLC profiles of the prodrug, the drug, and the prodrug + GSH. (c) Fluorescence emission spectra of the prodrug at 1 min and 1 h after incubation with GSH (6 mM), respectively. (d) Fluorescence emission spectra of the drug at 1 min and 1 h after incubation with GSH (6 mM), respectively. (e) Fluorescence emission spectra of the prodrug 1 h after incubation with GSH (6 mM); a series of inorganic salts (KCl (50 mM), NaCl (50 mM), MgCl2 (50 mM)); organic compounds (glucose (10 mM); urea (10 mM); sucrose (10 mM)); amino acids (glycine (10 mM), glutamic acid (10 mM)); reduzate (NADH (1 mM), TrxR (1 μM)); and hydrogen peroxide (H2O2,10 mM), confirming that the prodrug is specifically activated by GSH. (f) Fluorescence image of 4T1 and HUVEC cells after incubation with prodrug (10 μM) for 24 h, suggesting the GSH activation of prodrug in cancer cells. (g) Quantization of fluorescence values in (f).
2. Results and Discussion
2. 1. GSH-specific activation
Porphyrins and their derivatives have shown promise as sonosensitizers.[28–29] Therefore, we synthesized a GSH-responsive porphyrin-based sonosensitizer prodrug by conjugating 2,4-Dinitrobenzenesulfonyl (quencher) and tetrahydroxy porphyrin (sonosensitizer) (Figure S1). After purification by preparative high performance liquid chromatography (HPLC), the prodrug was collected with a yield of over 50% (Figures S2a–b). The prodrug demonstrated absorption peaks (Figure S3) and fluorescence emission peaks similar to those of the drug (porphyrin) at the same concentration (Figure S4a). Under irradiation by a 365 nm UV lamp, the prodrug and drug exhibited significantly different fluorescence emission intensities at the same concentration of 30 μM (Figure S4b). After incubation with GSH for 1 h, the prodrug solution was analyzed using liquid chromatography–mass spectrometry (LC–MS), and a new peak corresponding to the drug appeared while the prodrug peak decreased (Figure 1b). These results demonstrate that the prodrug can be activated by GSH to yield the original drug.
To further explore the activation effect of GSH on the prodrug, changes in fluorescence emission intensity of the prodrug and drug were determined after incubation with GSH. The prodrug was incubated with varying concentrations of GSH (0–10 mM), demonstrating that it can be rapidly and effectively activated when the GSH concentration exceeds 6 mM (Figure S5). The results showed that the fluorescence emission of the prodrug increased by 4 times compared to the original intensity after adding GSH (6 mM as the final concentration) for 1 h (Figure 1c). However, the fluorescence intensity of the drug remained relatively unchanged under the same conditions (Figure 1d). In order to confirm that the prodrug is specifically activated by GSH, the prodrug was incubated with a series of inorganic salts (KCl (50 mM), NaCl (50 mM), MgCl2 (50 mM)); organic compounds (glucose (10 mM); urea (10 mM); sucrose (10 mM)); amino acids (glycine (10 mM), glutamic acid (10 mM)); reduzate (NADH (1 mM), TrxR (1 μM)); and hydrogen peroxide (H2O2, 10 mM). According to fluorescence analysis (Figure 1e, and Figure S6), the fluorescence intensities of the prodrug did not increase after incubation with inorganic salts, organic compounds, amino acids, reduzate and H2O2 for 1 h. In contrast, the fluorescence intensity of the prodrug increased 3 times after incubation with GSH. The results confirmed that the fluorescence emission of the designed prodrug was specifically activated by GSH.
As GSH levels in cancer cells are known to be significantly higher than that in normal tissue, it is expected that fluorescence emission will be higher at the tumor site than in normal tissue, thus increasing the signal ratio between tumor and normal tissue on fluorescence imaging. The increased tumor-to-background ratio can minimize fluorescence interference from healthy tissue and achieve better outcomes for fluorescence imaging-guided US irradiation. To explore the effect of the prodrug in cancer cells and healthy cells, the fluorescence intensity in normal human umbilical vein endothelial cells (HUVEC) and 4T1 breast cancer cells after incubation with the prodrug were evaluated. As shown in Figure 1f, after incubation with the prodrug, the signal for red fluorescence was weak in normal HUVEC but much stronger in 4T1 cancer cells. The quantified fluorescence intensity of prodrug in 4T1 cancer cells was significantly higher than that in normal HUVEC (4T1/HUVEC = 2.953) (Figure 1g). Furthermore, the flow cytometry results also showed that the fluorescence intensity of prodrug in 4T1 breast cancer cells was higher than that in HUVEC (Figures S7a–b). In addition, human prostate cancer cells, 22rv1, were also used to verify prodrug activation in tumor cells. As shown in Figures S8 and S9a–b, the fluorescence intensity in 22rv1 cell was significantly stronger than that in normal HUVEC, suggesting that intracellular GSH concentration was enough to activate the prodrug in cancer cells, but not enough in normal cells.
2.2. ROS generation and intracellular sonodynamic effect
To explore the potential of using drug and prodrug for SDT, the probe, 1,3-Diphenylisobenzofuran (DPBF), 3,3’,5,5’-tetramethylbenzidine、4,4’-bi-2,6-xylidine (TMB) and nitrotetrazolium blue chloride (NBT) were used to detected the capability of drug to produce ROS (1O2,·OH and O2·−). The absorption value of DPBF at 410 nm of different samples was measured at several timepoints after US irradiation to detect the 1O2. The absorption value in sample of DPBF and prodrug did not decrease without US irradiation (Figure S10), as well as the DPBF samples under US irradiation (Figure 2a). The absorption value of DPBF decreased significantly across the timepoints for the drug sample, indicating that the drug is an efficient sonosensitizer for generating 1O2 under US irradiation (Figure 2a and Figure S11a). On the contrary, the absorption of the prodrug sample did not decrease much compared with that of the control sample (Figure S11b), indicating that ROS generation capacity was effectively quenched even under ultrasound irradiation. Additionally, when TMB served as the ·OH probe, there was no change in the absorption spectrum of the TMB solution after US irradiation (Figures S12a–b). As the US time increased, the green color in the mixture solution of drug +TMB deepened, and the absorption value at 370 nm and 654 nm were enhanced (Figures S13a–b), indicating the production of ·OH. In contrast, only a slight green change was observed in the prodrug + TMB mixture solution, accompanied by a slight increase in absorption values at 370 nm and 654 nm with increasing US time (Figures S14a–b). After ultrasonic irradiation for 10 minutes, the drug produced a sufficient amount of ·OH, while the prodrug produced only a small amount due to the inhibited ROS generation capability (Figure S15). When NBT was used as a probe to detect O2·−, there were no changes in color or absorption peak at 595 nm (methyl hydrazone) in either the drug + NBT mixture solution (Figures S16a–b) or the prodrug + NBT mixture solution (Figures S17a–b) after US irradiation, which was the same as the NBT solution (Figures S18a–b), indicating no O2·− production. These results indicate that the drug can be used as a sonosensitizer to produce ROS (1O2 and ·OH), and the ROS production capability of the prodrug was inhibited to avoid the unwanted injury to healthy tissue, where the GSH level is relatively low.
Figure 2.
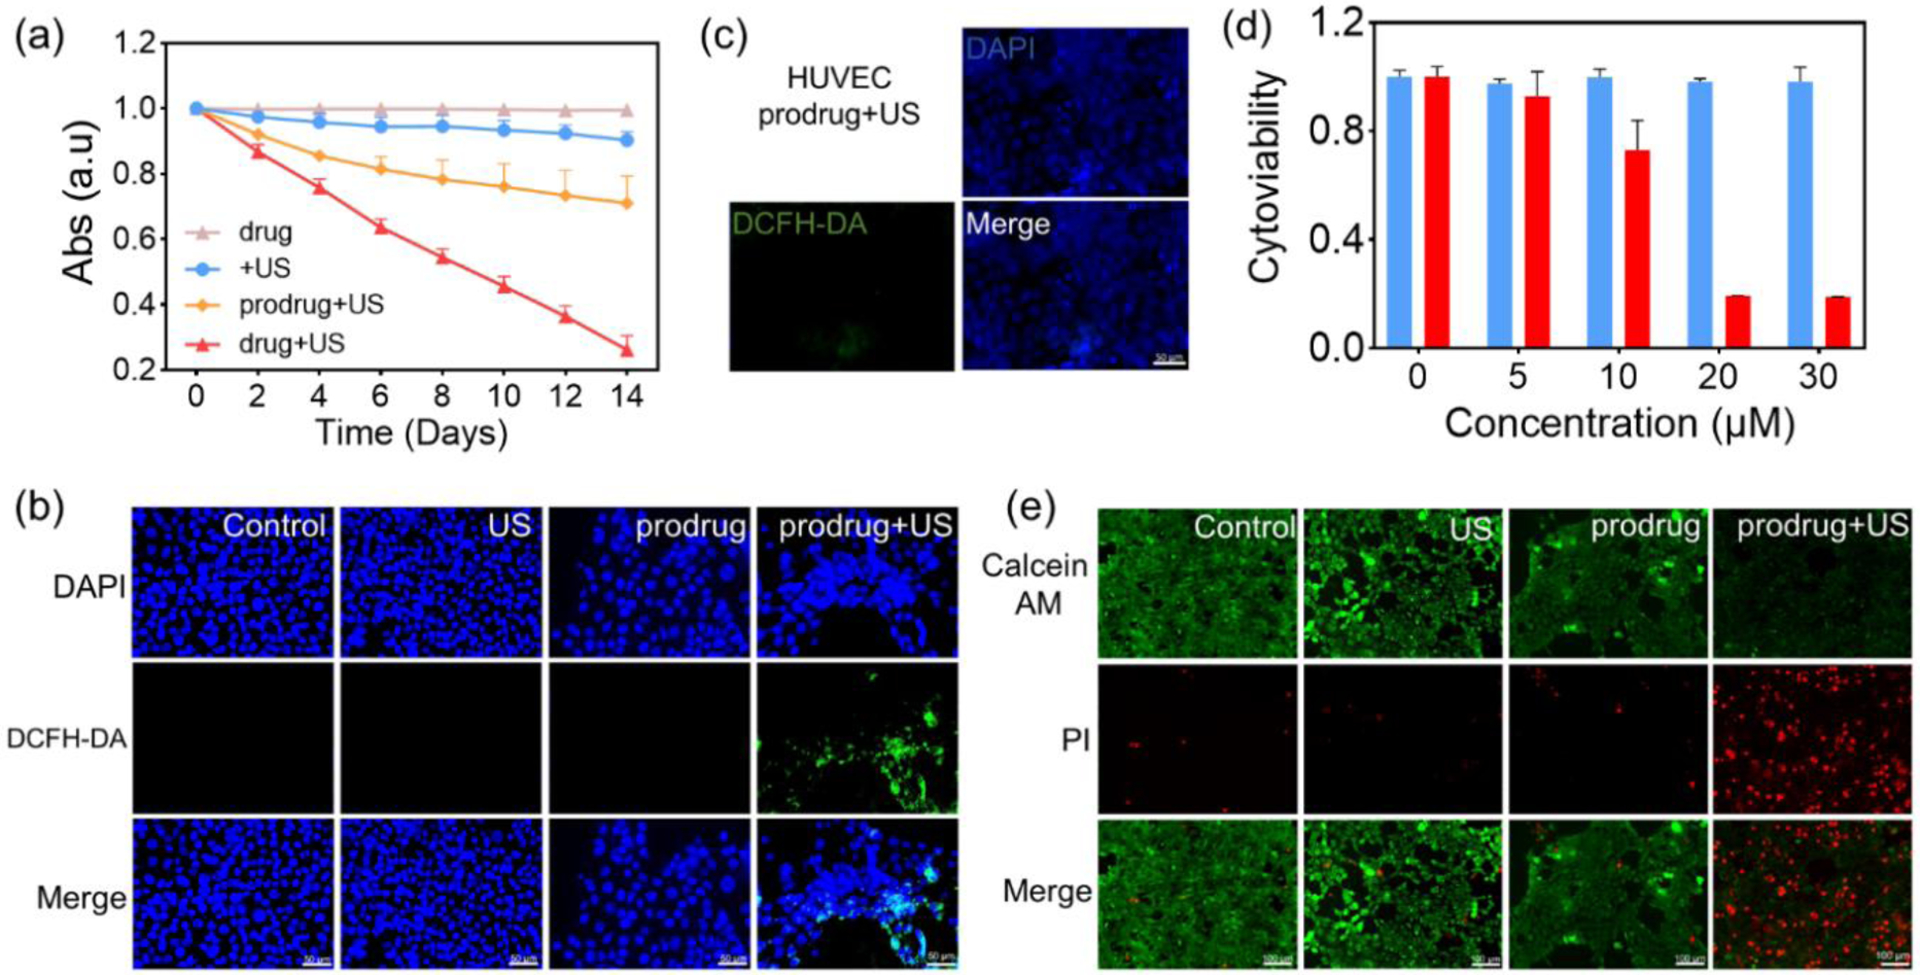
(a) Absorption value of DBPF in different DMSO solutions (DMSO only, DMSO + prodrug, DMSO + drug) across several timepoints (days), with and without ultrasound irradiation (1.7 W/cm2, 30 KHZ, 50% Cycle duty). Each data was repeated for 3 times. (b) Detection of ROS generation (indicated by a strong green fluorescence signal) using a DCFH-DA probe (10 μM) in 4T1 breast cancer cells after incubation with prodrug and treatment with US irradiation. (c) ROS generation was not particularly detected using a DCFH-DA probe (10 μM) in normal HUVEC after incubation with prodrug and treatment with US irradiation. (d) Viability of 4T1 breast cancer cells after treatment with the GSH preincubation prodrug at different concentrations without (blue) and with (red) US irradiation for 5 min (0.85 W/cm2, 50% cycle duty, 30 KHZ). (e) Fluorescence imaging of live-dead cells stained by PI/AM after different treatments (no treatment, US irradiation only, prodrug only, prodrug + US irradiation).
Intracellular ROS generation by the prodrug was detected using a DCFH-DA probe. The prodrug was incubated with 4T1 cancer cells and normal HUVEC, respectively, and underwent ultrasound irradiation. Upon endocytosis by the cells, DCFH-DA was deacetylated by intracellular esterase to produce the non-fluorescent compound DCFH, which can be further oxidized by ROS and convert to fluorescent 2’,7’-dichlorofluorescein (DCF). As shown in Figure 2b and Figure S19, no fluorescence was observed in either 4T1 cancer cells or normal HUVEC after treatment with ultrasound irradiation alone or the prodrug alone. However, after treatment with the prodrug and US irradiation, a strong green fluorescence was observed in 4T1 cancer cells but seldom in normal HUVEC (Figures 2c and S19). These results suggest that intracellular GSH in the 4T1 cancer cells activated the ROS generation capacity of the prodrug.
Cytoviability was measured using a CCK-8 assay to evaluate the in vitro SDT effect of the prodrug. The prodrug exhibited negligible cytotoxicity 48 h after incubation with 4T1 cells even at a concentration of up to 50 μM, indicating good biocompatibility (Figure S20). The addition of extra GSH did not induce any observable cytotoxicity as well (Figure 2d). However, the cytoviability of 4T1 cancer cells deceased to 69% when the cells were treated with prodrug (30 μM) and underwent US irradiation (5 min), indicating the efficient activation of the prodrug by intracellular GSH under US irradiation (Figure S21). The cytoviability of 4T1 tumor cells deceased to 20% when the cells were treated with the prodrug, US irradiation, and extra GSH, further confirming the key role of GSH for efficient intracellular prodrug activation (Figure 2d). In comparison to 4T1 cells, the cytoviability of normal HUVEC remained at ~ 100% after prodrug incubation and ultrasound irradiation (Figure S22). Further, a live/dead cell staining kit was used to detect cell apoptosis, with green fluorescence in live cells and red fluorescence in dead cells. As shown in Figure 2e, a strong green fluorescence signal and almost no red fluorescence signal was observed in control, US-only, and prodrug-only groups, whereas an obvious red fluorescence signal was observed in the prodrug + US group. Furthermore, flow cytometry analysis showed that over 90% of cells underwent apoptosis after treatment with the prodrug, additional GSH, and US irradiation (Figure S23). Altogether, these results confirmed that sonosensitizer prodrug can be activated by GSH to switch on the SDT effect.
2.3. Characterization of prodrug nanoparticles
The designed prodrug was water-insoluble, making it unsuitable for bioapplications. Therefore, 1,2-distearoyl-sn-glycero-3-phosphoethanolamine-N-(polyethylene glycol)-5000 (DSPE-PEG5000) was used to disperse the sonosensitizer prodrug and drug molecule in water, respectively. Membrane hydration was used to load the prodrug and drug molecules into DSPE-PEG5000 NPs to form prodrug NPs and drug NPs, respectively (Figure 3a). DSPE-PEG2000 is an amphiphilic polymer that can self-assemble in water to form nanomicelles with hydrophobic segments facing inward and hydrophilic segments facing outward. During self-assembly, hydrophobic prodrug and drug molecules interact with the hydrophobic segments of DSPE-PEG2000, allowing them to be stably bound to the hydrophobic core of the DSPE-PEG2000 nanomicelle, thus enabling drug loading. The size of the resulted NPs is helpful to enhance accumulation at the tumor site by enhanced permeation and retention (EPR) effect.
Figure 3.
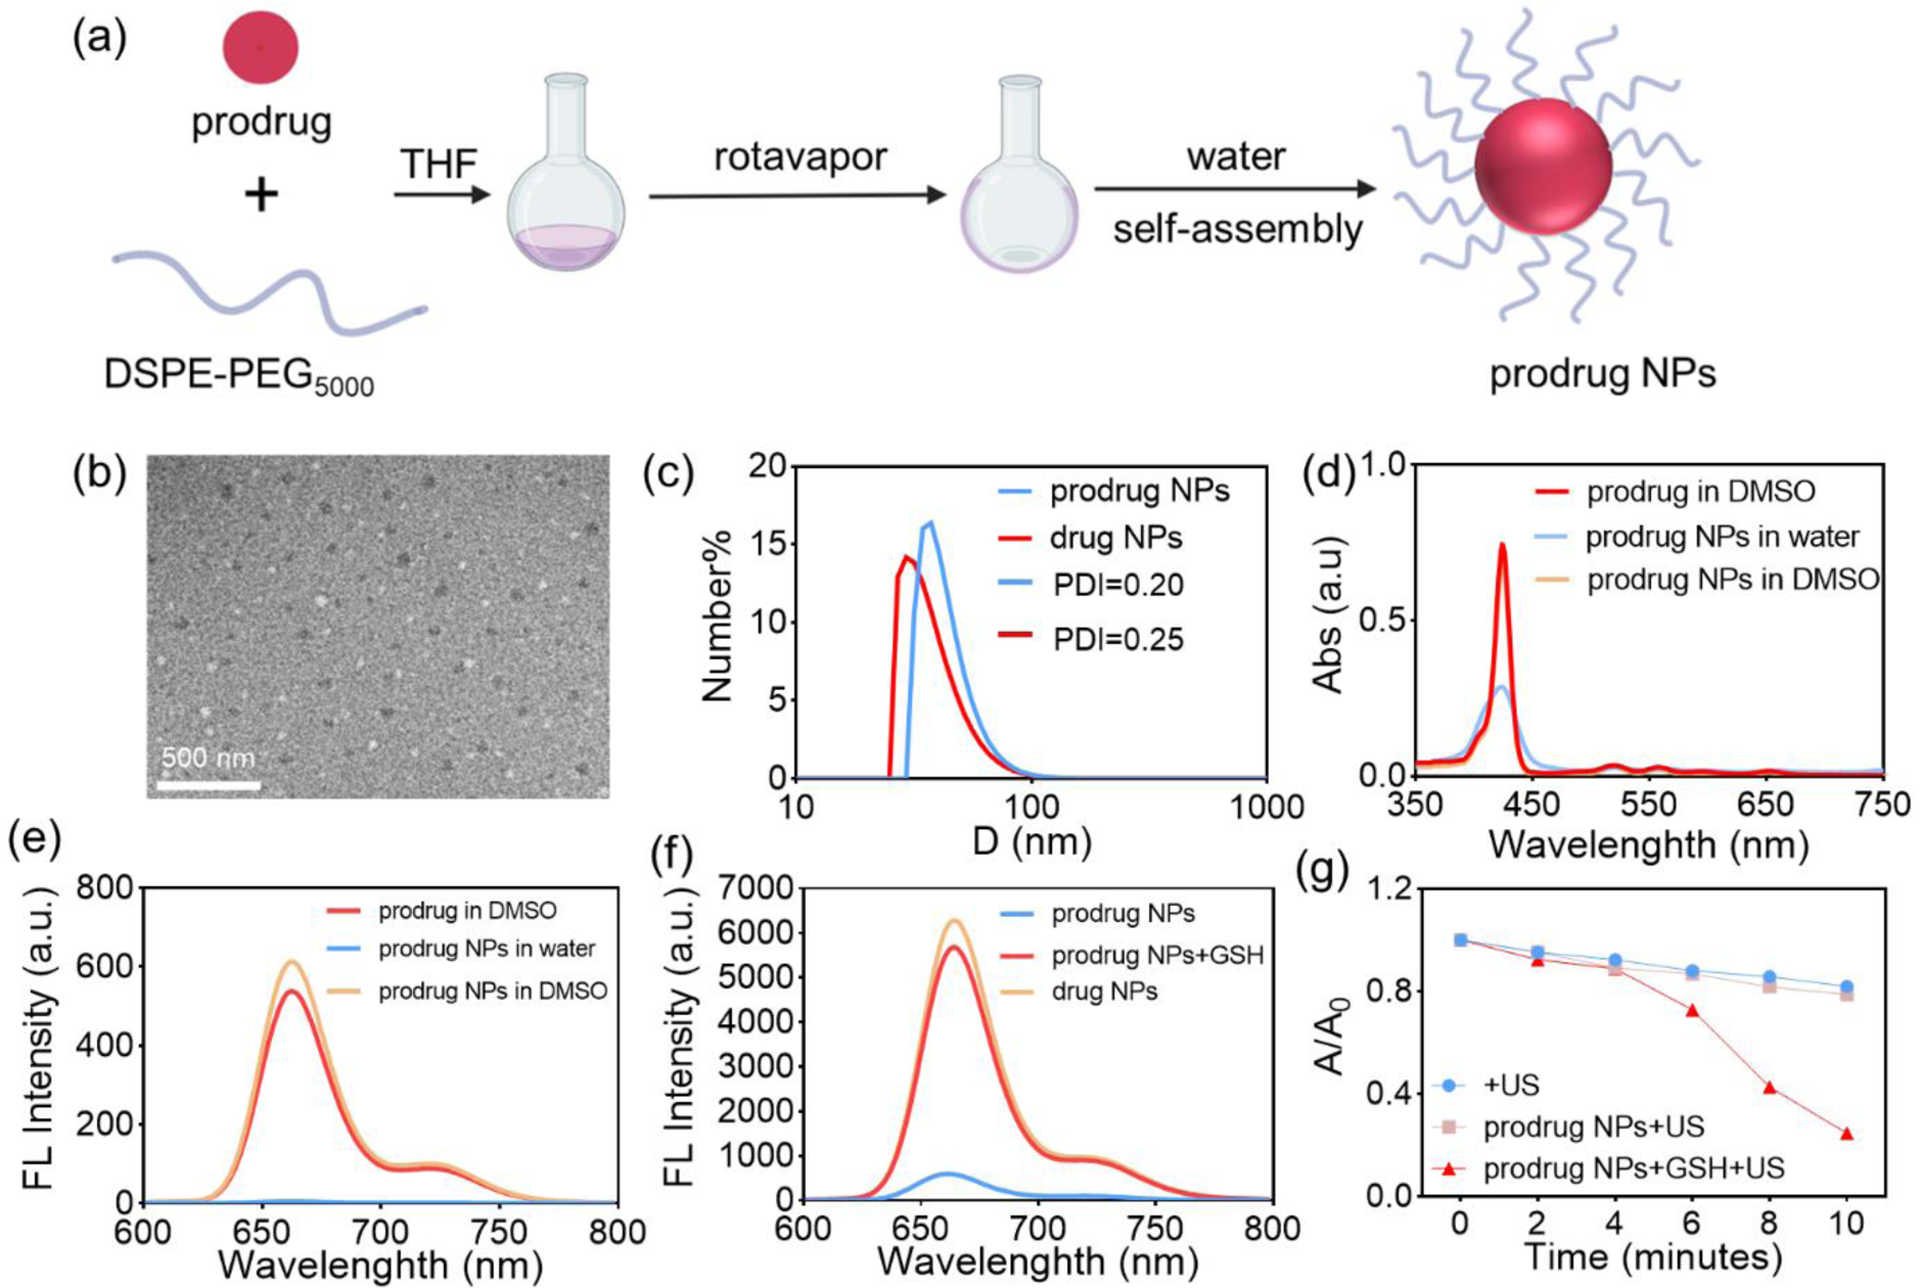
(a) Schematic of prodrug NPs preparation. (b) TEM characterization of prodrug NPs. (c) Size and PDI of prodrug NPs and drug NPs in water, as measured by DLS. (d) Absorption spectra of the prodrug in DMSO, prodrug NPs in water, and prodrug NPs in DMSO (3 μM). (e) Fluorescence emission spectra of the prodrug in DMSO, prodrug NPs in water, and prodrug NPs in DMSO (3 μM). (f) Fluorescence emission spectra of prodrug NPs after 1 h incubation with GSH. (g) Absorption value of DPBF (410 nm) after US irradiation in mixture solutions (DMSO/H2O = 7/3).
The morphology of the prodrug NPs was characterized with transmission electron microscopy (TEM), showing that they were spherical with a size < 50 nm (Figure 3b). According to the dynamic light scattering (DLS) characterization, the prodrug NPs possess a particle size of ~ 40 nm (Figure 3c) and a polydispersity index (PDI) of 0.2 with an observable Tyndall effect (Figure S24), consistent with TEM results. The particle size of prodrug NPs remained consistent in water, PBS, DMEM and RPMI 1640 complete medium (Figure S25). More importantly, both the particle size and PDI of the prodrug NPs remained stable during five days’ storage (Figure S26). The absorption and fluorescence emission of prodrug NPs (Figures 3d–e) and drug NPs (Figures S27, S28) were decreased in water due to molecule aggregation-induced broadening and quenching. After dissociation in DMSO, the drug and prodrug in the NPs can recover their absorption spectra and fluorescence emission abilities to that of the original molecules at the same concentration (3 μM). The results demonstrated that the formation of NPs did not change their properties irreversibly. Furthermore, the prodrug NPs were investigated after incubation with GSH, showing that the fluorescence emission intensity of prodrug NPs was enhanced significantly (Figure 3f) and ROS generation capacity was also recovered (Figure 3g) in the presence of GSH. These results demonstrated that the loading of the prodrug in NPs kept its GSH-activatable fluorescence emission and ROS generation properties very well.
Furthermore, the stability of prodrug NPs in Fetal bovine serum (FBS) was explored. The prodrug NPs was incubated with a 10% FBS and 90% FBS solution for 24 hours, respectively, and then detected using LC-MS. The results showed that the prodrug NPs remained stability in the FBS solutions without any new peak (drug) appearing (Figures S29a–b, S30a–b). Additionally, FITC-labeled DSPE-PEG5000 was loaded with the prodrug and incubated with tumor cells for different periods. Fluorescence imaging showed that after 4 hours of incubation, the fluorescence of FITC-DSPE-PEG5000 was slightly inconsistent with that of the prodrug. However, after 12 hours of incubation, the fluorescence of FITC-DSPE-PEG5000 was distributed in a dotted pattern that was completely inconsistent with that of the prodrug, which was uniformly distributed in the cytoplasm (Figures S31). These results indicate that the prodrug NPs dissociated after internalization by cells. Furthermore, the prodrug NPs were incubated with the tumor cell lysate contents for 24 hours, and LC-MS analysis results showed that a peak inconsistent with the prodrug appeared, which was identified as the drug. This finding indicates that the prodrug was converted to drug under the stimulus of the cell contents (Figures S32a–b).
2.4. Intracellular effects of prodrug NPs
4T1 cancer cells were incubated with the prodrug NPs and evaluated using a standard CCK-8 essay. The cells showed a ~100% cytoviability even at a concentration up to 100 μM (Figure 4a), demonstrating the prodrug NPs to be non-cytotoxic without US irradiation. 4T1 cancer cells treated with prodrug NPs showed strong fluorescence under a fluorescence microscope, but weaker fluorescence was exhibited if the cells were pre-incubated with BSO (L-buthionine-sulfoximine, the γ-glutamylcysteine synthetase inhibitor) (Figure 4b, Figure S33). The results demonstrated that the strong fluorescence was due to the intracellular activation of the prodrug NPs by GSH. Additionally, 4T1 cancer cells that were treated with prodrug NPs, DCFH-DA, and ultrasound irradiation exhibited green fluorescence, indicating efficient ROS generation by the prodrug NPs for potential SDT. In the control group, little green fluorescence was observed in which GSH was downregulated by added the BSO, demonstrating the necessity of GSH to activate the prodrug NPs (Figure 4c). The fluorescence intensity quantification also verified that BSO can inhibit the activation of the prodrug NPs, consequently inhibiting ROS production (Figure 4d). After US irradiation, the cytoviability decreased to less than 50% at a concentration of 25 μM prodrug NPs (Figure 4e), suggesting that the activated prodrug NPs has a good SDT effect.
Figure 4.
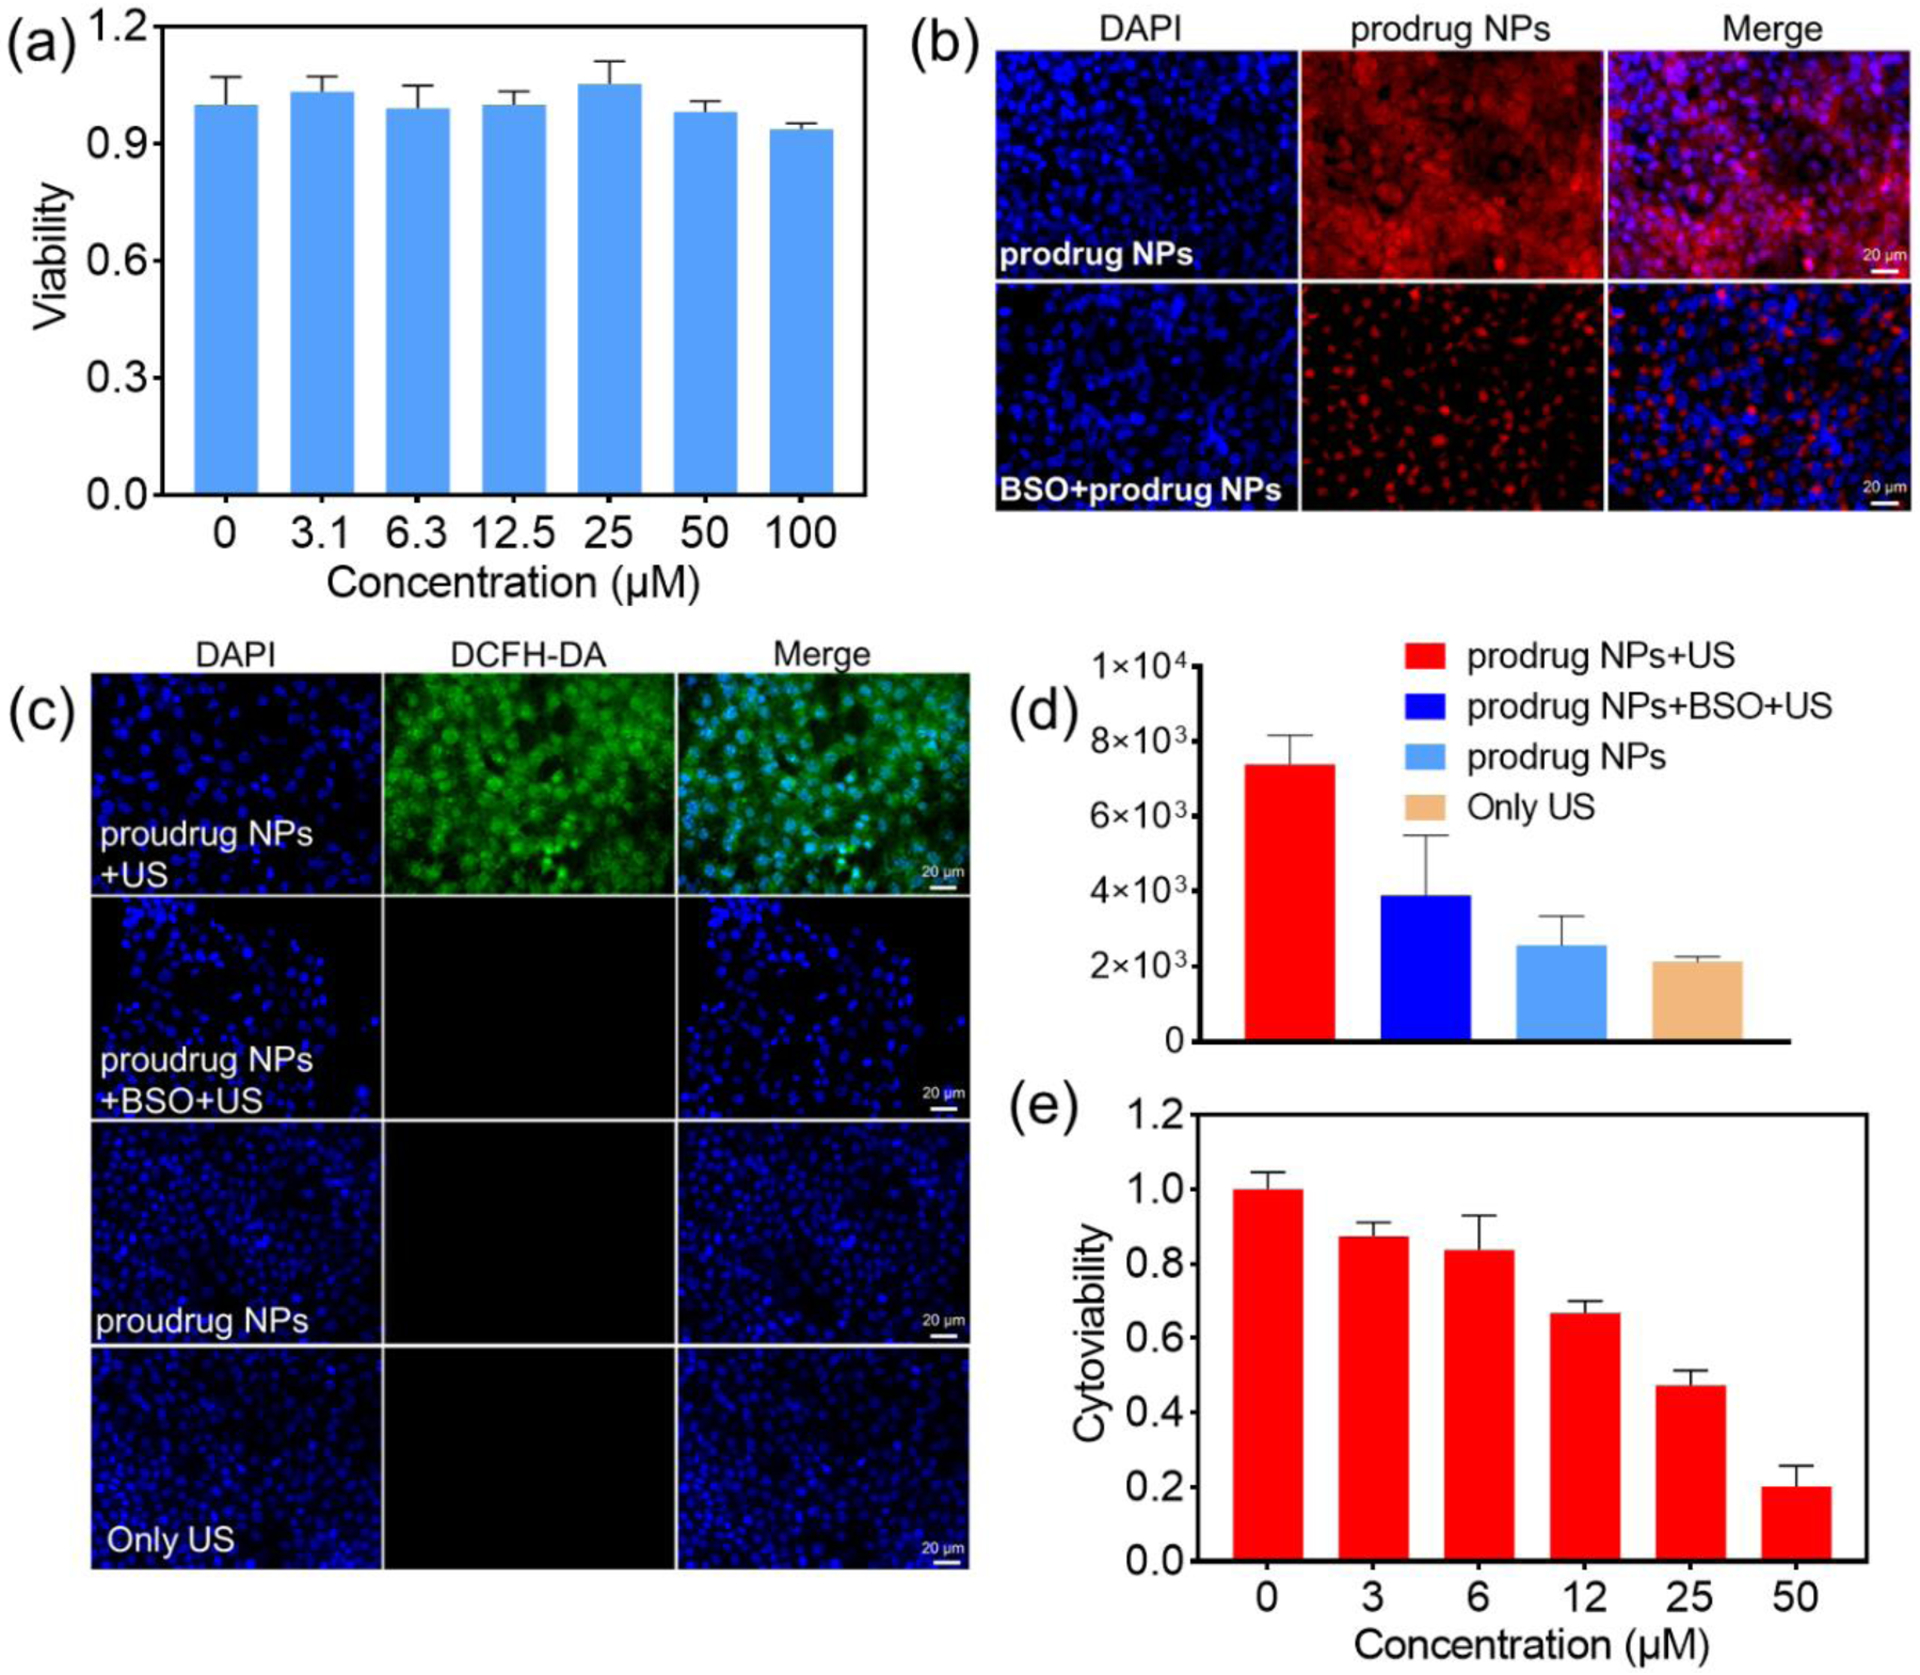
(a) Cytoviability of 4T1 breast cancer cells after incubation with different concentrations of prodrug NPs for 24 hours. (b) Fluorescence image of 4T1 cancer cells, after incubation with prodrug NPs only, and with prodrug NPs + BSO. (c) Fluorescence image demonstrating ROS generation in 4T1 cancer cells after different treatments (prodrug incubation and US irradiation, BSO and prodrug incubation and US irradiation, prodrug incubation only, US irradiation only). (d) Quantification of ROS fluorescence intensity in (c). (e) Cytoviability of 4T1 cancer cells after incubation with different concentrations of prodrug NPs and treatment with US irradiation (0.85 W/cm2, 50% cycle duty, 30 KHZ).
2.5. Fluorescence imaging
Drug release of the prodrug NPs in vivo and their activation in the tumor microenvironment were investigated using non-invasive fluorescence imaging in tumor-bearing mice. The 4T1 tumor-bearing BAL B/C mice were randomly divided into three groups receiving BSO + prodrug NPs, prodrug NPs, and drug NPs by intravenous tail vein injection, respectively. Fluorescence imaging was performed at 2 h, 8 h, and 24 h after the injection. As shown in Figures 5a and 5b, the prodrug NPs started to accumulate at the tumor site and exhibited a little fluorescence at the tumor at 2 h post injection. Fluorescence intensity at the tumor site was enhanced over 24 h, with the tumor edge being easily recognized because of the significant contrast between the tumor signal and surrounding tissue signal. This was ascribed to the gradual accumulation and continuous activation of the prodrug NPs at the tumor site over time. In comparison, the drug NPs started to accumulate at the tumor site and exhibited strong fluorescence at the tumor even at 2 h post injection. The fluorescence intensity at the tumor site was enhanced over 24 h but the contrast between the tumor signal and surrounding tissue signal was not obvious enough to accurately distinguish the tumor from the surrounding healthy tissue. This was ascribed to the strong “always-on” signal from the released drug (Figure S34), which had inevitably distributed to surrounding non-tumor sites. For the group injected with BSO and prodrug NPs, fluorescence intensity was significantly weaker than that in the other groups at each time point, demonstrating the necessity of GSH to activate the prodrug in the tumor microenvironment.
Figure 5.
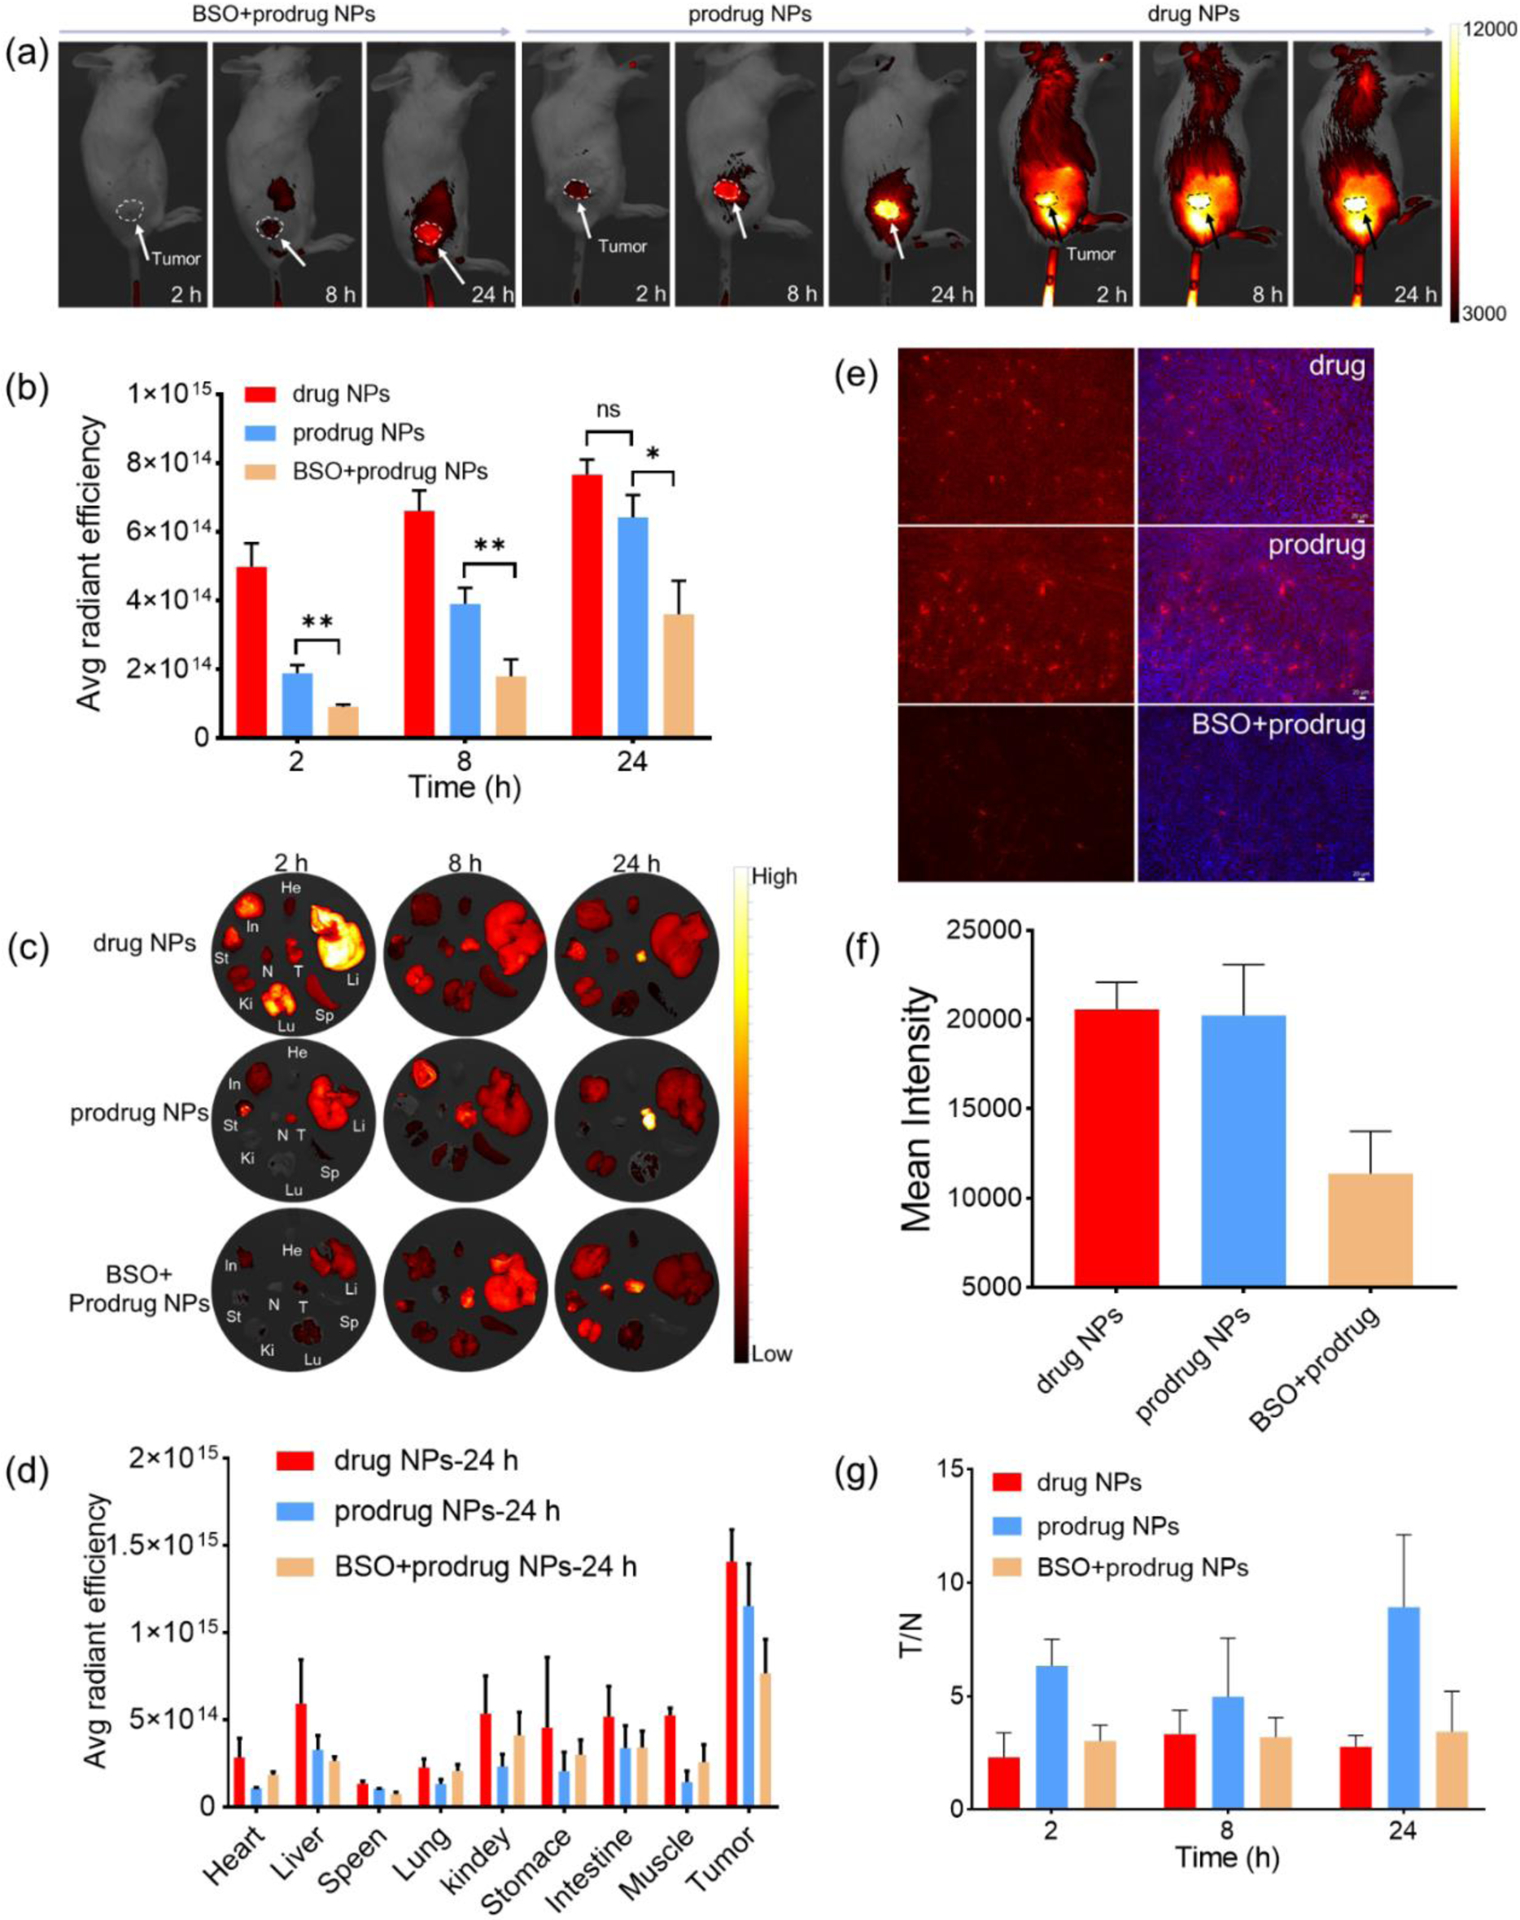
(a) Fluorescence imaging of tumor-bearing mice after tail vein injection of BSO + prodrug NPs, prodrug NPs, and drug NPs (5 mg/kg, 200 μL). (b) In vivo tumor quantification of fluorescence signal. (c) Biodistribution of drug NPs, prodrug NPs, and BSO + prodrug NPs at different time points. (d) Quantified biodistribution fluorescence signal 24 hours after injection with drug NPs, prodrug NPs, and BSO + prodrug NPs. (e) Fluorescence imaging of tumor sections at 24 h after tail vein injection. (f) Quantified fluorescence signal of tumor sections in (e). (g) Ratios of fluorescence values of tumor-to-normal muscle (T/N) at different time points in drug NPs, prodrug NPs, and BSO + prodrug NPs group.
After non-invasive fluorescence imaging, the mice were sacrificed to collect the major organs, tumor, and the muscles adjacent to the tumor for ex vivo imaging (Figure 5c). Biodistribution analysis showed that the fluorescence signal was much higher in the tumor than in major organs and muscles in the mice that received prodrug NPs at all time points (Figures 5d, S35) and S36). In comparison, the mice that administrated with drug NPs had strong fluorescence signals not only at the tumor but also at major organs and muscles. In addition, the mice administrated with both BSO and prodrug NPs showed much weaker tumor fluorescence signal in the tumor and the similar strong fluorescence signal in the organs compared to the mice administrated with prodrug NPs only. The tumor sections collected at 24 h post injection of the mice administrated with prodrug NPs or drug NPs exhibited much higher fluorescence intensity than that of the mice administrated with BSO + prodrug NPs (Figures 5e and 5f). These results suggest that the enhanced tumor fluorescence signal in prodrug NPs group was largely due to intratumoral GSH activation and the EPR effect. It can also be seen that the prodrug was mainly distributed to the tumor, liver, stomach, and small intestine after intravenous injection, but notably, the fluorescence intensities in the liver, stomach, and small intestine became weaker and weaker across 24 h post injection, suggesting gradual clearance of the prodrug in vivo. The fluorescence ratio (T/N) at 24 h in the group of prodrug NPs (T/N = 8.9) was much higher than that in the groups of drug NPs (T/N = 2.9) and BSO + prodrug NPs (T/N = 3.4), achieving a much higher signal/background ratio for accurate US irradiation for SDT (Figure 5g). Considering the correlation between the ROS generation capacity and fluorescence intensity of the prodrug, its ROS generation capacity can be activated at the tumor for cancer therapy while minimizing the damage to the healthy tissues where the prodrug remains inactive in addition to the fluorescence emission capacity.
2.6. SDT in vivo
In vivo SDT experiments were performed as shown in Figure 6a. When the tumor volume of BAL B/C tumor-bearing mice reached ~ 100 mm3, the mice were randomly divided into four groups (n = 5 in each group): control; prodrug NPs; US; prodrug NPs + US. For the mice receiving prodrug NPs and US, prodrug NPs (5 mg/mL) were intravenously injected on days 0 and 2, and US irradiation was performed for 10 min (0.85 W/cm2, 50% cycle duty, 30 KHZ) on days 1 and 3 (i.e., 24 h after each injection). After 14 days, tumor volume increased significantly in control, prodrug NPs, and US groups, while tumor volume growth was significantly inhibited in the prodrug NPs +US group (Figures 6b–d). Compared with other groups, the tumor weight in the prodrug NPs +US group was much lower (Figure 6e). Within 14 days, there was no significant change in the body weight of the mice in the four groups, suggesting that prodrug NPs would not cause serious side effects to the mice (Figure 6f). Hematoxylin and eosin (H&E) staining of the tumor slice showed that the tumor cells in the prodrug NPs + US group have deformed and shrunk, while the tumor cells in the other groups were normal, indicating the tumor cells underwent apoptosis in the prodrug NPs +US group (Figure S37). In addition, tunnel apoptosis staining exhibited a large amount of green fluorescence in the prodrug NPs +US group, indicating efficient apoptosis of tumor cells (Figure 6g). H&E staining of tissue sections showed no lesions or inflammation in the heart, liver, spleen, lung, and kidney (Figure 6h). Furthermore, blood panel assays showing all the index of red blood cells (RBC), white blood cells (WBC), platelets, and hemoglobin were in the normal levels at 1,7, 14 days after intravenous injection of prodrug NPs (Figure S38), demonstrating the in vivo biosafety of the prodrug NPs.
Figure 6.
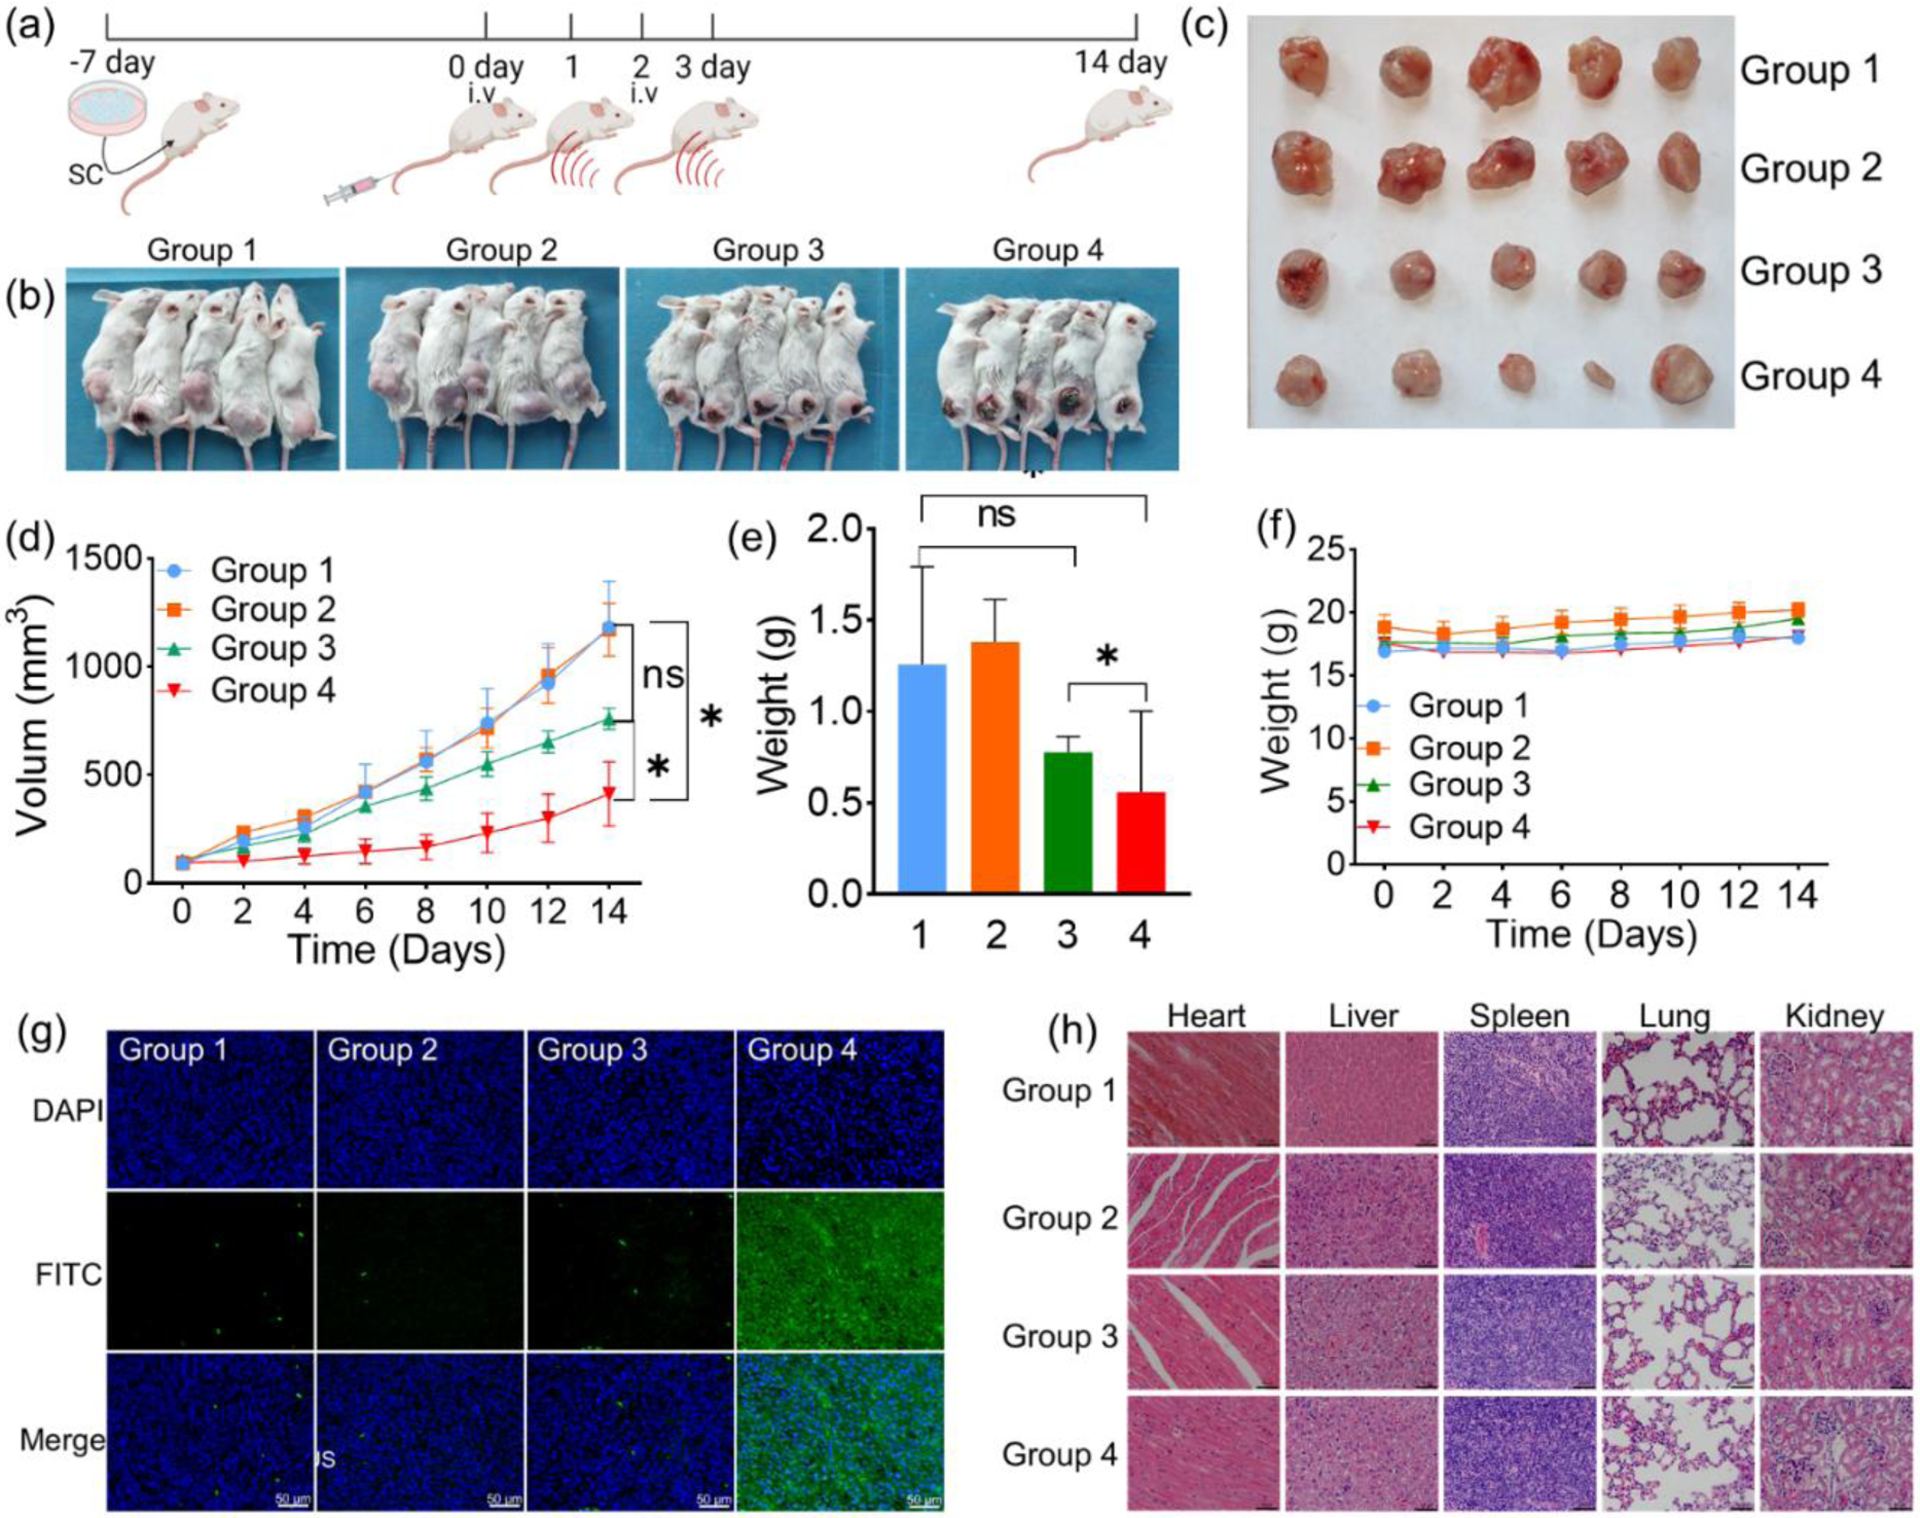
(a) The scheme of SDT in vivo. (b) Photographs of tumor-bearing mice 14 days after treatment. Groups 1, 2, 3, and 4 refer to control, prodrug NPs, US and prodrug NPs + US, respectively. (c) Collected tumors of the different groups. (d) Tumor growth curves of the different groups after treatment. Statistical significance was calculated by two-way ANOVA with GraphPad (p < 0.01). (e) Tumor weight of the different groups. Statistical significance was calculated by two-way ANOVA with GraphPad (p < 0.01). (f) Body weight changes in the different groups after treatment. (g) Immunofluorescence TUNEL staining and DAPI staining of tumor sections. The nucleus was imaged at DAPI channel and FITC-dUTP was imaged at GFP channel. Groups 1, 2, 3 and 4 refer to control, prodrug NPs, US and prodrug NPs + US group, respectively. (h) H&E staining of the heart, liver, spleen, lung, and kidney. Groups 1, 2, 3, and 4 refer to control, prodrug NPs, US and prodrug NPs +US, respectively. Scale bar = 50 μm.
3. Conclusions
In summary, we designed a GSH-activated sonosensitizer prodrug that can be selectively activated at tumor site for switch-on fluorescence imaging-guided SDT. The ROS-generation capacity of the prodrug is quenched in normal tissue where intracellular GSH levels are low, avoiding unwanted side effects to healthy tissue during US treatment. After being activated by GSH in vitro and in vivo TME, the prodrug recovered its fluorescence emission ability and SDT effect. According to fluorescence imaging, the mice injected with prodrug exhibited increasingly enhanced fluorescence at the tumor site but the surrounding background signal maintained at low level, resulting in a signal-noise ratio (T/N) as high as 8.9 compared with 2.9 in mice of drug NPs group and 3.4 in mice of BSO + prodrug NPs group. The significantly higher T/N ratio benefits the tumor edge recognition for accurate guide of US irradiation during SDT. For in vivo therapy, the prodrug showed effective inhibition on tumor growth without observable side effects on normal organs. Therefore, this work provides a promising sonosensitizer prodrug strategy for efficient imaging guided SDT with minimized side effect, which can be further explored in clinical applications.
4. Experimental Section
Synthesis of prodrug
Equivalent 5,10,15, 20-tetrakis (4-hydroxyphenyl)-21H, 23H-porphine (THPP) (22.2 mg, 0.032 mmol) and 2, 4-dinitrobenzenesulfonyl chloride (DNBS) (6.4mg, 0.026 mmol) were dissolved in Tetrahydrofuran (THF) (5 mL), respectively. Under the magnetic stirring, triethylamine (TEA) (32.4 μL) was added to the THPP solution, then DNBS solution was slowly added to the THPP solution. The mixed solution was stirred at room temperature for 4 h, dried by rotary evaporation, redissolved in DMF, and purified by preparative chromatography (EClassical 3100, China) equipped with a C18 reversed-phase LC column (Luna 10 μm C18, 100 Å, LC column 250 × 21.2 mm), water/ACN: 90/10 to 5/95, linear gradient, 20 min, with a flow rate of 15 mL/min, ultrapure water and ACN (HPLC class) to collect different fractions. Prodrug was lyophilized and characterized by HPLC and high-resolution mass spectrometry. Yields: 23.2 mg (80%). HRMS (ESI): calcd for [M] [C50H32N6O10S], 908.1901; [M+H]+ [C50H33N6O10S]+, 909.1979; found [M+H]+, 909.1995.
GSH-specific activation of prodrug
The prodrug solution (2 μM) was incubated with varying concentrations of GSH (0, 0.002, 0.005, 0.01, 0.25, 0.5, 1, 2, 4, 6, 8, 10 mM) in mixed solution (DMSO/H2O = 7/3) at 37 °C. Then, fluorescence intensities of prodrug at different time points were measured using a fluorescence microplate (Super Max 3100, Shanghai Flash Spectrum Technology Co, China)
The prodrug and THPP (2 μM), respectively, were incubated with GSH (6 mM) in solution (DMSO/H2O = 7/3) at 37 °C. Then, changes in their fluorescence intensities were measured by fluorescence spectrometer after 1 min and 1 h incubation, respectively.
To exclude interference from other factors on the specific activation of GSH, inorganic salts (KCl (50 mM), NaCl (50 mM), MgCl2 (50 mM)), organic compounds (glucose (10 mM), urea (10 mM), sucrose (10 mM)); amino acids (Gly (10 mM), Glu (10 mM)); reduzates (NADH (1mM), TrxR (1μM)); and oxides (H2O2 (10 mM)) were added and incubated with the prodrug solution (2 μM) for 1 h at 37 °C. Their fluorescence intensities were measured three times to confirm the GSH-specific activation of prodrug.
Intracellular GSH activated prodrug
The prodrug (10 μM) was added to 4T1 breast cancer cells and HUVEC cells, respectively. After incubation for 24 h, the cells were stained with DAPI and imaged with a microscope (ZEISS AXIO Scope.A1). All parameters were kept consistent during imaging and data processing.
BSO is an inhibitor of γ-glutamylcysteine synthetase and therefore reduces GSH concentration in tumor cells. 4T1 cancer cells were pre-incubated with BSO for 8 h before the prodrug NPs (10 μM) were added. Then, the cells were cultured for another 24 h and stained with DAPI before being imaged with the microscope (ZEISS AXIO Scope.A1).
Fluorescence imaging in vivo
4T1 tumor-bearing mice were randomly divided into three groups: drug NPs, prodrug NPs, and BSO + prodrug NPs (n = 9). For drug NPs, the mice were administrated a dosage of 5 mg/kg (calculation by THPP in the THPP NPs). For the BSO + prodrug NPs group, the mice were intravenously injected with BSO (20 μL, 50 mM). After 6 h, the mice of drug NPs, prodrug NPs, and BSO + prodrug NPs were intravenously injected with prodrug NPs at the same dosage to that of THPP NPs. At 2 h, 8 h and 24 h after intravenously injection, imaging was performed with a small animal fluorescence imaging system (VISQUE InVivo Elite, HighRed excitation, Cy5.5 emission channel). Three mice were sacrificed at each timepoint to collect the tumor, adjacent normal muscles, and major organs (heart, liver, spleen, lung, kidney, stomach and intestine) for imaging and biodistribution analysis. Their fluorescence values were drawn by pen function of ROI, and the signal ratios of the tumor-to-muscle/organs were calculated.
SDT in vivo
The tumor-bearing mice were randomly divided into four groups (n = 5 in each group): control; prodrug NPs; US; and prodrug NPs + US. The groups of both prodrug NPs and prodrug NPs + US were administrated prodrug NPs (200 μL) at a concentration of 0.67 mg/mL (counted by prodrug). The control group and US group were intravenously injected with 1× PBS (200 μL) through the tail vein. At 24 h post injection, prodrug NPs accumulated at the tumor site and were activated to exhibit the maximum fluorescence emission. Then, the mice were treated with US irradiation for 10 min (0.85 W/cm2, 50% cycle, 30 KHZ). The tumor volume and body weight were measured every other day. The mice were sacrificed after 14 days of monitoring to ensure that the tumor volume was not beyond 2000 mm3. All groups of mice were photographed and dissected to collect the heart, liver, spleen, lung, kidney, and tumor. The tumor was further photographed and weighed.
Supplementary Material
Acknowledgements
The work received financial support from the National Natural Science Foundation of China (51903201) and the Natural Science Foundation of Shaanxi Province (2023-YBSF-270). Omer Aras was partially supported by the US National Institutes of Health/National Cancer Institute Cancer Center Support Grant (P30 CA008748).
Footnotes
Conflict of interest
The authors declare no conflict of interest.
References
- 1.Deng X, Shao Z, Zhao Y, Adv. Sci 2021, 8, 2002504. [DOI] [PMC free article] [PubMed] [Google Scholar]
- 2.Gotwals P, Cameron S, Cipolletta D, Cremasco V, Crystal A, Hewes B, Mueller B, Quaratino S, Sabatos-Peyton C, Petruzzelli L, Engelman JA, Dranoff G, Nat. Rev. Cancer 2017, 17, 286. [DOI] [PubMed] [Google Scholar]
- 3.Son S, Kim JH, Wang X, Zhang C, Yoon SA, Shin J, Sharma A, Lee MH, Cheng L, Wu J, Chem. Soc. Rev 2020, 49, 3244. [DOI] [PubMed] [Google Scholar]
- 4.Yue W, Chen L, Yu L, Zhou B, Yin H, Ren W, Liu C, Guo L, Zhang Y, Sun L, Zhang K, Xu H, Chen Y, Nat. Commun 2019, 10, 2025. [DOI] [PMC free article] [PubMed] [Google Scholar]
- 5.Liang S, Deng X, Ma P. a., Cheng Z, Lin J, Adv. Mater 2020, 32, 2003214. [DOI] [PubMed] [Google Scholar]
- 6.Sun D, Pang X, Cheng Y, Ming J, Xiang S, Zhang C, Lv P, Chu C, Chen X, Liu G, Zheng N, ACS Nano 2020, 14, 2063. [DOI] [PubMed] [Google Scholar]
- 7.Liang C, Xie JE, Luo SL, Huang C, Zhang QL, Huang HY, Zhang PY, Nat. Commun 2021, 12, 5001. [DOI] [PMC free article] [PubMed] [Google Scholar]
- 8.Zhao PH, Wu YL, Li XY, Feng LL, Zhang L, Zheng BY, Ke MR, Huang JD, Angew. Chem. Int. Ed 2022, 61, e202113506. [DOI] [PubMed] [Google Scholar]
- 9.Wang H, Guo J, Lin W, Fu Z, Ji X, Yu B, Lu M, Cui W, Deng L, Engle JW, Wu Z, Cai W, Ni D, Adv. Mater 2022, 34, 2110283. [DOI] [PMC free article] [PubMed] [Google Scholar]
- 10.Yang Z, Fan W, Tang W, Shen Z, Dai Y, Song J, Wang Z, Liu Y, Lin L, Shan L, Liu Y, Jacobson O, Rong P, Wang W, Chen X, Angew. Chem. Int. Ed 2018, 57, 14101. [DOI] [PMC free article] [PubMed] [Google Scholar]
- 11.Peng S, Xiao F, Chen M, Gao H, Adv. Sci 2022, 9, 2103836. [DOI] [PMC free article] [PubMed] [Google Scholar]
- 12.Sun S, Chen Q, Tang Z, Liu C, Li Z, Wu A, Lin H, Angew. Chem. Int. Ed 2020, 132, 21227. [DOI] [PubMed] [Google Scholar]
- 13.Yang GB, Xu LG, Chao Y, Xu J, Sun XQ, Wu YF, Peng R, Liu Z, Nat. Commun 2017, 8, 902. [DOI] [PMC free article] [PubMed] [Google Scholar]
- 14.Shen Y, Tian Q, Sun Y, Xu J-J, Ye D, Chen H-Y, Anal. Chem 2017, 89, 13610. [DOI] [PubMed] [Google Scholar]
- 15.Liu Z, Song F, Shi W, Gurzadyan G, Yin H, Song B, Liang R, Peng X, ACS Appl. Mater. Interfaces 2019, 11, 15426. [DOI] [PubMed] [Google Scholar]
- 16.Tan X, Huang J, Wang Y, He S, Jia L, Zhu Y, Pu K, Zhang Y, Yang X, Angew. Chem. Int. Ed 2021, 60, 14051. [DOI] [PubMed] [Google Scholar]
- 17.Ma A, Chen H, Cui Y, Luo Z, Liang R, Wu Z, Chen Z, Yin T, Ni J, Zheng M, Cai L, Small 2019, 15, 1804028. [DOI] [PubMed] [Google Scholar]
- 18.Zhao H, Zhao B, Li L, Ding K, Xiao H, Zheng C, Sun L, Zhang Z, Wang L, Adv. Healthc. Mater 2020, 9, 1901335. [DOI] [PubMed] [Google Scholar]
- 19.Lin X, Song J, Chen X, Yang H, Angew. Chem. Int. Ed 2020, 59, 14212. [DOI] [PubMed] [Google Scholar]
- 20.Huang P, Qian XQ, Chen Y, Yu LD, Lin H, Wane LY, Zhu YF, Shi JL, J. Am. Chem. Soc 2017, 139, 1275. [DOI] [PubMed] [Google Scholar]
- 21.Xie J, Liang C, Luo S, Pan Z, Lai Y, He J, Chen H, Ren Q, Huang H, Zhang Q, Zhang P, ACS Appl. Mater. Interfaces 2021, 13, 27934. [DOI] [PubMed] [Google Scholar]
- 22.Li D, Yang Y, Li D, Pan J, Chu C, Liu G, Small 2021, 17, 2101976. [DOI] [PubMed] [Google Scholar]
- 23.Sun S, Wang D, Yin R, Zhang P, Jiang R, Xiao C, Small 2022, 18, 2202558. [DOI] [PubMed] [Google Scholar]
- 24.Nakanishi T, Ogawa T, Yanagihara C, Tamai I, J. Pharm. Sci, 2015, 104, 3092. [DOI] [PubMed] [Google Scholar]
- 25.Zhang P, Zeng J, Li Y, Yang C, Meng J, Hou Y, Gao M, Angew. Chem. Int. Ed 2021, 60, 8130. [DOI] [PubMed] [Google Scholar]
- 26.Cheng X, Xu H-D, Ran H-H, Liang G, Wu F-G, ACS Nano 2021, 15, 8039. [DOI] [PubMed] [Google Scholar]
- 27.Ji S, Guo H, Yuan X, Li X, Ding H, Gao P, Zhao C,Wu W, Wu W, Zhao J, Org. Lett 2010, 12, 2876. [DOI] [PubMed] [Google Scholar]
- 28.Lin X, Song J, Chen X, Yang H, Angew. Chem. Int. Ed 2020, 59, 14212. [DOI] [PubMed] [Google Scholar]
- 29.Gong Z, Dai Z, Adv. Sci 2021, 8, 2002178. [DOI] [PMC free article] [PubMed] [Google Scholar]
Associated Data
This section collects any data citations, data availability statements, or supplementary materials included in this article.


