Abstract
Objective
MRI findings of the SI joint space in axial SpA (axSpA) include inflammation and fat metaplasia inside an erosion; the latter is also termed ‘backfill’. We compared such lesions with CT to better characterize whether they represent new bone formation.
Methods
We identified patients with axSpA who underwent both CT and MRI of the SI joints in two prospective studies. MRI datasets were jointly screened by three readers for joint space–related findings and grouped into three categories: type A—high short tau inversion recovery (STIR) and low T1 signal; type B—high signal in both sequences; type C—low STIR and high T1 signal. Image fusion was used to identify MRI lesions in CT before we measured Hounsfield units (HU) in each lesion and surrounding cartilage and bone.
Results
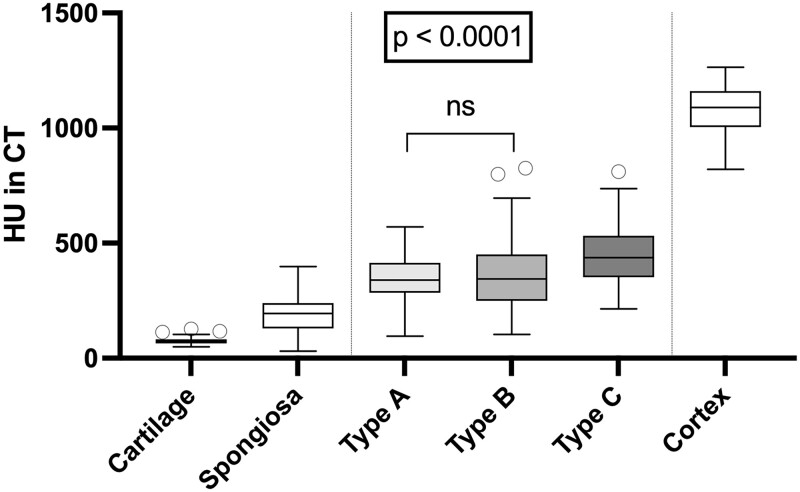
Ninety-seven patients with axSpA were identified and we included 48 type A, 88 type B, and 84 type C lesions (maximum 1 lesion per type and joint). The HU values were 73.6 (s.d. 15.0) for cartilage, 188.0 (s.d. 69.9) for spongious bone, 1086.0 (s.d. 100.3) for cortical bone, 341.2 (s.d. 96.7) for type A, 359.3 (s.d. 153.5) for type B and 446.8 (s.d. 123.0) for type C lesions. Lesion HU values were significantly higher than those for cartilage and spongious bone, but lower than those for cortical bone (P < 0.001). Type A and B lesions showed similar HU values (P = 0.93), whereas type C lesions were denser (P < 0.001).
Conclusion
All joint space lesions show increased density and might contain calcified matrix, suggesting new bone formation, with a gradual increase in the proportion of calcified matrix towards type C lesions (backfill).
Keywords: axial spondyloarthritis, MRI, CT, new bone formation
Rheumatology key messages.
Calcifications are present in several types of sacroiliac joint space lesions, suggesting bone matrix.
Calcifications were found in the classic backfill lesion and in supposed precursor stages.
This may indicate that new bone formation starts in an earlier stage than previously thought.
Introduction
Axial SpA (axSpA) is a disease of the axial skeleton that involves the SI joints in 98% of cases [1]. MRI has shown that the early inflammatory signs of the disease occur in the subchondral bone marrow. Active inflammation is followed by structural changes that typically include erosions, fat lesions and ankylosis [2]. Fat metaplasia inside an erosion cavity, also known as ‘backfill’, is an MRI sign that has been described more recently and is regarded as an intermediate step between erosion and ankylosis [3, 4].
Backfill is assumed to be a repair process occurring when inflammation subsides and is usually considered to precede new bone formation. However, since there is no histological evidence to support this assumption, backfill is defined solely by its appearance in T1-weighted MRIs. To date, little is understood about the development of backfill and whether it precedes, coincides or follows bone matrix calcification—which is new bone formation in the true sense of the term. For this reason, comparison of backfill in MRI with other imaging modalities is highly interesting, especially with CT, which detects tissue calcification that forms when calcium salts precipitate in the intercellular matrix [5]. Bone matrix calcification is known to occur under various physiological and pathophysiological conditions and is the hallmark of new bone formation. However, it is a complex process that is still poorly understood [6].
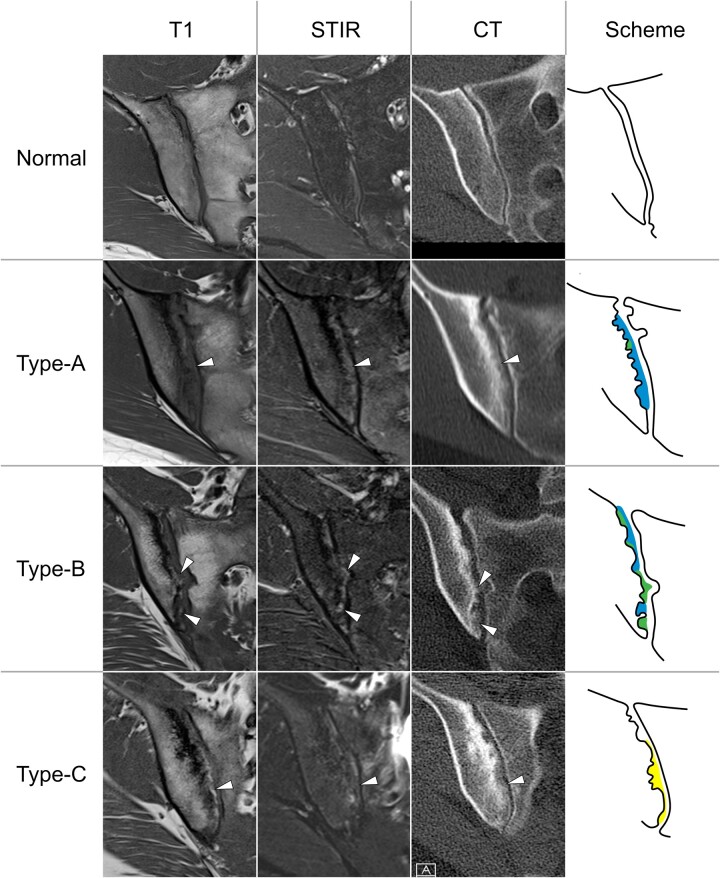
Backfill is an imaging sign that is typically seen in the cartilaginous part of the joint when there is extensive iliac bone erosion and is characterized by fat-equivalent signal intensities with an irregular sclerotic margin towards the non-eroded bone. It is one of two different joint space lesions that have been described by the Assessment of SpondyloArthritis international Society (ASAS) MRI working group. The other is inflammation at the site of erosion. Both lesions are located within erosion cavities, thus the outline of the original erosion is still apparent as a sclerotic margin that is black in both, T1-weighted and short-tau inversion recovery (STIR) images [7]. Inflammation at the site of erosion is characterized by a high signal in fluid sensitive sequences (e.g. STIR), while backfill shows bright signal in unenhanced T1-weighted, non-fat-suppressed pulse sequences. However, little has been reported about the appearance of these lesions in the respective other sequence. Thus there might be lesions that show high signal in both sequences and fulfil either or both of the above definitions. However, for this publication, we define classic backfill as a lesion with a low STIR signal, consistent with the imaging appearance of fat metaplasia [8], and the other lesion as having a low T1 signal. Previous studies suggest that backfill follows inflammation at sites of erosion in the course of the disease [9]. Therefore we propose the following lesion definitions for the purpose of this study (see also Table 1): type A—high signal in STIR and low signal in T1 (i.e. inflammation at the site of erosion); type B—high signal in both sequences (i.e. mixed lesion); and type C—high T1 and low STIR signal (i.e. classical backfill).
Table 1.
Proposed classifications of joint space lesions based on MRI signal intensities
| Lesion type | Lesion name (ASAS definition) | T1 signal | STIR signal |
|---|---|---|---|
| Type A | Inflammation at the site of erosion | Low | High |
| Type B | N/A (mixed lesion) | High | High |
| Type C | Fat metaplasia in an erosion cavity, backfill | High | Low |
The aim of this analysis is to carefully match MRI and CT appearances of these SI joint space lesions and decide which of those findings—if any—actually represent new bone formation as defined by the presence of calcified bone matrix.
Patients and methods
We combined two prospectively investigated populations of patients with suspected axSpA who underwent both MRI and CT of the SI joints from the SacroIliac joint MAgnetic resonance imaging and Computed Tomography (SIMACT) [10] and Virtual Non-CAlcium/Susceptibility Weighted Imaging (VNCa/SWI) [11] trials. Both studies were approved by the institutional review board (EA1/073/10 and EA1/300/19) and all patients gave written informed consent. Only patients with the diagnosis of axSpA established by an expert rheumatologist based on a combination of clinical, laboratory and imaging data were included in the present analysis.
Imaging
All patients underwent MRI and CT on the same day. Although the two studies used different imaging protocols, MRI in both datasets included a T1-weighted and a STIR sequence in oblique coronal orientation. Details of the protocols are reported in the earlier publications on the two studies [10, 11]. In the SIMACT trial, CT was performed with 120 kVp standard and low-dose settings. For the VNCa/SWI trial, 120 kVp equivalent blended images were reconstructed from the original dual-energy datasets. Both CT datasets were subjected to oblique multiplanar reformatting, resulting in oblique coronal image stacks, which were carefully aligned with the corresponding MRIs.
Image reading
Two musculoskeletal radiology experts with 11 and 20 years of experience in axSpA image interpretation and a scientific research medical student evaluated the images in consensus for the presence of joint space lesions and then categorized each lesion into the three lesion types defined above (see Table 1). They applied the strict lesion definitions based on the work of the ASAS group: the lesion is located within an erosion cavity, i.e. confluent erosion with a minimum extent of 5 mm; the lesion has a higher signal intensity in one or both MRI sequences than normal cartilage; the lesion shows a sclerotic margin towards the non-eroded bone, outlining the original border of bone erosion; and the lesion has a minimum extent of 5 mm along the bone surface with relatively constant signal intensities to allow reliable measurement. The readers only had access to the anonymized MRI datasets and were unaware of the corresponding CT images and clinical findings of the respective patients.
Quantitative evaluation
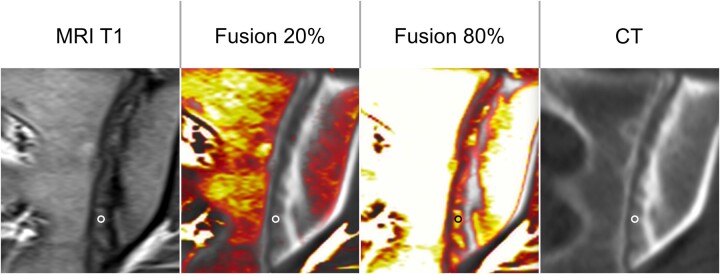
Thereafter, the research student performed region-of-interest (ROI) measurements on the MRI and CT datasets using image fusion techniques (Horos version 3.3.6, Horos Project) to correctly identify the MRI lesions in the CT images. The measurements were performed under the direct supervision of a musculoskeletal radiology expert. Corresponding ROIs of the different lesions were placed in T1-weighted, STIR and CT images, sparing surrounding structures such as normal cartilage, cortical bone, sclerotic margins, subchondral bone and lesions with other imaging characteristics (see Fig. 1). Normal-appearing cartilage (where present in the images), spongious bone (middle of S2 vertebra) and cortical bone (medial cortex of the left iliac bone) were measured for comparison. Only one lesion of a specific type was assessed per SI joint, thus a maximum of six lesions were measured per patient. This approach was used independently of any previously published scoring systems and we explicitly did not use the slice-based approach of the Spondyloarthritis Research Consortium of Canada score.
Figure 1.
ROI with image fusion. To align MRI and CT scans, colour-coded fusion images were generated to identify the lesions visible in MRI on CT. The ROI was placed manually, avoiding partial volume to the normal cartilage, the bone and its margin and other lesions with different imaging characteristics
Statistics
Descriptive statistics are provided for each lesion type and each of the three normal structures measured for comparison. Tukey’s multiple comparison test was used to test for differences in HU values of lesions and control structures. Pearson’s test was applied to identify correlations of T1 and STIR signal intensities with the HU values.
Ethics approval
The present analysis included patients from two prospective studies (approved by the institutional review board under EA1/086/16 and EA1/073/10). All patients gave written informed consent. Patients were not involved in study planning.
Results
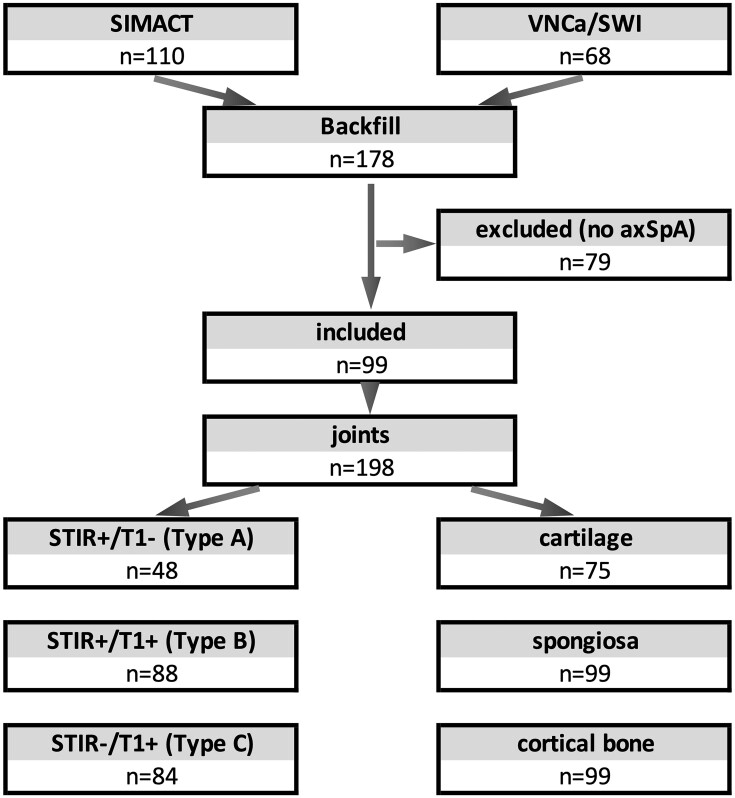
Of 99 axSpA patients, 2 had to be excluded due to missing MRI sequences. We thus analysed a total of 97 patients with a mean age of 37.4 years (s.d. 11.4) (see Fig. 2). Fifty-nine patients (61%) were male, 80% were HLA-B27 positive, 87% had inflammatory back pain and 52% were positive according to the modified New York criteria in radiography. Inflammatory back pain was present in 86% of patients with a BASDAI of 4.5 (s.d. 2.0).
Figure 2.
Flow chart of study inclusion. Of 110 patients (SIMACT) and 68 patients (VNCa/SWI), 99 were diagnosed with axSpA and included in the study. In 198 joints, several lesions (one per type per joint) were identified. In some joints, normal cartilage could not be assessed (e.g. due to extensive ankylosis)
Image reading
Five patients showed bilateral ankylosis and were therefore excluded from joint space measurement. Measurable joint space lesions were identified in 84/97 (86.6%) patients. The readers found 48 type A lesions in 39 patients, 88 type B lesions in 54 patients and 84 type C lesions in 53 patients (for examples, see Fig. 3). Moreover, the readers noted that some, but not all, lesions showed a visible line of low signal intensity in both sequences, like the sclerotic margin towards the non-eroded bone but here towards the joint space. Normal cartilage was identified in only 75 patients.
Figure 3.
Different types of joint space lesions on MRI and CT. All lesions (arrowheads) show faint bone matrix calcifications, irrespective of their imaging characteristics on MRI
Quantitative evaluation
The results of the quantitative analysis are shown in Fig. 4. There was moderate correlation of the measured HU values with MRI signal intensities in T1 (Pearson’s r = 0.57, P < 0.0001) and STIR sequences (r = 0.42, P < 0.0001).
Figure 4.
CT attenuation measurement of three types of joint space lesions and three normal tissue structures. All lesions show higher HU values compared with normal cartilage and spongious bone but lower HU values than cortical bone. Type C lesions have higher HU values than the other lesion types. Except for the difference in HU between type A and B lesions, all differences are significant
Discussion
We present the first systematic comparison of the appearances of joint space lesions in CT and MRI datasets. To this end, we investigated backfill, inflammation at the site of erosion and mixed lesions. Our HU measurements suggest that all lesions show increased density in CT towards containing calcified bone matrix, with the greatest amount seen in type C, i.e. classic backfill, which can thus be assumed to represent new bone formation. Surprisingly, we found a moderate but significant correlation of MRI signal intensities with CT attenuation measured in HU, underlining that higher MRI signal intensities reflect cell infiltration and can be interpreted to coincide with the formation of calcified tissue matrix. Nonetheless, we suspect that there might be a more sophisticated continuum of lesions, sometimes with less or missing matrix calcification, as suggested by our broad lesion definition.
The results add to previous assumptions that backfill follows inflammation at sites of erosion, with gradually increasing calcification [9]. As all measured joint space lesions are, in fact, new bone formation, we think that a critical reappraisal of the current nomenclature is warranted as neither ‘fat metaplasia inside an erosion cavity’ nor ‘inflammation at the site of erosion’ fully captures the nature of those changes. We suggest that the lesions, when their strict definitions are applied, represent neither exclusively fatty metaplasia nor inflammatory tissue, but varying stages of bone repair, which is a characteristic imaging finding nearly exclusively seen in spondyloarthritides. Based on the current findings, our group proposes the classification presented in Table 1. Given that the readers in this study observed formation of new cortical bone in some lesions, a further refinement of the suggested categories might be warranted.
The proposed classification system might help in expanding our understanding of new bone formation in axSpA in future clinical and imaging studies. However, longitudinal data are needed to support the notion of a sequence from A to C lesions with increasing matrix calcification. In the clinical setting, the notion that ‘inflammation at the site of erosion’ is also new bone formation can increase the confidence in diagnosing axSpA in imaging, as new bone formation is widely recognized as a rather specific finding in axSpA [12, 13]. Therefore, radiologists and other physicians interpreting MRIs in axSpA patients should acknowledge those lesions as such [14].
In our collective, we found measurable lesions in 86% of patients and backfill in 54% of patients, which is more than was reported in previous studies. We explain this difference with the increased attention for measuring these lesions and a patient collective with rather advanced stages of sacroiliitis; 52% of patients had a positive radiograph and all patients showed sacroiliitis on MRI.
While our study provides the first comparative CT and MRI data on the described joint space lesions and both study populations were investigated prospectively, a limitation is that we analysed an inhomogeneous imaging dataset because different imaging protocols were used in the two study populations. Moreover, no longitudinal data were available for assessing further lesion development, especially in response to treatment. Such an initiative was beyond the scope of this project. The lesions were identified in a consensus reading and we deliberately did not use a blinded scoring approach because we neither wanted to ascertain the diagnostic accuracy of the imaging tests nor measure the interrater reliability of a scoring approach, but rather intended to identify the lesions for measurement with the best expertise of two agreeing expert readers. While we took great care in aligning the MRI and CT datasets and correctly identifying the lesions in CT using image fusion, the lesions are nonetheless small, making ROI measurement difficult and prone to partial volume and other hampering effects. However, as we were able to measure the normal cartilage within the joint space reliably, partial volume effects or measurement errors due to misplaced ROIs seem to be non-relevant confounders for our analysis. Furthermore, high signal intensities within the joint space, especially in the STIR sequence, are regularly seen in healthy individuals or patients with mechanical back pain as well. However, in our study, we strictly applied the lesion definitions as proposed by the ASAS, with a special focus on location of the lesion within the cavity of bone erosion.
In conclusion, our findings indicate that inflammation at sites of erosion, backfill or fat metaplasia inside an erosion cavity and mixed lesions contain calcification as suggested by increased density on CT and thus should be ranked among new bone formation. Future longitudinal studies should investigate the development and evolution of such lesions and ascertain their value as an outcome parameter or for diagnostic purposes.
Acknowledgements
The authors thank Bettina Herwig for language editing.
Contributor Information
Torsten Diekhoff, Department of Radiology, Charité - Universitätsmedizin Berlin, Campus Mitte, Humboldt-Universität zu Berlin, Freie Universität Berlin, Berlin, Germany.
Denis Poddubnyy, Department of Gastroenterology, Infectiology and Rheumatology (including Nutrition Medicine), Charité, Universitätsmedizin Berlin, corporate member of Freie Universität Berlin and Humboldt-Universität zu Berlin, Berlin, Germany.
Fabian Proft, Department of Gastroenterology, Infectiology and Rheumatology (including Nutrition Medicine), Charité, Universitätsmedizin Berlin, corporate member of Freie Universität Berlin and Humboldt-Universität zu Berlin, Berlin, Germany.
Katharina Ziegeler, Department of Radiology, Charité - Universitätsmedizin Berlin, Campus Mitte, Humboldt-Universität zu Berlin, Freie Universität Berlin, Berlin, Germany.
Dominik Deppe, Department of Radiology, Charité - Universitätsmedizin Berlin, Campus Mitte, Humboldt-Universität zu Berlin, Freie Universität Berlin, Berlin, Germany.
Christoph Niedermeier, Department of Radiology, Charité - Universitätsmedizin Berlin, Campus Mitte, Humboldt-Universität zu Berlin, Freie Universität Berlin, Berlin, Germany.
Kay Geert A Hermann, Department of Radiology, Charité - Universitätsmedizin Berlin, Campus Mitte, Humboldt-Universität zu Berlin, Freie Universität Berlin, Berlin, Germany.
Data availability
All source data are available upon reasonable request to the corresponding author.
Authors’ contributions
C.N. and K.G.A.H. contributed equally. T.D., D.P. and K.G.H. designed the study. T.D. and D.D. performed the imaging examinations. T.D., C.N. and K.G.H. performed the image analysis. C.N. performed the measurements under supervision of T.D. D.P. and F.P. provided the clinical data. T.D., K.Z. and C.N. performed the statistical analysis. T.D. drafted the manuscript. All authors critically revised the manuscript for important intellectual content and approved the final version.
Funding
No specific funding was received from any bodies in the public, commercial or not-for-profit sectors to carry out the work described in this article.
Disclosure statement: T.D. reports speaker fees from Canon Medical Systems, Novartis, MSD, BIOCAD, UCB and Roche and advisory board member fees from Eli Lilly outside the submitted work. D.P. reports research support from AbbVie, Eli Lilly, MSD, Novartis and Pfizer; consulting fees from AbbVie, BIOCAD, Eli Lilly, Gilead, GlaxoSmithKline, Janssen, MSD, Moonlake, Novartis, Pfizer, Samsung Bioepis and UCB and speaker fees from AbbVie, Bristol-Myers Squibb, Eli Lilly, Janssen, MSD, Medscape, Novartis, Peervoice, Pfizer and UCB. F.P. reports grants and personal fees from Novartis, Eli Lilly and UCB and personal fees from AbbVie, Amgen, Bristol-Myers Squibb, Hexal, MSD, Pfizer and Roche, all outside the submitted work. K.Z. reports funding from the ASAS outside the submitted work. The remaining authors report no conflicts of interest.
References
- 1. Sieper J, Poddubnyy D.. Axial spondyloarthritis. Lancet 2017;390:73–84. [DOI] [PubMed] [Google Scholar]
- 2. Lambert RG, Bakker PA, van der Heijde D. et al. Defining active sacroiliitis on MRI for classification of axial spondyloarthritis: update by the ASAS MRI working group. Ann Rheum Dis 2016;75:1958–63. [DOI] [PubMed] [Google Scholar]
- 3. Maksymowych WP, Wichuk S, Chiowchanwisawakit P, Lambert RG, Pedersen SJ.. Fat metaplasia and backfill are key intermediaries in the development of sacroiliac joint ankylosis in patients with ankylosing spondylitis. Arthritis Rheumatol 2014;66:2958–67. [DOI] [PubMed] [Google Scholar]
- 4. Poddubnyy D, Sieper J.. Mechanism of new bone formation in axial spondyloarthritis. Curr Rheumatol Rep 2017;19:55. [DOI] [PubMed] [Google Scholar]
- 5. Hoshi K, Ejiri S, Ozawa H.. Ultrastructural, cytochemical, and biophysical aspects of mechanisms of bone matrix calcification. Kaibogaku Zasshi 2000;75:457–65. [PubMed] [Google Scholar]
- 6. Grabowski P. Physiology of bone. Calcium Bone Disord Children Adolesc 2015;28:33–55. [DOI] [PubMed] [Google Scholar]
- 7. Maksymowych WP, Lambert RG, Østergaard M. et al. MRI lesions in the sacroiliac joints of patients with spondyloarthritis: an update of definitions and validation by the ASAS MRI working group. Ann Rheum Dis 2019;78:1550–8. [DOI] [PubMed] [Google Scholar]
- 8. Ziegeler K, Eshkal H, Schorr C. et al. Age- and sex-dependent frequency of fat metaplasia and other structural changes of the sacroiliac joints in patients without axial spondyloarthritis: a retrospective, cross-sectional MRI study. J Rheumatol 2018;45:915–21. [DOI] [PubMed] [Google Scholar]
- 9. Maksymowych WP, Claudepierre P, de Hooge M. et al. Structural changes in the sacroiliac joint on MRI and relationship to ASDAS inactive disease in axial spondyloarthritis: a 2-year study comparing treatment with etanercept in EMBARK to a contemporary control cohort in DESIR. Arthritis Res Ther 2021;23:43. [DOI] [PMC free article] [PubMed] [Google Scholar]
- 10. Diekhoff T, Hermann KG, Greese J. et al. Comparison of MRI with radiography for detecting structural lesions of the sacroiliac joint using CT as standard of reference: results from the SIMACT study. Ann Rheum Dis 2017;76:1502–8. [DOI] [PubMed] [Google Scholar]
- 11. Deppe D, Hermann KG, Proft F. et al. CT-like images of the sacroiliac joint generated from MRI using susceptibility-weighted imaging (SWI) in patients with axial spondyloarthritis. RMD Open 2021;7:e001656. [DOI] [PMC free article] [PubMed] [Google Scholar]
- 12. Herrada I, Devilliers H, Fayolle C. et al. Diagnostic performance of sacroiliac and spinal MRI for the diagnosis of non-radiographic axial spondyloarthritis in patients with inflammatory back pain. Joint Bone Spine 2021;88:105106. [DOI] [PubMed] [Google Scholar]
- 13. Diekhoff T, Eshed I, Radny F. et al. Choose wisely: imaging for diagnosis of axial spondyloarthritis. Ann Rheum Dis 2022;81:237–42. [DOI] [PMC free article] [PubMed] [Google Scholar]
- 14. Laloo F, Herregods N, Jaremko JL. et al. MRI of the axial skeleton in spondyloarthritis: the many faces of new bone formation. Insights Imaging 2019;10:67. [DOI] [PMC free article] [PubMed] [Google Scholar]
Associated Data
This section collects any data citations, data availability statements, or supplementary materials included in this article.
Data Availability Statement
All source data are available upon reasonable request to the corresponding author.


